

Sub-Saharan African Immigrants in the United States

An immigrant family on a walk in Phoenix, AZ (Photo: IOM/Christophe Calais/In Visu)
Contemporary migration from sub-Saharan Africa to the United States, which is a relatively recent phenomenon, has risen steadily over the past several decades. The sub-Saharan African immigrant population roughly doubled every decade between 1980 and 2010, and increased by 29 percent over the following five years. In 2015, 1.7 million sub-Saharan Africans lived in the United States, accounting for a small but growing share (4 percent) of the 43.3 million immigrants in the United States. They also made up 83 percent of the 2.1 million immigrants from Africa, the remainder coming from North Africa. The current flow of sub-Saharan Africans consists of skilled professionals, individuals seeking reunification with relatives, and refugees from war-torn countries.
Figure 1. Sub-Saharan African Immigrant Population in the United States, 1980-2015

Source: Data from U.S. Census Bureau 2006, 2010, and 2015 American Community Surveys (ACS), and Campbell J. Gibson and Kay Jung, " Historical Census Statistics on the Foreign-born Population of the United States: 1850-2000" (Working Paper no. 81, U.S. Census Bureau, Washington, DC, February 2006), available online.
In 2015, 80 percent of sub-Saharan Africans came from Eastern and Western Africa, with Nigeria, Ethiopia, Ghana, Kenya, and South Africa comprising the top sending countries. Together, these five countries accounted for more than 54 percent of all sub-Saharan Africans in the United States (see Table 1).
Table 1. Distribution of Sub-Saharan African Immigrants by Country and Region of Origin, 2015

Notes: Due to ACS data limitation, people shown in the “Africa, not else classified” (Africa, n.e.c.) category, who did not report their country of birth, were included in the sub-Saharan African foreign-born group though some may have been from North Africa. The 110,000 foreign born from the residual “Africa, n.e.c.” category accounted for 5 percent of the total 2.1 million African-born immigrants and for 6 percent of the 1.7 million sub-Saharan African-born immigrants. The formal name of Cape Verde was changed to Cabo Verde in 2013.
Source: Migration Policy Institute (MPI) tabulation of data from the U.S. Census Bureau 2015 ACS.
Most sub-Saharan African immigrants who obtain lawful permanent residence in the United States (also known as receiving a green card) arrive as immediate relatives of U.S. citizens, as refugees, or through the Diversity Visa Lottery. Compared to the total foreign-born population, sub-Saharan Africans were among the best educated immigrants as a group and were less likely to be Limited English Proficient (LEP). Sub-Saharan Africans experienced a slightly higher poverty rate than immigrants overall, but lower uninsured rates.
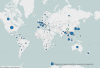 Click here to view an interactive map showing where migrants from sub-Saharan Africa (and elsewhere) have settled worldwide.
Using data from the U.S. Census Bureau (the most recent 2015 American Community Survey [ACS] as well as pooled 2011-15 ACS data), the Department of Homeland Security’s Yearbook of Immigration Statistics, and World Bank annual remittances data, this Spotlight provides information on the sub-Saharan African immigrant population in the United States, focusing on its size, geographic distribution, and socioeconomic characteristics.
Note: While the characteristics of the overall sub-Saharan African population are based on the entire subregion, analysis of individual countries in this article covers only the largest origin groups: Nigerians, Ethiopians, Ghanaians, Kenyans, South Africans, Liberians, and Somalis.
Click on the bullet points below for more information:
- Distribution by State and Key Cities
- Language Diversity and English Proficiency
- Age, Education, and Employment
- Poverty
- Immigration Pathways and Naturalization
- Health Coverage
- Diaspora
- Remittances
Distribution by State and Key Cities
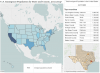
Compared to the overall immigrant population, sub-Saharan Africans were more spread out geographically. As of 2011-15, the largest shares of sub-Saharan African immigrants settled in Texas (10 percent), New York (9 percent), and Maryland (9 percent). The top four counties by concentration of sub-Saharan Africans were Bronx County, NY; Montgomery County, MD; Harris County, TX; and Prince George’s County, MD. Together, these counties accounted for about 12 percent of the total sub-Saharan immigrant population in the United States.
Figure 2. Top Destination States for Sub-Saharan African Immigrants in the United States, 2011-15

Note: Pooled 2011-15 ACS data were used to get statistically valid estimates at the state and metropolitan statistical area levels, for smaller-population geographies. Not shown are populations in Alaska and Hawaii, which are small in size; for details, visit the MPI Data Hub for an interactive map showing geographic distribution of immigrants by state and county, available online.
Source: MPI tabulation of data from U.S. Census Bureau pooled 2011-15 ACS.
 Click here for an interactive map that shows the geographic distribution of immigrants by state and county. Select individual sub-Saharan African countries from the dropdown menu to see which states and counties have the most immigrants.
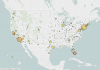
In the 2011-15 period, the U.S. cities with the greatest number of sub-Saharan immigrants were the greater New York City, Washington, DC, and Atlanta metropolitan areas (see Figure 3). These three metro areas accounted for about 27 percent of sub-Saharan Africans in the United States.
Figure 3. Top Metropolitan Destinations for Sub-Saharan Africans in the United States, 2011-15

Note: Pooled 2011-15 ACS data were used to get statistically valid estimates at the metropolitan statistical-area level for smaller-population geographies.
Source: MPI tabulation of data from the U.S. Census Bureau pooled 2011-15 ACS.
 Click here for an interactive map that highlights the metropolitan areas with the highest concentrations of immigrants. Select individual sub-Saharan African countries from the dropdown menu to see which metro areas have the most immigrants.
Table 2. Top Concentrations by Metropolitan Area for the Foreign Born from Sub-Saharan Africa, 2011-15

Source: MPI tabulation of data from U.S. Census Bureau pooled 2011-15 ACS.
Language Diversity and English Proficiency
Sub-Saharan immigrants were more likely to be proficient in English and speak English at home than the overall U.S. foreign-born population, largely because a majority came from countries where English is an official language. In 2015, 25 percent of sub-Saharan Africans spoke only English at home, versus 16 percent of all immigrants. Furthermore, 27 percent of these immigrants (ages 5 and over) reported limited English proficiency, compared to 49 percent of the overall foreign-born population. Individual-country groups made up predominately of refugees had much higher limited English proficiency (LEP) levels, however, than the regional average: 62 percent of Somalis and 41 percent of Ethiopians were LEP in 2015, for instance. Other than English, top languages spoken were Kru, Amharic, French, Somali, and Swahili.
Note: Limited English proficiency refers to those who indicated on the ACS questionnaire that they spoke English less than “very well.”
Age, Education, and Employment
The sub-Saharan African population was slightly younger than the overall U.S. foreign-born population but older than the native born. In 2015, a higher share (83 percent) of sub-Saharan immigrants were of working age (18 to 64), compared to the overall foreign-born (80 percent) and U.S.-born (60 percent) populations.
Figure 4. Age Distribution by Origin, 2015

Source: MPI tabulation of data from the U.S. Census Bureau, 2015 ACS.
Sub-Saharan immigrants have much higher educational attainment compared to the overall foreign- and native-born populations. In 2015, 39 percent of sub-Saharan Africans (ages 25 and over) had a bachelor’s degree or higher, compared to 29 percent of the total foreign-born population and 31 percent of the U.S.-born population. Nigerians and South Africans were the most highly educated, with 57 percent holding at least a bachelor’s degree, followed by Kenyans (44 percent), Ghanaians (40 percent), Liberians (32 percent), and Ethiopians (29 percent). Meanwhile, Somalis had the lowest educational attainment of all sub-Saharan Africans, with 11 percent having graduated from a four-year college.
Sub-Saharan Africans participated in the labor force at a higher rate than the overall immigrant and U.S.-born populations. In 2015, about 75 percent of sub-Saharan immigrants (ages 16 and over) were in the civilian labor force, compared to 66 percent and 62 percent of the overall foreign- and native-born populations, respectively.
Compared to the total foreign-born population, sub-Saharan Africans were much more likely to be employed in management, business, science, and arts occupations (38 percent) and much less likely to be employed in natural resources, construction, and maintenance occupations (3 percent; see Figure 5). The occupational distribution by origin group follows the pattern of educational attainment: South African (62 percent) and Nigerian (53 percent) immigrants were the most likely to be in management positions, while 37 percent of Somali immigrants worked in production, transportation, and material moving occupations.
Figure 5. Employed Workers in the Civilian Labor Force (ages 16 and older) by Occupation and Origin, 2015
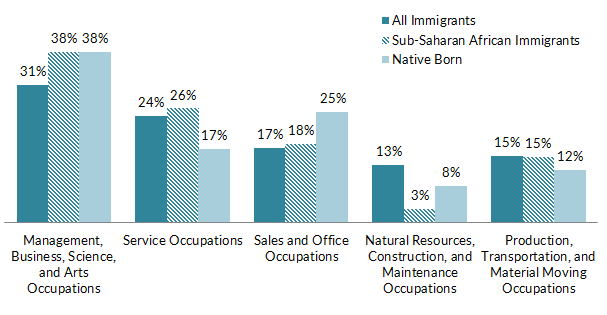
Source: MPI tabulation of data from the U.S. Census Bureau 2015 ACS.
In 2015, sub-Saharan Africans were slightly more likely to live in poverty (19 percent) than all immigrants (17 percent) or the U.S. born (14 percent). Poverty rates were highest among Somalis (46 percent) and Liberians (22 percent).
Immigration Pathways and Naturalization
Compared to immigrants overall, sub-Saharan Africans had a slightly higher naturalization rate. Fifty-three percent were naturalized U.S. citizens, compared to 48 percent of all immigrants. Naturalization rates exceeded 50 percent for most sub-Saharan origin groups, with the exception of Kenyans (47 percent).
Sub-Saharan Africans were more likely than immigrants overall to have entered since 2000. Approximately 65 percent arrived in 2000 or later, compared to 44 percent of all immigrants (see Figure 6).
Figure 6. Sub-Saharan Africans and All Immigrants in the United States by Period of Arrival, 2015

Source: MPI tabulation of data from the U.S. Census Bureau 2015 ACS.
In fiscal year (FY) 2015, half of the 79,000 sub-Saharan immigrants who became lawful permanent residents (LPRs) did so as immediate relatives of U.S. citizens or through family-sponsored preferences (42 percent and 10 percent, respectively; see Figure 7). New LPRs from sub-Saharan Africa were much more likely to have been admitted through the Diversity Visa Lottery (17 percent) or as refugees (26 percent) than immigrants from most other regions. Meanwhile, sub-Saharan Africans were much less likely to become green-card holders via employment pathways (5 percent) compared to the overall LPR population (14 percent). The majority of new LPRs from the Central African Republic (88 percent), Djibouti (86 percent), and Somalia (83 percent) obtained their green cards by adjusting from refugee or asylee status, while more than one-third of new green-card holders from Liberia (47 percent), Benin (39 percent), Togo (35 percent), and Cameroon (34 percent) did so via the Diversity Visa program.
Figure 7. Immigration Pathways of Sub-Saharan Africans and All Immigrants in the United States, 2015

Notes: Family-sponsored: Includes adult children and siblings of U.S. citizens as well as spouses and children of green-card holders. Immediate relatives of U.S. citizens: Includes spouses, minor children, and parents of U.S. citizens. Diversity Visa Lottery: The Immigration Act of 1990 established the Diversity Visa Lottery to allow entry to immigrants from countries with low rates of immigration to the United States. The law states that 55,000 diversity visas are made available each fiscal year. For the 2018 Diversity Visa program, nationals of all countries in sub-Saharan Africa except Nigeria are eligible to participate in the lottery.
Source: MPI tabulation of data from Department of Homeland Security (DHS), 2015 Yearbook of Immigration Statistics (Washington, DC: DHS Office of Immigration Statistics, 2016), available online.
In 2015, sub-Saharan Africans were more likely to be covered by private health insurance (60 percent) compared to the overall foreign-born population (55 percent; see Figure 8). They were also less likely to be uninsured than immigrants overall (17 percent versus 22 percent). Among sub-Saharan origin groups, South Africans had the lowest uninsured share (8 percent) while Liberians had the highest rate (18 percent).
Figure 8. Health Coverage for Sub-Saharan Africans, All Immigrants, and the Native Born, 2015

Note: The sum of shares by type of insurance is likely to be greater than 100 because people may have more than one type of insurance.
Source: MPI tabulation of data from the U.S. Census Bureau 2015 ACS.
Approximately 3.3 million members of the sub-Saharan African diaspora resided in the United States, including individuals who were either born in the region or who reported sub-Saharan African ancestry, according to tabulations from the U.S. Census Bureau pooled 2011-15 ACS.
Remittances received by sub-Saharan African countries via formal channels have risen nearly ten-fold since 2000, reaching $35 billion in 2015, according to the World Bank. Global remittances account for about 3 percent of overall gross domestic product (GDP) in the region. Some economies in this region are more dependent on remittance than others: remittances accounted for 31 percent of GDP in Liberia, 22 percent in The Gambia, 18 percent in Lesotho, 14 percent in Senegal, and 12 percent in Cabo Verde, versus just 0.01 percent in Angola and 0.3 percent in South Africa.
Figure 9. Annual Remittance Flows to Sub-Saharan African Countries, 1980-2015

Source: MPI tabulations of data from the World Bank Prospects Group, “Annual Remittances Data,” April 2017 update.
Visit the Data Hub’s collection of interactive remittances tools, which track remittances by inflow and outflow, between countries, and over time.
Sources
Capps, Randy, Kristen McCabe, and Michael Fix. 2012. Diverse Streams: African Migration to the United States. Washington, DC: Migration Policy Institute. Available online.
Department of Homeland Security (DHS), Office of Immigration Statistics. 2016. 2015 Yearbook of Immigration Statistics. Washington, DC: DHS Office of Immigration Statistics. Available online.
Gibson, Campbell J. and Kay Jung. 2006. Historical Census Statistics on the Foreign-born Population of the United States: 1850-2000. Working Paper No. 81, U.S. Census Bureau, Washington, DC, February 2006. Available online.
Ruggles, Steven, Katie Genadek, Ronald Goeken, Josiah Grover, and Matthew Sobek. 2015. Integrated Public Use Microdata Series: Version 6.0 [dataset]. Minneapolis: University of Minnesota. Available online.
Thomas, Kevin J.A. 2011. What Explains the Increasing Trend in African Emigration to the U.S.? International Migration Review 45 (1): 3-28.
U.S. Census Bureau. 2016. 2015 American Community Survey. American FactFinder. Available online.
World Bank Prospects Group. 2017. Annual Remittances Data, April 2017 update. Available online.