

Immigrants from Asia in the United States
Editor's Note: Some corrections in the data have been made, including the proportion of Asian born from the Philippines, India, and China; the number of Asian immigrants in Hawaii; and the number of Asian immigrants granted asylum.
Nearly 20 years ago, Congress established the month of May as Asian-Pacific American Heritage Month to recognize two events: the arrival of first Japanese immigrants on May 7, 1843, and the contributions of Chinese immigrant laborers in the building of the transcontinental railroad, which was completed on May 10, 1869. In observance of Asian-Pacific American Heritage Month, we share the most recent facts and statistics about immigrants from Asia.
As of 2009, there were more than 10.6 million Asian immigrants in the United States. Immigration from Asia has increased considerably since the 1965 U.S. Immigration and Nationality Act, which removed national-origin quotas that favored European immigration. In 1960, the Asian born accounted for just 5 percent of the foreign-born population in the United States, but by 2009, their share increased more than five-fold to account for nearly 28 percent of immigrants. Today, the Asian born are the country's second-largest immigrant population by world region of birth, behind those from Latin America.
The top three countries of origin of Asian immigrants are the Philippines, India, and China, and California, New York, and Texas are home to nearly half of all Asian immigrants in the country (for more information on immigrants by state, please see the ACS/Census Data tool on the MPI Data Hub).
As a group, the foreign born from Asian countries are more likely to have post-secondary education, superior English language proficiency, and higher-level occupations than the overall immigrant population. However, closer examination of the Asian immigrant population reveals a great deal of variation by country of birth.
This spotlight focuses on a large, diverse group of immigrants from Asia and examines the population's size, geographic distribution, and demographic and socioeconomic characteristics. The data used are the most recent detailed data available, and come from the U.S. Census Bureau's 2009 American Community Survey (ACS), the 2000 Decennial Census (as well as earlier censuses), and the Yearbook of Immigration Statistics 2010 from the Department of Homeland Security's Office of Immigration Statistics.
|
Definitions
|
||
|
Click on the bullet points below for more information:
Size and Geographic Distribution
- There were more than 10.6 million Asian immigrants residing in the United States in 2009.
- The Asian-born population in the United States has increased by 22 times over the past 50 years.
- Immigrants born in South Eastern and Eastern Asian countries accounted for most of the increase in the numbers of the Asian-born population between 1960 and 2009.
- In 2009, South Eastern Asians made up the largest proportion of the Asian born, followed by those from Eastern, South Central, and Western Asia.
- Foreign born from the Philippines, India, and China accounted for nearly half of all Asian-born immigrants in 2009.
- One-third of all Asian immigrants resided in California in 2009.
- More than three-quarters of Hawaii's immigrants were from Asia.
Legal and Unauthorized Asian Immigrants
- Asian immigrants accounted for 11 percent of all unauthorized immigrants in 2010.
- From 2001 to 2010, the Asian born accounted for 47.2 percent of refugee arrivals and 43.2 percent of persons granted asylum.
- Nearly 3.8 million Asian foreign born became lawful permanent residents of the United States between 2001 and 2010.
- In 2010, more than 250,000 immigrants from Asia became U.S. citizens through naturalization.
|
Methodology
|
||
|
Demographic and Socioeconomic Overview
- Almost one-third of all Asian immigrants entered the United States between 2000 and 2009.
- More than 80 percent of the foreign born from Asia were of working age.
- Asian immigrant women outnumbered men in 2009.
- More than half of Asian immigrants either spoke only English or spoke English "very well."
- Nearly half of Asian immigrant adults age 25 and older had a Bachelor's degree or higher.
- Asian-born men were more likely to participate in the civilian labor force than were U.S.-born men.
- Employed Asian immigrants were more concentrated in highly skilled occupations such as management, information technology, and science and engineering than were immigrants overall.
- Asian immigrants accounted for 58 percent of all immigrant physicians and surgeons and 52 percent of all immigrant registered nurses.
- Asian immigrants were less likely than the overall immigrant population to live in poverty.
Size and Geographic Distribution
There were more than 10.6 million Asian immigrants residing in the United States in 2009.
There were 10,652,000 foreign born from Asia residing in the United States in 2009, accounting for 27.7 percent of the country's 38.5 million immigrants.
The Asian-born population in the United States has increased by 22 times over the past 50 years.
The number of Asian immigrants grew from 491,000 in 1960 to more than 10.6 million in 2009, representing a 22-fold increase. Currently, the foreign born from Asia account for 27.7 percent of the total immigrant population, slightly up from 26.4 percent as a share of the overall foreign born in 2000 (see Table 1).
While the size of the Asian immigrant population continues to increase, the population's rate of growth has slowed throughout each decade since 1980. Between 1970 and 1980, the number of Asian born in the United States grew substantially, tripling from 825,000 to 2.5 million within just one decade. The group then nearly doubled to more than 4.9 million during the 1980s, but increased by 65 percent from 1990 to 2000 (to 8.2 million) and by just 29 percent from 2000 to 2009 (to more than 10.6 million).
|
Table 1. Growth of the Asian-Born Population, 1960 to 2009 (in thousands)
|
||||||||||||||||||||||||||||||||
|
||||||||||||||||||||||||||||||||
Immigrants born in South Eastern and Eastern Asian countries accounted for most of the increase in the numbers of the Asian-born population between 1960 and 2009.
The bulk of the increase of Asian-born immigrants occurred after 1970, particularly among those from South Eastern and Eastern Asian countries (see Methodology).
Although partly due to the addition of some former Soviet Union (FSU) countries that were previously classified as European, the number of people from South Central Asia also increased dramatically. The increase in the number of foreign born from Western Asia was more gradual, but steady.
|
|
||
|
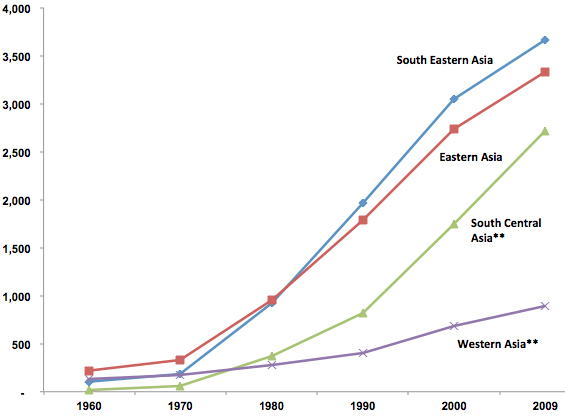
In 2009, South Eastern Asians made up the largest proportion of the Asian-born population, followed by those from Eastern, South Central, and Western Asia.
South Eastern Asians numbered 3,667,000, accounting for 34.4 percent of the overall Asian-born population in 2009. The main countries of origin from this region were the Philippines (1,726,000), Vietnam (1,152,000), and Thailand (203,000).
People from Eastern Asian countries made up 31.3 percent of the Asian-born population at 3,334,000. Those born in China/Hong Kong accounted for the largest number of foreign born from this region (1,642,000), followed by South Korea and North Korea (1,004,000) and Taiwan (348,000).
Immigrants from South Central Asian countries numbered 2,714,000, and accounted for 25.5 percent of the Asian-born population. India contributed the largest group from this region by far (1,665,000), followed by Iran (363,000) and Pakistan (284,000).
Western Asians (893,000) made up 8.4 percent of the foreign-born population from Asia. The main countries of origin were Iraq (154,000), Israel (140,000), and Lebanon (124,000).
Foreign born from the Philippines, India, and China accounted for nearly half of all Asian-born immigrants in 2009.
Immigrants from the top three origin countries of Asia – the Philippines (16.2 percent), India (15.6 percent), and China (15.4 percent) – accounted for about one in two Asian immigrants in the United States in 2009 (see Figure 2). Together with Vietnam (10.8 percent) and Korea (9.4 percent), these countries sent more than two-thirds of all Asian-born immigrants. Moreover, 81.9 percent of all Asian foreign born in the United States came from just ten Asian countries of origin.
|
|
||
|
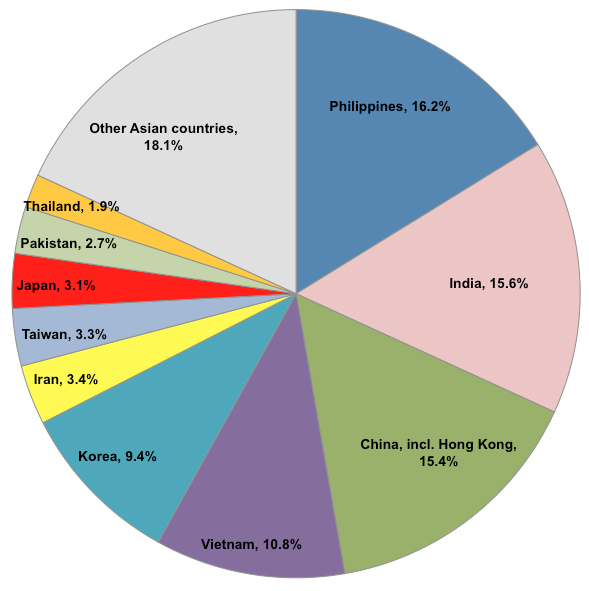
In addition to being the largest single group of all Asian immigrants, the foreign born from the Philippines were among the top ten foreign-born populations overall in the United States in 2009, together with India, China, Vietnam, and Korea. Immigrants from the Philippines and Korea have been among the top ten foreign-born groups each decade since 1980.
- See pie charts showing the top ten countries of birth of immigrants residing in the United States for 1960 through 2010.
- Review data on general U.S. Historical Immigration Trends here.
One-third of all Asian immigrants resided in California in 2009.
In 2009, California had the largest number of resident Asian immigrants with a total of 3,489,000, or 32.8 percent of the total Asian-born population in the United States, followed distantly by New York with 1,102,000 (10.3 percent).
Also among the top five states with the largest Asian immigrant population were Texas (702,000, or 6.6 percent), New Jersey (548,000, or 5.1 percent), and Illinois (449,000, or 4.2 percent).
More than three-quarters of Hawaii's immigrants were from Asia.
In 2009, 78.2 percent of all 224,000 immigrants residing in Hawaii were Asian born, due in part to a long history of Asian migration to Hawaii (particularly from the Philippines, China, and Japan).
Additionally, the Asian born comprised slightly more than half (51.6 percent) of all immigrants in Alaska and West Virginia, and numbered 25,000 and 12,000, respectively. Although they did not constitute a majority, Asian immigrants accounted for a large share of the total immigrant population in Michigan (45.5 percent), Virginia (41.4 percent), and Washington (39.0 percent).
|
Table 2. Top 15 U.S. States with the Largest Number of Asian Immigrants
|
||||||||||||||||||||||||||||||||||||||||||||||||||||||||||||||||||||||
|
|
Table 3. Top 15 U.S. States with Largest Share of Asian Immigrants among State Immigrant Population
|
|||||||||||||||||||||||||||||||||||||||||||||||||||||||||||||||||||||||||||||||||||||||
|
Legal and Unauthorized Asian Immigrants
Asian immigrants accounted for 11 percent of all unauthorized immigrants in 2010.
The Pew Hispanic Center estimates that there were 1.3 million unauthorized immigrants from Asia in the United States in March 2010. Asian immigrants accounted for 11 percent of the total 11.2 million estimated unauthorized immigrants, and approximately 12 percent of the nearly 10.7 million Asian immigrants were unauthorized.
From 2001 to 2010, the Asian born accounted for 47.2 percent of refugee arrivals and 43.2 percent of persons granted asylum.
Between 2001 and 2010, there were 248,956 Asian refugee arrivals to the United States, accounting for nearly half (47.2 percent) of the roughly 528,000 refugee arrivals during that time.
Among the nearly 250,000 Asian refugees, the top five sending countries were Burma (71,919, or 28.9 percent), Iraq (55,987, or 22.5 percent), Iran (36,705, or 14.7 percent), Bhutan (31,138, or 12.5 percent), and Vietnam (18,070, or 7.3 percent).
From 2001 to 2010, 43.2 percent of the nearly 275,000 people granted asylum were from Asian countries. More than half (52.5 percent, or 62,350) of the 118,684 Asian nationals who were granted asylum during that period were Chinese nationals. With 6,830 approved asylum cases (or 5.7 percent of the total), India was the Asian country with the second-largest number of people with granted asylum.
Nearly 3.8 million Asian foreign born became lawful permanent residents of the United States between 2001 and 2010.
Thirty-six percent (or 3.8 million) of the 10.5 million immigrants granted lawful permanent residence (i.e., green cards) from 2001 to 2010 were born in Asia.
Just over 422,000 Asian born gained lawful permanent residence in 2010 alone, representing 40.5 percent of the 1 million immigrants granted green cards in that year. Of the Asian-born immigrants who received green cards in 2010, China (70,863), India (69,162), and the Philippines (58,173) were the top three countries of origin.
Nearly six of ten immigrants from Asia who were issued green cards in 2010 did so through family relationships, with 37.1 percent applying as immediate relatives of U.S. citizens and 21.9 percent as nonimmediate relatives of U.S. citizens or certain specified relatives of legal permanent residents. About one-fifth received their green cards through employment-based sponsorship.
In 2010, more than 250,000 immigrants from Asia became U.S. citizens through naturalization.
Among the Asian foreign born residing in the United States in 2009, 58.1 percent (or 6.2 million) were naturalized U.S. citizens, compared with 43.7 percent of the overall immigrant population of 38.5 million. In 2010, an additional 251,598 Asian born attained U.S. citizenship through naturalization.
Demographic and Socioeconomic Overview
Almost one-third of all Asian immigrants entered the United States between 2000 and 2009.
As of 2009, 32.7 percent of the more than 10.6 million Asian foreign born had entered the country between 2000 and 2009, 26.9 percent entered between 1990 and 1999, 22.6 percent between 1980 and 1989, and 17.8 percent before 1980.
In comparison, 31.6 percent of the 38.5 million foreign born resident in the United States entered the country in 2000 or later, with 27.9 percent entering between 1990 and 1999 and 19.6 percent entering between 1980 and 1989. About 21 percent of the total foreign-born population entered prior to 1980.
Among the Asian born, some groups have been in the United States longer than others. For example, about 30 percent of immigrants from Iran, Israel, Lebanon, and Japan arrived prior to 1980. In contrast, the foreign born from Nepal were among the most recently arrived Asian immigrants, with 80.1 percent having arrived in 2000 or later. Similarly, about 55 percent of immigrants from Burma, Kazakhstan, and Uzbekistan entered the United States between 2000 and 2009.
More than 80 percent of the foreign born from Asia were of working age.
Of all Asian immigrants residing in the United States in 2009, 81.7 percent were adults of working age (between 16 and 64-years-old), 12.7 percent were seniors (age 65 and older), and 5.6 percent were youth (under age 16). There are some notable differences, however, among certain countries of origin. For example, 20.3 percent of Japanese, 18.6 percent of Iranians, and 17.0 percent of Filipinos were 65 or older. Conversely, 26.4 percent of immigrants from Kazakhstan and 18.9 percent from Saudi Arabia were children under the age of 16.
Overall, 81.9 percent of the total foreign-born population was of working age, 12.4 percent was seniors, and 5.7 percent was youth. Among native-born US citizens, 63.3 percent were of working age, 12.9 percent were seniors, and 23.8 percent were youth.
Asian immigrant women outnumbered men in 2009.
Over half, or 52.9 percent, of Asian immigrants residing in the United States in 2009 were women, compared with 50.1 percent among the foreign born overall and 50.8 percent among the native born.
The gender imbalance was more pronounced among immigrants from certain Asian countries, for example: in Japan (64.7 percent women), Kazakhstan (62.1 percent women), the Philippines (59.3 percent women), Thailand (58.7 percent women), and Azerbaijan (58.4 percent women), women were the majority by relatively wide margins. The share of women was much lower among immigrants from the Gulf region: only 37.0 percent of immigrants from Yemen, 38.2 percent from Kuwait, and 38.7 percent from Saudi Arabia were women.
More than half of Asian immigrants either spoke only English or spoke English "very well."
In 2009, 10.8 percent of Asian immigrants reported speaking only English and 42.6 percent reported speaking English "very well." In contrast, 24.9 percent reported speaking English "well," 16.3 percent reported speaking English "but not well," and 5.4 percent reported that they did not speak English at all. These three groups amount to 46.6 percent of all Asian immigrants, and are classified as limited English proficient (LEP), meaning they reported speaking English less than "very well."
Asian immigrants were less likely to be LEP than the foreign-born population overall, of which 52.0 percent reported limited English proficiency in 2009.
Rates of limited English proficiency vary substantially by Asian country of origin. For example, the majority of immigrants from Singapore (88.4 percent), Kuwait (75.6 percent), Israel (74.3 percent), India (72.2 percent), Malaysia (70.3 percent), and Sri Lanka (70.1 percent) speak only English or speak English "very well." In contrast, 68.6 percent of immigrants from Burma, 67.4 percent of immigrants from Vietnam, and 67.3 percent from Uzbekistan were LEP.
Note: The term "limited English proficient" refers to any person age 5 and older who reported speaking English "not at all," "not well," or "well" on their survey questionnaire. Individuals who reported speaking only English or speaking English "very well" are considered proficient in English.
Nearly half of Asian immigrant adults age 25 and older had a Bachelor's degree or higher.
In terms of academic credentials, Asian immigrants age 25 and older are more likely than immigrants overall to have received a high school diploma or equivalent credential. In 2009, 16.0 percent of Asian immigrants had not received a high school diploma, compared with 32.3 percent of the foreign born overall and 11.4 percent of the native born.
About 16.7 percent of Asian immigrants reported a high school diploma or the equivalent general education diploma (GED) as their highest educational credential, compared with 22.2 percent of immigrants overall and 29.7 percent of the native born.
At the higher end of the education spectrum, Asian immigrants were much more likely to be highly educated than immigrant adults overall. In 2009, 48.2 percent of Asian immigrants had a Bachelor's degree or higher, compared with 26.8 percent of the overall foreign-born population and 28.1 percent of the native-born population. Additionally, 18.8 percent of all Asian born had received some college education or an Associate's degree, compared with 18.7 percent of all immigrants and 30.8 percent of the native born.
As with English skills, differences in educational attainment were evident among immigrants from various Asian countries. While three-quarters of Indian immigrant adults and more than two-thirds of those from Taiwan, Saudi Arabia, and Singapore were college graduates with a Bachelor's degree or higher, more than two-fifths of immigrants from Yemen, Laos, and Cambodia did not have a high school diploma.
Asian-born men were more likely to participate in the civilian labor force than were U.S.-born men.
In 2009, 76.3 percent of Asian-born men age 16 and older participated in the civilian labor force — i.e., were employed or seeking employment — compared with 69.4 percent of U.S.-born men and 80.0 percent of foreign-born men overall. The labor force participation rate of Asian-born women (58.4 percent), however, was slightly lower than that of U.S.-born women (60.3 percent) and almost identical to that of foreign-born women overall (57.5 percent).
Employed Asian immigrants were more concentrated in highly skilled occupations such as management, information technology, and science and engineering than were immigrants overall.
Among the 3.3 million Asian immigrant male workers age 16 and older in 2009, 16.9 percent were employed in management, business, and finance occupations, 11.4 percent in computer sciences and related information technology (IT) occupations, and another 8.8 percent in other sciences and engineering occupations. At the same time, 12.2 percent worked in service occupations and 11.9 percent in sales.
Among the 2.8 million Asian-born female workers age 16 and older, 18.0 percent reported working in service occupations, 14.7 percent in management, business, and finance positions, and 13.6 percent in office and administrative support roles.
|
Table 4: Occupations of Employed Workers in the Civilian Labor Force Age 16 and Older by Gender and Origin, 2009
|
|||||||||||||||||||||||||||||||||||||||||||||||||||||||||||||||||||||||||||||||||||||||||||||||||||||||||||
|
|||||||||||||||||||||||||||||||||||||||||||||||||||||||||||||||||||||||||||||||||||||||||||||||||||||||||||
Asian immigrants accounted for 58 percent of all immigrant physicians and surgeons and 52 percent of all immigrant registered nurses.
In 2009, 58.2 percent (or 129,000) of the 222,000 immigrant physicians and surgeons practicing in the United States were from Asia. Asian physicians and surgeons accounted for 15.5 percent of all 832,000 workers employed in these two professions in the country.
In that same year, Asian immigrant registered nurses (RNs) accounted for 51.9 percent (or 202,000) of the 390,000 immigrant RNs, and represented 7.3 percent of the 2.8 million RNs in the country.
Asian immigrants were less likely than the overall immigrant population to live in poverty.
In 2009, 12.5 percent of Asian immigrants lived in a household with an annual income below the federal poverty line. The share of Asian immigrants living in poverty was comparable to that among the U.S. born (13.5 percent), but was substantially lower than among all immigrants (17.3 percent).
The share of Asian born living in poverty varies significantly by country of origin. Less than 10 percent of immigrants from the Philippines (5.2 percent), India (6.6 percent), and Turkey (8.9 percent) lived in poverty. In contrast, 38.2 percent of Iraqi and 33.3 percent of Yemen immigrants were in poverty.
Note: Individuals residing in families with a total annual income of less than the federal poverty line are described as living in poverty. Whether an individual falls below the official poverty line depends not only on total family income, but also on the size of the family, the number of children, and the age of the head of household. The ACS reports total income over the 12 months preceding the interview date.
For more information about ACS data and methodology, click here.
Sources
Passel, Jeffrey S. and D'Vera Cohn. 2011. Unauthorized Immigrant Population: National and State Trends, 2010. Pew Hispanic Center. Available Online.
Ruggles, J., Steven, Trent Alexander, Katie Genadek, Ronald Goeken, Matthew B. Schroeder, and Matthew Sobek. 2010. Integrated Public Use Microdata Series: Version 5.0 [Machine-readable database]. Minneapolis: University of Minnesota. Available Online.
U.S. Department of Homeland Security, Office of Immigration Statistics. 2010 Yearbook of Immigration Statistics. Various tables. Available Online.