

Immigrants from Asia in the United States

On average, Asian immigrants are more educated and have higher household incomes than the overall immigrant and U.S.-born populations. (Photo: Tahiat Mahboob/Asia Society)
Migration from Asia to the United States rose dramatically with passage of the 1965 Immigration and Nationality Act, which removed national-origin quotas established in 1921 barring immigration from Asian and Arab countries and sharply limiting arrivals from Africa and eastern and southern Europe. The number of Asian immigrants grew from 491,000 in 1960 to about 12.8 million in 2014, representing a 2,597 percent increase. In 1960, Asians represented 5 percent of the U.S. foreign-born population; by 2014, their share grew to 30 percent of the nation’s 42.4 million immigrants.
As of 2014, the top five origin countries of Asian immigrants were India, China, the Philippines, Vietnam, and Korea. The migration motivations and demographic characteristics of Asian immigrants have varied greatly over time and by country of origin, ranging from employment and family reunification to educational or investment opportunities and humanitarian protection. While the size of the Asian immigrant population in the United States continues to increase, the population’s growth rate has slowed since 1980. Between 1970 and 1980, the number of Asian immigrants grew 308 percent from 825,000 to 2.5 million, then by 196 percent to 4.9 million in 1990. From 65 percent in the 1990s, the growth rate dropped to 37 percent in the 2000s and 12 percent from 2010 to 2014 (see Figure 1). Asia is the second-largest region of birth (after Latin America) of U.S. immigrants. As immigration from Latin America has declined in recent years—with China and India overtaking Mexico in flows of recent arrivals—Asian immigrants are projected to comprise a greater share of all immigrants, becoming the largest foreign-born group by 2055, according to Pew Research Center estimates.
Figure 1. Asian Immigrant Population in the United States, 1980-2014
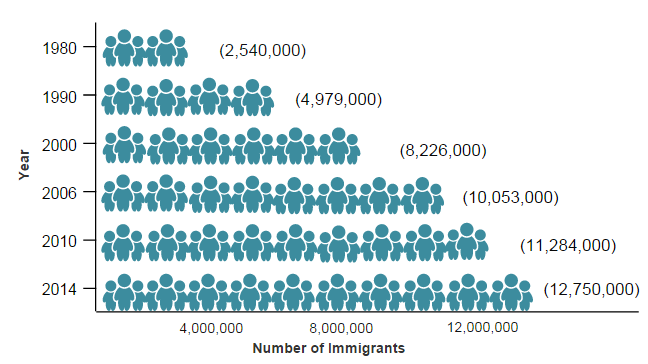
Sources: Data from U.S. Census Bureau 2006, 2010, and 2014 American Community Surveys (ACS), and Campbell J. Gibson and Kay Jung, "Historical Census Statistics on the Foreign-born Population of the United States: 1850-2000" (Working Paper no. 81, U.S. Census Bureau, Washington, DC, February 2006), available online.
Of the 92.2 million Asian immigrants worldwide, 58 percent reside in other Asian countries, with the rest scattered in North America and Europe. The United States is the primary destination for Asian immigrants, representing 14 percent of the global total, followed by Saudi Arabia (8 percent), and Russia and the United Arab Emirates (7 percent each), according to mid-2013 estimates from the United Nations Population Division. Click here to view an interactive map showing where migrants from Asian countries have settled worldwide.
On average, most Asian immigrants obtain lawful permanent residence in the United States (also known as receiving a green card) through family ties or employment. Compared to the overall foreign- and native-born populations, Asian immigrants generally are significantly more educated, more likely to be employed in management occupations, and have higher household incomes. Asian immigrants come from diverse religious, linguistic, and cultural backgrounds and have distinct immigration patterns and sociodemographic characteristics.
Using data from the U.S. Census Bureau (the most recent 2014 American Community Survey [ACS] and pooled 2009-13 ACS data), the Department of Homeland Security’s Yearbook of Immigration Statistics, and the World Bank's annual remittance data, this Spotlight provides information on the Asian immigrant population in the United States, focusing on its size, geographic distribution, and socioeconomic characteristics.
Note: Socioeconomic characteristics of Asian immigrants from Azerbaijan, Kazakhstan, Kuwait, Singapore, Sri Lanka, and Uzbekistan are based on pooled 2011-13 ACS data, due to the small sample sizes of these populations in the 2014 ACS one-year estimates.
Click on the bullet points below for more information:
- Distribution by Region and Country of Origin
- Distribution by State and Key Cities
- English Proficiency and Language Diversity
- Age, Education, and Employment
- Income and Poverty
- Immigration Pathways and Naturalization
- Health Coverage
- Diaspora
- Remittances
Distribution by Region and Country of Origin
Asian migration to the United States, especially from South Eastern and Eastern Asia, grew exponentially between 1970 and 2014 (see Figure 2). The number of immigrants from South Central Asia also increased dramatically, partly due to the inclusion of former Soviet Union countries previously classified as European. Meanwhile, the number of Western Asian immigrants in the United States grew steadily, but at a slower rate.
Figure 2. Asian Immigrants in the United States, by Region of Birth, 1960-2014
![]()
Notes: Individuals who reported an unclassified origin category were not included in the data, therefore the regional sum does not equal the total Asian-born population. Data may not be directly comparable between years due to changes in the Census Bureau’s classification system. Data for South Central and Western Asian immigrants in 2000, 2010, and 2014 include countries formed from areas that were part of the former Soviet Union, which were previously classified as Europe.
Source: Data from U.S. Census Bureau 2010 and 2014 American Community Surveys (ACS), and Gibson and Jung, "Historical Census Statistics.”
In 2014, South Eastern Asia accounted for the largest share of the total Asian immigrant population (4.2 million), followed by Eastern Asia (4 million), South Central Asia (3.5 million), and Western Asia (1.1 million, see Table 1).
The largest countries of origin were India (2.2 million, or 17 percent of Asian immigrants), China (2.1 million, 17 percent), the Philippines (1.9 million, 15 percent), Vietnam (1.3 million, 10 percent), and Korea (1.1 million, 9 percent). Together, they accounted for 68 percent of the total Asian immigrant population. These five countries were also among the top ten origin countries of all immigrants, representing one-fifth of the total foreign-born population. The Migration Information Source offers spotlights for a number of individual Asian countries, including for immigrants in the United States from China, India, Korea, the Philippines, and Vietnam.
Click here to see charts of the top ten countries of birth of immigrants residing in the United States from 1960 to the present.
Table 1. Distribution of Asian Immigrants by Region and Top Country of Origin, 2014
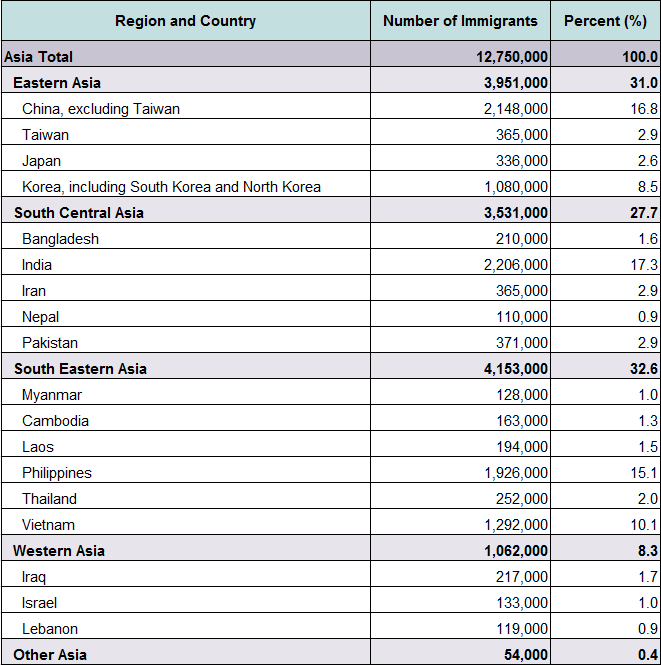
Source: Migration Policy Institute (MPI) tabulation of data from the U.S. Census Bureau, 2014 ACS.
Click here for an interactive chart showing changes in the number of immigrants from Asia in the United States over time. Select individual Asian countries from the dropdown menu.
Distribution by State and Key Cities
Close to half (49 percent) of Asian immigrants have settled in three states: California (32 percent), New York (10 percent), and Texas (7 percent). The top four counties with Asian immigrants as of 2009-13 were Los Angeles, Santa Clara, and Orange in California, and Queens in New York. Together, these four counties accounted for about 21 percent of the total Asian immigrant population in the United States.
Figure 3. Top Destination States for Asian Immigrants in the United States, 2009-13
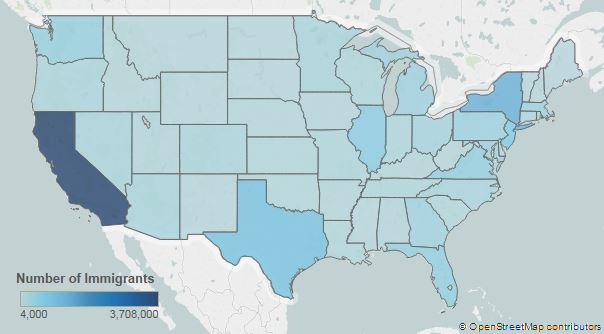
Note: Pooled 2009-13 ACS data were used to get statistically valid estimates at the state level for smaller-population geographies.
Source: MPI tabulation of data from U.S. Census Bureau pooled 2009-13 ACS.
Click here for an interactive map showing the geographic distribution of immigrants by state and county. Select individual Asian countries and regions from the dropdown menu to see which states and counties have the most Asian immigrants.
In the 2009-13 period, the U.S. cities with the largest number of Asian immigrants were the Los Angeles, greater New York, and San Francisco metropolitan areas. These three metro areas accounted for one-third of the Asian-born population.
Figure 4. Top Metropolitan Destinations for Asian Immigrants in the United States, 2009-13
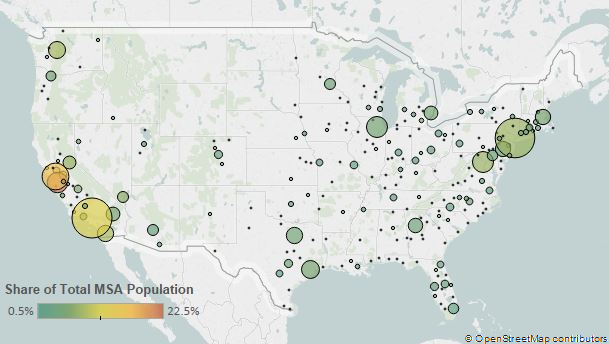
Note: Pooled 2009-13 ACS data were used to get statistically valid estimates at the metropolitan statistical-area level for smaller-population geographies.
Source: MPI tabulation of data from U.S. Census Bureau pooled 2009-13 ACS.
Click here for an interactive map highlighting the metropolitan areas with the highest concentrations of immigrants. Select individual Asian regions and countries from the dropdown menu to see which metropolitan areas have the most Asian immigrants.
Table 2. Top Concentrations by Metropolitan Area for the Foreign Born from Asia, 2009-13
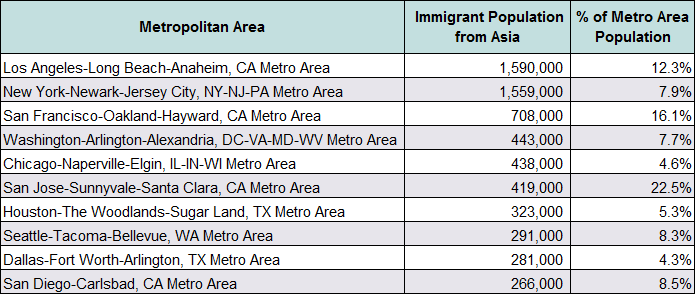
Source: MPI tabulation of data from the U.S. Census Bureau pooled 2009-13 ACS.
English Proficiency and Language Diversity
Asian immigrants are more likely to be proficient in English and less likely to speak English at home than the overall foreign-born population. In 2014, approximately 46 percent of Asian immigrants (ages 5 and over) reported limited English proficiency, compared to 50 percent of all immigrants. Those from Eastern Asia were the most likely to be Limited English Proficient (LEP), at 57 percent, followed by South Eastern Asia (47 percent), Western Asia (41 percent), and South Central Asia (34 percent). The Asian origin countries with the highest share of LEP individuals were Burma (74 percent), China (69 percent), Vietnam (67 percent), and Laos and Cambodia (64 percent each). Asian countries with the lowest share of LEP individuals were Singapore (14 percent), Kuwait (21 percent), Israel (22 percent), and India (27 percent).
Approximately 12 percent of Asian immigrants spoke only English at home in 2014, versus 16 percent of all immigrants. The top ten foreign languages spoken by Asian immigrants are Chinese, Tagalog, Vietnamese, Korean, Hindi, Arabic, Urdu, Persian, Telugu, and Gujarathi.
Note: Limited English proficiency refers to those who indicated on the ACS questionnaire that they spoke English less than “very well.” The U.S. Census Bureau includes Chinese, Mandarin, and Cantonese under the language classification “Chinese.”
Age, Education, and Employment
In general, Asian immigrants are older than the native-born population. The median age of both Asian and all immigrants in 2014 was 44, compared to 36 for the U.S. born. In 2014, Asian immigrants were more likely to be of working age (18 to 64,) and less likely to be under age 18 than the native born (see Table 3). Most immigrants from Kuwait (92 percent), Saudi Arabia (86 percent), and Laos, Cambodia, Pakistan, and Taiwan (85 percent each) were of working age, while one-quarter or fewer of those from Iran (25 percent), Japan (22 percent), and Azerbaijan, Lebanon, Korea, the Philippines, and Syria (20 percent each) were seniors (ages 65 and older).
Table 3. Age Distribution by Origin, 2014
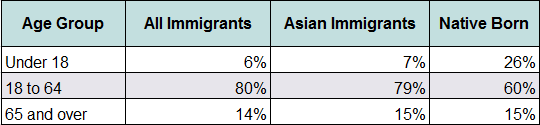
Source: MPI tabulation of data from the U.S. Census Bureau, 2014 ACS. Numbers may not add up to 100 as they are rounded to the nearest whole number.
Asian immigrants on average have much higher educational attainment than either all foreign- or U.S.-born adults. Half of Asian adults (ages 25 and over) had a bachelor’s degree or higher in 2014, compared to 29 percent of the total immigrant population and 30 percent of native-born adults. The majority of immigrants from India (76 percent), Taiwan (70 percent), and Saudi Arabia and Singapore (68 percent each) were college graduates, compared to less than one-quarter of those from Vietnam (25 percent), and Cambodia and Laos (15 percent each). In addition, more than half of college-educated immigrants from India and Taiwan (56 percent each), Sri Lanka (54 percent), and Israel (51 percent) had a graduate’s degree compared to 42 percent of their foreign-born peers.
In 2014, 15 percent of Asian-immigrant adults had not completed high school, compared to 30 percent of all immigrants and 10 percent of U.S.-born adults. Close to half (48 percent) of Burmese immigrants had no high school diploma.
Asia is the primary sending region of international students in the United States. In the 2014-15 school year, 736,000 Asian students accounted for 76 percent of the 975,000 international students enrolled in U.S. higher educational institutions. China (304,000), India (133,000), South Korea (64,000), and Saudi Arabia (60,000) were the top four origin countries of all international students, accounting for significant shares of the U.S. total (see Table 4). Over the past decade, the number of Asian students in the United States more than doubled, largely driven by the rising number of students from China (a 486 percent increase) and India (174 percent increase). Furthermore, in the past five years, the number of students from Saudi Arabia grew by 1,739 percent and from Kuwait by 530 percent, due to heavy government investment in international scholarships and overseas educational opportunities.
Table 4. Number and Share of International Students in the United States from the Top Ten Asian Origin Countries, 2014-15 School Year
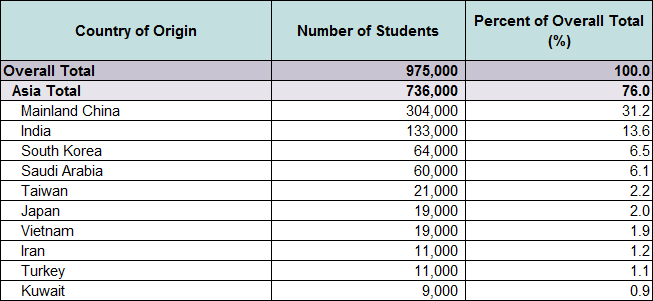
Source: MPI tabulation of data from the Institute of International Education (IIE), "International Student Totals by Place of Origin, 2013/14- 2014/15," Open Doors Report on International Educational Exchange (New York: IIE, 2015), available online.
Asian immigrants participate in the labor force at a slightly lower rate than the overall immigrant population. In 2014, about 64 percent of Asian immigrants ages 16 and over were in the civilian labor force, compared to 66 percent and 62 percent of foreign- and native-born individuals, respectively.
Close to half (49 percent) of Asian immigrants were employed in management, business, science, and arts occupations—a much higher share than the overall foreign- and native-born populations (see Figure 5). Immigrants from Asia were also much less likely to be employed in natural resources, construction, and maintenance occupations (3 percent)
Figure 5. Employed Workers in the Civilian Labor Force (ages 16 and older) by Occupation and Origin, 2014
![]()
Source: MPI tabulation of data from the U.S. Census Bureau 2014 ACS.
Immigrants from all but four Asian origin groups were primarily employed in management-related occupations. The largest shares of immigrant workers from Laos (38 percent), Burma (36 percent), and Cambodia (30 percent) were employed in production occupations, while Vietnamese workers (31 percent) were the most likely to be in service occupations.
Many Asian immigrants, especially those from India, are employed in high-skilled jobs and enter the United States on temporary H-1B visas for specialty occupation workers. Of the H-1B petitions approved in fiscal year (FY) 2014, 70 percent of the beneficiaries were born in India, followed by mainland China (8 percent), the Philippines (2 percent), and Korea (1 percent).
Asian immigrants have significantly higher incomes than the total foreign- and U.S.-born populations. In 2014, the median income of households headed by an Asian immigrant was $70,000, compared to $49,000 and $55,000 for overall immigrant and native-born households, respectively. Households headed by Indian ($105,000), Taiwanese ($91,000), Filipino ($82,000), and Malaysian ($80,000) immigrants had the highest median income among all Asian immigrant groups, while Saudi ($22,000), Iraqi ($27,000), and Burmese ($38,000) households had the lowest median incomes.
In 2014, Asian immigrants were as likely as the native born and less likely than the overall immigrant population to be in poverty, with 15 percent of Asian immigrant and native-born and 19 percent of all immigrant households below the federal poverty line. Immigrants from Saudi Arabia (47 percent), Iraq (41 percent), and Burma (29 percent) were the most likely to be in poverty.
Immigration Pathways and Naturalization
Asian immigrants are more likely than the overall foreign-born population to be naturalized citizens. As of 2014, 59 percent of the 12.8 million Asian immigrants in the United States had received U.S. citizenship, compared to 47 percent of all immigrants. Immigrants from Lebanon (77 percent), Vietnam and Cambodia (76 percent each), and Taiwan, Iran, and Laos (75 percent each) had the highest naturalization shares, while those from Saudi Arabia (16 percent), Nepal (23 percent), and Japan and Burma (35 percent each) were the least likely to be naturalized.
Asians on average are more likely than the total immigrant population to have entered the United States since 2010 (see Figure 6). Nearly three-quarters of immigrants from Saudi Arabia (73 percent) entered in 2010 or later, as did more than one-third of those from Nepal (42 percent), Iraq (37 percent), and Burma (34 percent), compared to less than 10 percent of immigrants from Azerbaijan and Lebanon (9 percent each), Cambodia (7 percent), and Laos (4 percent).
Figure 6. Immigrants from Asia and All Immigrants in the United States by Period of Arrival, 2014
![]()
Source: MPI tabulation of data from the U.S. Census Bureau, 2014 ACS. Numbers may not add up to 100 as they are rounded to the nearest whole number.
Of the 991,000 individuals who obtained legal permanent residency in FY 2013, 401,000 (40 percent) were from Asia. Mainland China (72,000), India (68,000), and the Philippines (54,000) were the top origin countries, accounting for 49 percent of Asian legal permanent residents (LPRs). New Asian LPRs were most likely to come in as immediate relatives of U.S. citizens (44 percent, see Figure 7). Compared to all new LPRs in 2013, however, Asians were more likely than immigrants overall to obtain a green card via employment-based preferences (25 percent versus 16 percent) or as refugees and asylees (15 percent versus 12 percent).
Figure 7. Immigration Pathways of Asian Immigrants and All Immigrants in the United States, 2013
![]()
Notes: Family-sponsored: Includes adult children and siblings of U.S. citizens as well as spouses and children of green-card holders. Immediate relatives of U.S. citizens: Includes spouses, minor children, and parents of U.S. citizens. Diversity Visa Lottery: The Immigration Act of 1990 established the Diversity Visa (DV) Lottery to allow entry to immigrants from countries with low rates of immigration to the United States. The law states that 55,000 diversity visas in total are made available each fiscal year. Nationals of the following Asian countries are ineligible for the DV-2017 lottery: Bangladesh, China (mainland born), India, Pakistan, South Korea, the Philippines, and Vietnam.
Source: MPI tabulation of data from Department of Homeland Security (DHS), 2013 Yearbook of Immigration Statistics (Washington, DC: DHS Office of Immigration Statistics, 2014), available online.
The channels through which Asian immigrants gain LPR status varies significantly by country of origin. For instance, more than half of immigrants from South Korea and Brunei (62 percent each), Singapore (60 percent), and India (52 percent) obtained green cards in FY 2013 via employment-based preferences. On the other hand, most immigrants from Vietnam (97 percent), Laos (93 percent), Yemen and Bangladesh (91 percent each), and Jordan (87 percent) became LPRs as immediate relatives of U.S. citizens, while two-thirds of new Uzbekistani LPRs came through the Diversity Visa program.
As violence and political unrest in South Asia and the Middle East continue to escalate, large numbers of Asian immigrants from countries or regions in conflict have entered the United States as refugees and asylees (or sought asylum once in country). As a result, a significant share of new LPRs from Bhutan (100 percent), Burma (88 percent), Iraq (71 percent), Nepal (47 percent), and Thailand (41 percent) attained permanent residency by adjusting from refugee or asylee status.
Click here to read the latest data spotlight article on refugees and asylees in the United States.
Although most arrive via legal channels, Asian immigrants represent a significant and growing portion of the unauthorized population. In the 2009-13 period, approximately 1.5 million unauthorized immigrants from Asia resided in the United States, according to Migration Policy Institute (MPI) estimates, representing 14 percent of the total 11 million unauthorized population. China is the fifth-largest origin country of unauthorized immigrants. Since 1990, the number of unauthorized Chinese, Korean, and Indian immigrants increased four-fold, eight-fold, and ten-fold, respectively. In August 2015, MPI estimated that approximately 151,000 Asian youth were immediately eligible for the Deferred Action for Childhood Arrivals (DACA) program, which provides temporary relief from deportation as well as work authorization. As of September 30, 2015 (the latest data available from the U.S. government), 19,158 unauthorized youth from India, Pakistan, the Philippines, and South Korea had applied for the DACA program, and 17,408 had received DACA status. Click here to read an article on DACA application and renewal rates among Asian and Latin American youth.
Asian immigrants were more likely to have private health insurance coverage (66 percent) and less likely to be uninsured (13 percent) than the overall foreign-born population in 2014 (see Figure 8). Most Japanese and Indian immigrants (82 percent each) were covered by private insurance. Significant shares of those from Iraq (55 percent), Afghanistan (46 percent), Bangladesh (42 percent), Burma (41 percent), and Syria (40 percent) had public coverage, while less than one-quarter of immigrants from Jordan (23 percent), and Burma, Nepal, and Saudi Arabia (22 percent each) were uninsured.
Figure 8. Health Coverage for Asian Immigrants, All Immigrants, and the Native Born, 2014
![]()
Note: The sum of shares by type of insurance is likely to be greater than 100 because people may have more than one type of insurance.
Source: MPI tabulation of data from the U.S. Census Bureau, 2014 ACS.
According to tabulations from the U.S. Census Bureau’s 2013 ACS, the Chinese diaspora was the largest among all Asian-origin countries, followed by the Filipino and Indian diasporas. Approximately 4.5 million individuals were either born in China or reported Chinese ancestry (see Table 5).
Table 5. Estimates of the Top Asian Diaspora Groups, 2013
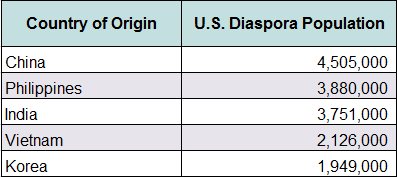
Note: The term "diaspora" most often includes individuals born in the country as well as those who cited that origin as their ancestry, race, and/or ethnicity regardless of where they were born.
Source: MPI tabulation of data from the U.S. Census Bureau, 2013 ACS.
Global remittances sent to Asian countries via formal channels equaled nearly US $266 billion in 2013, representing around 1.1 percent of the region’s gross domestic product (GDP). For most Asian countries, remittances accounted for a very small share of their GDP: less than 0.1 percent in Japan, Kazakhstan, Kuwait, Oman, Saudi Arabia, and Turkmenistan. In contrast, economies in Tajikistan (49 percent), Kyrgyzstan (31 percent), Nepal (29 percent), and Armenia (21 percent) were more dependent on remittances.
Figure 9. Annual Remittance Flows to Asia, 1974-2014
![]()
Source: MPI tabulations of data from the World Bank Prospects Group, “Annual Remittances Data,” April 2015 update.
Visit the Data Hub’s collection of interactive remittances tools, which track remittances by inflow and outflow, between countries, and over time.
Sources
Department of Homeland Security (DHS), Office of Immigration Statistics. 2014. 2013 Yearbook of Immigration Statistics. Washington, DC: DHS Office of Immigration Statistics. Available Online.
Gibson, Campbell J. and Kay Jung. 2006. Historical Census Statistics on the Foreign-born Population of the United States: 1850-2000. Working Paper No. 81, U.S. Census Bureau, Washington, DC, February 2006. Available Online.
Institute of International Education (IIE). 2015. Open Doors Report on International Educational Exchange. New York: IIE. Available Online.
Pew Research Center. 2015. Modern Immigration Wave Brings 59 Million to U.S., Driving Population Growth and Change Through 2065. Washington, DC: Pew Research Center. Available Online.
Rosenblum, Marc R. and Ariel G. Ruiz Soto. 2015. An Analysis of Unauthorized Immigrants in the United States by Country and Region of Birth. Washington, DC: Migration Policy Institute. Available Online.
U.S. Census Bureau. 2015. 2013 American Community Survey. Accessed from Steven Ruggles, Katie Genadek, Ronald Goeken, Josiah Grover, and Matthew Sobek. Integrated Public Use Microdata Series: Version 6.0 [Machine-readable database]. Minneapolis: University of Minnesota, 2015. Available Online.
---. 2015. 2014 American Community Survey. American FactFinder. Available Online.
U.S. Citizenship and Immigration Services (USCIS). 2015. Characteristics of H-1B Specialty Occupation Workers, Fiscal Year 2014 Annual Report to Congress. Washington, DC: USCIS. Available Online.
---. 2015. Number of I-821D, Consideration of Deferred Action for Childhood Arrivals by Fiscal Year, Quarter, Intake, Biometrics and Case Status: 2012-2015 (September 30). Available Online.
U.S. Department of State. N.d. Instructions for the 2017 Diversity Immigrant Visa Program (DV-2016). Available Online.
World Bank Prospects Group. 2015. Annual Remittances Data, April 2015 update. Available Online.