

Black Immigrants in the United States Face Hurdles, but Outcomes Vary by City

A man and child at a naturalization ceremony outside Washington, DC. (Photo: Jetta Disco/DHS)
One of the most consequential aspects of immigrants’ lives is where they establish themselves, even within their countries of destination. The United States is a vast country with a diversity of cities that have their own socioeconomic characteristics and policies that can affect immigrants’ ability to secure family-sustaining jobs, health care, and other benefits.
This is particularly the case for the country’s 4.3 million Black immigrants, 95 percent of whom live in a metropolitan area (compared to 93 percent of all immigrants, 83 percent of U.S.-born Black residents, and 79 percent of the overall U.S. population), and who contend with both their status as foreign born and with legacies of segregation and racism that have historically marginalized Black communities across the United States. Today, the connection between disadvantageous residential patterns and poverty persists in the Black community, and Black-White disparities are still apparent in several socioeconomic indicators.
Nationwide, 46 percent of all Black residents, native born and immigrant alike, earned less than double the federal poverty level (FPL) in 2019 (defined as $26,172 for a family of four), a much higher share than White residents (27 percent) and the overall population (31 percent). Although Black immigrants are generally less likely to live in poverty than U.S.-born Black residents, data vary by city. Black immigrants in New York City, which is by far the top metro destination for Black immigrants with nearly one-quarter of the overall population, tend to have better outcomes than their native-born Black neighbors, at least in terms of poverty. Black immigrants are also less likely to experience poverty than their U.S.-born counterparts in other top destination cities such as Miami, Boston, and Atlanta. In the Washington, DC area, Black immigrants have a slightly higher poverty rate than native-born Black residents. Among other things, these differing outcomes reflect local and state government policies that vary between cities.
Black immigrants in the United States are diverse, and hail from dozens of origin countries in sub-Saharan Africa and the Caribbean in particular. The top countries of origin are Jamaica (17 percent), Haiti (16 percent), Nigeria (8 percent), and Ethiopia (6 percent). Caribbean migration to the United States has a long history, and Caribbean immigrants tend to have larger and more established family and diaspora networks than those from other origins. They are also more likely to be naturalized citizens and proficient in English. Over the last decade, however, Africans have become one of the fastest growing groups of immigrants in the United States and are more likely than other immigrants to come as refugees or through the Diversity Visa lottery, which offers entry to people from countries with low rates of immigration. As many as 12 percent of all Black immigrants entered the country as refugees or sought immigration relief through other humanitarian pathways such as a grant of asylum, compared to 8 percent of the overall foreign-born population.
Importantly, Black immigrants in the United States are racially and ethnically diverse. As many as 419,000 immigrants who identified as Black on the U.S. census (10 percent of all Black immigrants) also self-identified as Latino. Foreign-born Afro-Latinos make up about one-fifth of all U.S. Afro-Latinos and immigrated primarily from the Dominican Republic (42 percent), with smaller numbers from Mexico (12 percent), Cuba (10 percent), Panama (7 percent), and Honduras (6 percent). Additionally, approximately 6 percent of Black immigrants identified as Black in combination with another race, primarily biracial Black and White (4 percent) and to a lesser extent biracial Black and Asian and Black and Native American.
Using poverty, work, and education-related indicators from the U.S. Census Bureau’s pooled American Community Surveys (ACS) from 2015 to 2019 as well as a unique methodology developed by the Migration Policy Institute (MPI) that uses information from the 2008 Survey of Income and Program Participation (SIPP) to assign immigration status, this article analyzes Black immigrants’ socioeconomic outcomes, with emphasis on low-income immigrants (defined as those in households earning less than 200 percent of FPL), in the five largest metro areas of residence—New York, Miami, Washington, DC, Atlanta, and Boston—and describes how their experiences compare to those of the native-born Black population. The analysis suggests that Black immigrants’ outcomes vary depending on the metro area where they reside, in a pattern somewhat similar to that of native-born Black individuals. Systemic barriers persist for Black communities regardless of their immigrant status, but the foreign born face both particular challenges and opportunities in different U.S. cities.
Black Immigrant Community Clusters
Upon arrival, most newcomers establish themselves where they have relatives, friends, or other connections. When immigrants of the same racial/ethnic groups come together, they can gain valuable information for finding jobs, starting a business, and learning norms and social customs. However, living in areas where immigrants from the same racial or ethnic group are concentrated can also have drawbacks due to limited information networks and other factors, which may manifest in lower-paid jobs, educational choices that lead to less rewarding careers, or exposure to racial discrimination due to negative perceptions of being associated with a particular racial or ethnic group.
Black immigrants are concentrated both in terms of location and region of origin. Twenty-four percent of Black immigrants live in the New York metro area and 11 percent in greater Miami, with smaller percentages in the metro areas of Washington, DC, Boston, and Atlanta (see Table 1). Other metro areas have Black immigrant populations of fewer than 175,000, but include rapidly growing cities of Houston, Dallas, and Orlando.
Table 1. Top U.S. Metro Areas for Black Immigrants, 2019
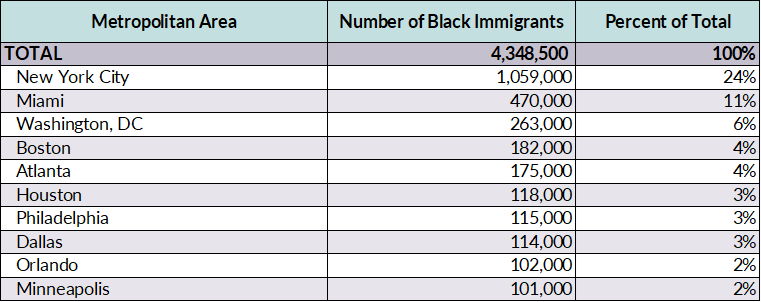
Note: Data are based on 2013 definitions for metropolitan statistical areas, which may include suburbs and cross into multiple states.
Source: Author’s analysis of data from the U.S. Census Bureau’s 2015-19 American Community Survey (ACS), pooled.
People from the Caribbean represent a sizeable group of Black immigrants, particularly in New York and Miami, where Jamaicans and Haitians make up the largest shares (see Table 2). Black immigrants from Africa are more represented in the metro areas of Washington, DC and Atlanta. Boston has a more diverse Black foreign-born population, representing communities with a rich mix of languages and cultures.
Table 2. Countries of Origin of Black Immigrants in Select U.S. Metropolitan Areas, 2019
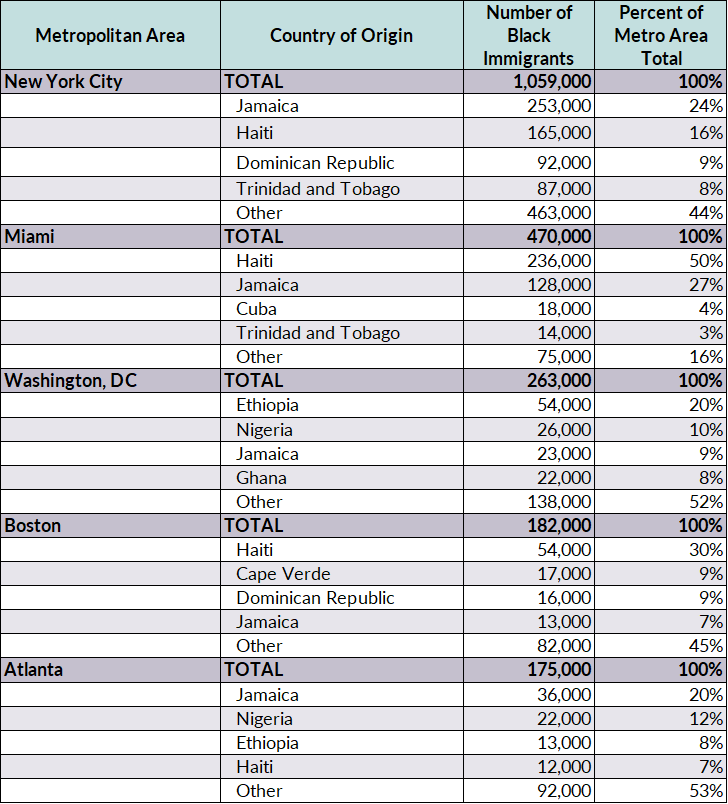
Note: Due to rounding, shares may not add up to 100 percent.
Source: Author’s analysis of data from the U.S. Census Bureau’s 2015-19 ACS, pooled.
Legacy of Residential Segregation and Poverty: Impact on Black Immigrants
The residence patterns of the native-born Black population are rooted in a history of anti-Black laws and policies commonly known as redlining and designed to keep Black people away from prosperous areas. For generations, these systems resulted in limited access to quality education, higher-paid and family-sustaining employment such as unionized jobs, decent housing, and healthy and safe neighborhoods. While the Fair Housing Act of 1968 made redlining illegal, racialized patterns of residential segregation persist to this day: in 2019, nearly 21 percent of Black residents lived in high-poverty neighborhoods (defined as those where at least 30 percent of residents live in poverty), compared to just 4 percent of White residents.
Due to factors including higher labor force participation and higher levels of education, particularly among those from sub-Saharan Africa, Black foreign-born residents have lower poverty rates than U.S.-born Blacks. Nationwide, 38 percent of Black immigrants had incomes under 200 percent of FPL in 2019, compared to 47 percent of U.S.-born Black residents. But numbers fluctuate by city, with higher levels in Miami and lower shares in Washington (see Figure 1). Of the top five cities, only in Washington, DC was the share of low-income Black immigrants higher than native-born Black residents, although this is partly a reflection of the metro area’s lower levels of poverty among the native born.
Figure 1. Share of Low-Income Residents in Select Metro Areas, by Nativity and Race, 2019
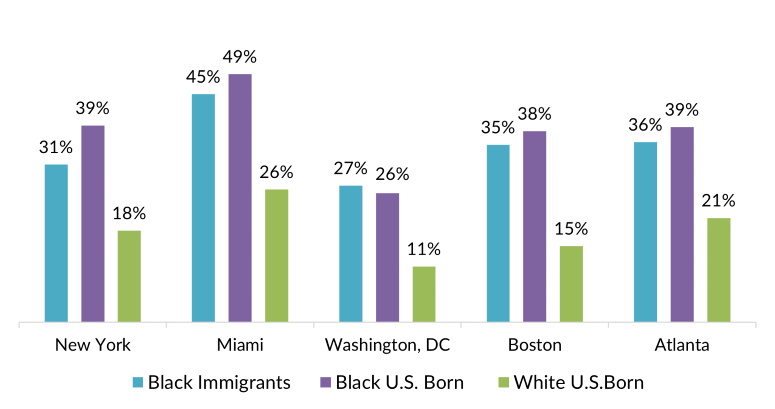
Note: Data are for share of residents earning incomes at or below 200 percent of the federal poverty line (FPL).
Source: Author’s analysis of data from the U.S. Census Bureau’s 2015-19 ACS, pooled.
Black children experience poverty at alarmingly high rates. Nationwide, 61 percent of Black immigrant children and 59 percent of Black native-born children live under 200 percent of FPL, which is much higher than U.S.-born White children (35 percent). At a city level, the shares of low-income Black immigrant children range from 41 percent in the Washington, DC area to 65 percent in Miami, and tend to be higher than those of U.S.-born Black children (see Figure 2). The United States has the highest child poverty rates of all high-income nations, but it is particularly acute for Black children, including immigrants.
Figure 2. Share of Low-Income Children in Select Metro Areas, by Nativity and Race, 2019
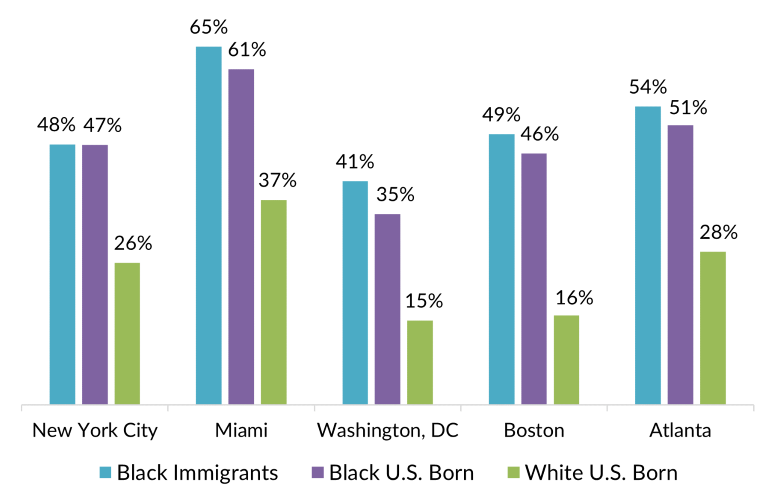
Note: Data are for share of residents earning incomes at or below 200 percent of FPL.
Source: Author’s analysis of data from the U.S. Census Bureau’s 2015-19 ACS, pooled.
Working Hard and Working Poor
Depending on their status, some immigrants may face legal limitations in the type of job they can hold, the industry, their employer, the number of hours they are able to work, or the duration of their work authorization, all of which can make it more difficult to find and keep high-quality and stable jobs. Even lawful permanent residents (LPRs, also known as green-card holders) can be limited when applying for positions with the federal government that require U.S. citizenship.
Still, the unemployment rate of Black immigrants is typically lower than that of U.S.-born Black residents. Nationwide, 6 percent of Black immigrants and 10 percent of U.S.-born Black residents ages 16 and older were unemployed in 2019. Most major destination cities had a narrower gap, except for New York City (see Figure 3).
Figure 3. Unemployment Rates of Black U.S. Adults (ages 16 and older) in Select Metro Areas, by Nativity, 2019
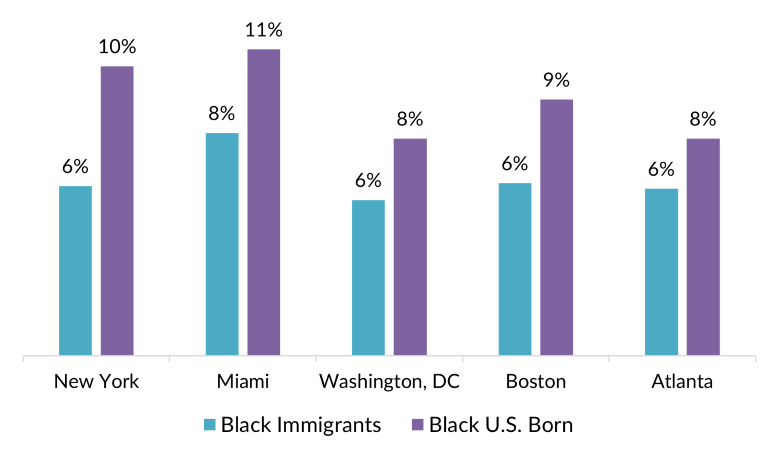
Note: Data are for adults who are unemployed but still active in the labor force.
Source: Author’s analysis of data from the U.S. Census Bureau’s 2015-19 ACS, pooled.
Black immigrants’ higher employment levels are also reflected in data about the working poor, defined as those who worked at least 27 weeks in a year and earned at or below 200 percent of FPL. Nationally, 46 percent of Black immigrants were working poor in 2019, compared to 35 percent of both U.S-born Black and White residents, suggesting they were more likely to be employed in low-income jobs. Depending on their status, immigrants may be unable to access public benefits such as Supplemental Security Income, which can offset poverty. In the Washington, DC area, more than half of Black immigrants were working poor (see Figure 4). The comparatively low share of working poor Black immigrants in New York City is a sign that getting out of poverty through work is more likely there than in other cities.
Figure 4. Share of Working Poor among U.S. Adults (ages 16 and older) in Select Metro Areas, by Nativity and Race, 2019
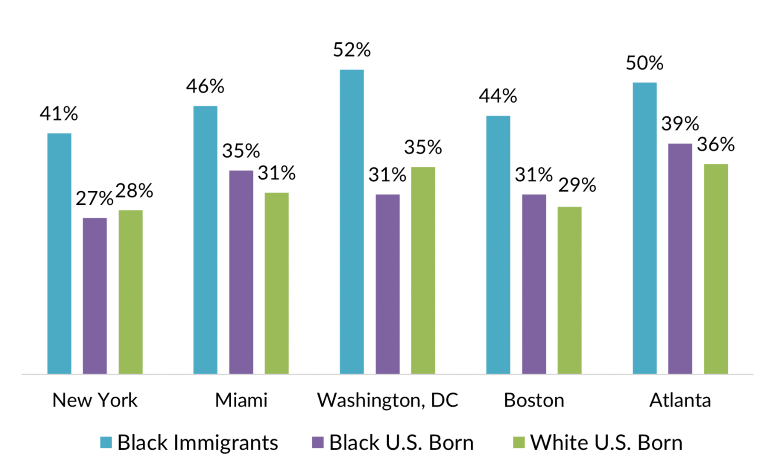
Note: Data are for adults who worked at least 27 weeks in a year and earned below 200 percent of FPL.
Source: Author analysis of data from the 2015-19 ACS.
Education
Higher educational achievement is a well-known path towards better work opportunities and greater income. Nationwide, 30 percent of Black immigrants ages 25 and older were college graduates in 2019, compared to 21 percent of U.S.- born Black residents. In New York and Miami, the top destinations for Black immigrants, the shares of graduates among Black residents tend to be lower than elsewhere, and are about the same regardless of nativity (see Figure 5). However, rates are much higher in the Washington and Atlanta areas, where more Black immigrants are African, and exceed those of U.S.-born Black residents. The reverse is true in Boston, where just 23 percent of Black immigrants in 2019 had a university degree compared to 32 percent of U.S.-born Black residents.
Figure 5. Black U.S. Adults (ages 25 and older) with a College Degree in Select Metro Areas, by Nativity, 2019
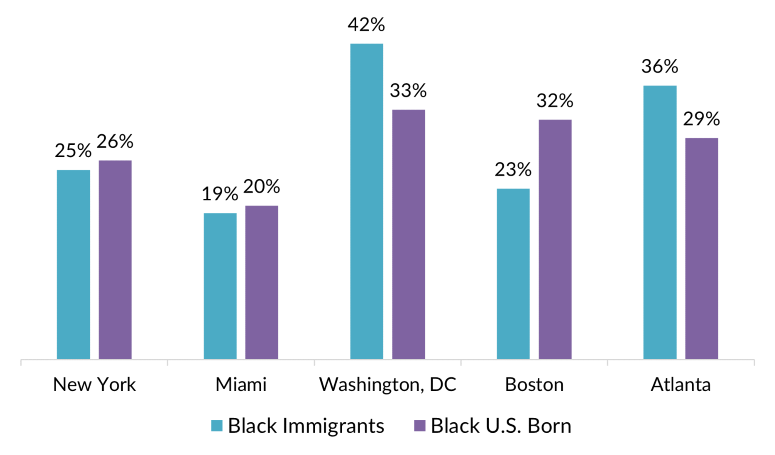
Source: Author’s analysis of data from the U.S. Census Bureau’s 2015-19 ACS, pooled.
Outcomes differ along gender lines. Among Black immigrants, men are slightly more educated than women, while U.S.-born Black women are significantly more educated than their male counterparts. Nationwide, 31 percent of Black immigrant men and 28 percent of Black immigrant women are college graduates, respectively. This compares to 17 percent of U.S.-born Black men and 24 percent of native-born Black women.
These data underscore the gap in higher education between foreign-born and native Black men. Outcomes are also mirrored in the labor market: in 2019, Black immigrant men had a much lower unemployment rate (6 percent) than Black U.S.-born men (11 percent). Similarly for Black women, though the gap was smaller, the unemployment rate was lower among immigrants (7 percent) than the U.S. born (9 percent).
A Weaker Safety Net for Low-Income Black Immigrant Families
Federal laws restricting access to public benefits pose barriers to the economic stability of low-income immigrant families. For instance, 1996 federal welfare changes created a complex set of rules forbidding or discouraging noncitizens’ participation in programs such as Medicaid and the Supplemental Nutrition Assistance Program (SNAP). While some refugees and asylees can access benefits on par with citizens, green-card holders are eligible only after five years with that status, while holders of nonimmigrant visas including international students and temporary workers on H-1B visas are generally not eligible. Unauthorized immigrants are generally barred from federally funded public benefits.
MPI estimates that 56 percent of Black immigrants were naturalized citizens in 2019 and another 19 percent had been green-card holders for more than five years, meaning most were eligible for federal benefits, if needed (see Figure 6). Still, access was far from guaranteed for the other 24 percent with other immigration statuses.
Figure 6. Immigration Status of Black Immigrants in the United States, 2019
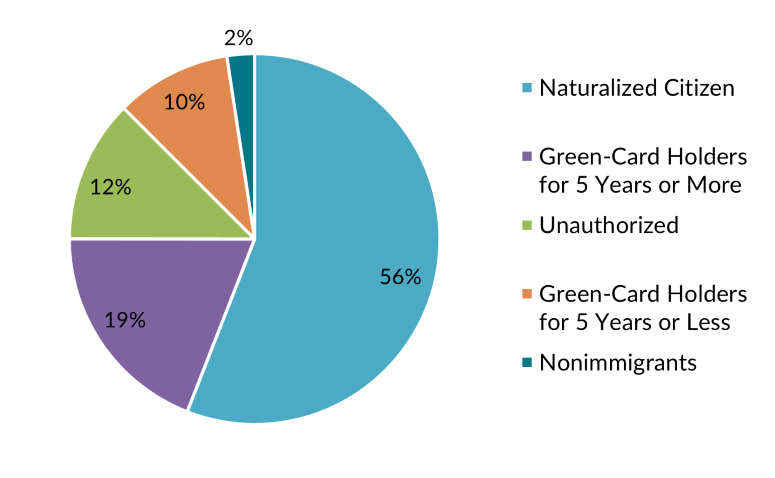
Note: Green-card holders (also known as lawful permanent residents, or LPRs) who had held that status for at least five years could not be modeled, so those with at least five years of total U.S. residence were used as a proxy.
Source: Author analysis of data from the U.S. Census Bureau’s 2015-19 ACS, pooled, and the 2008 Survey of Income and Program Participation (SIPP), weighted to 2019 unauthorized immigrant population estimates provided by Jennifer Van Hook at the Pennsylvania State University.
Eligibility for SNAP, which was formerly known as the food stamp program, includes families with incomes below 130 percent of FPL, but federal restrictions limit many immigrants’ access. Partly as a result, Black immigrants’ participation in SNAP is significantly lower than that of native-born Black residents, particularly in the Washington, DC and Atlanta areas, even though Black immigrant children are more likely to live in poverty (see Figure 7). This exclusion potentially puts thousands at higher risk of going hungry.
Figure 7. Income-Eligible Black Residents’ Enrollment in SNAP in Select Metro Areas, by Nativity, 2019

Note: SNAP is the Supplemental Nutrition Assistance Program. Data are for residents of all ages at or below 130 percent of FPL. Income level does not necessarily guarantee eligibility in SNAP, due to program and state-specific requirements.
Source: Author’s analysis of data from the U.S. Census Bureau’s 2015-19 ACS, pooled.
State and local policies vary more widely, creating differing impacts in areas such as rates of health insurance coverage. At a national level, 77 percent of Black immigrants with incomes below 200 percent of FPL had some type of health coverage in 2019, compared to 88 percent of U.S.-born Black residents in the same income range. This dynamic held true in all five major metro areas; Black immigrants living in poverty were less likely to have health insurance (see Figure 8). The largest gaps in coverage were in Atlanta and Miami, both of which are in states that have not expanded Medicaid eligibility under the terms of the federal Affordable Care Act. This holds with a larger pattern: immigrants tend to have lower rates of health-care coverage in states that have not expanded Medicaid, even among those federally eligible. The highest shares of Black immigrants with health insurance are in New York and Boston, where state governments fund their own Medicaid-equivalent programs that extend eligibility to some lawfully present immigrants who would be ineligible under federal law, including new LPRs with fewer than five years in that status and holders of nonimmigrant visas.
Figure 8. Health Coverage for Low-Income Black Residents in Select Metro Areas, by Nativity, 2019

Note: Data are for residents of all ages at or below 200 percent of FPL. Health insurance coverage includes Medicaid and other public or private options.
Source: Author’s analysis of data from the U.S. Census Bureau’s 2015-19 ACS, pooled.
In the Washington, DC area, health insurance rates for Black immigrants are significantly lower than those of native-born Black residents. The nation’s capital offers one of the most inclusive Medicaid programs in the country, providing coverage to all income-eligible immigrants including the unauthorized through local funding. However, the metro area analyzed in this article includes densely populated suburbs in Maryland and Virginia with less expansive policies that exclude certain categories of immigrants.
The Black Immigrant Experience Looks Different Across the Country
Despite having a diverse set of skills and immigrating through various pathways, Black immigrants have socioeconomic outcomes that generally follow a pattern similar to their U.S.-born counterparts, characterized by important gaps compared to U.S.-born White residents as a result of historical disenfranchisement. The shares of low-income Black immigrants are only slightly lower than those for U.S.-born Black residents. Black immigrants are also more likely to be working poor, are less likely to have health insurance, and Black immigrant children are more likely to be low income than their U.S.-born counterparts. Federal restrictions on public benefits related to health and nutrition, and limitations on work authorization mean that low-income Black noncitizens face unique challenges despite their higher labor force participation rates.
Cities could alter these outcomes with immigrant-inclusive policies, and in some cases have. They can provide newcomers with opportunities to earn a living and sustain their families while narrowing the gaps in outcomes with native residents, especially among low-income communities. States with more immigrant-inclusive benefits programs such as those in New York and Massachusetts tend to have lower gaps between U.S.-born and immigrant Black residents. New York City is often cited as an immigrant-friendly city due in part to the Mayor’s Office of Immigrant Affairs, which focuses on engaging the city’s immigrant communities by improving language access and ensuring immigrants can obtain a variety of legal and health services. In fact, Black immigrants fare better in New York than in the other major cities of arrival in terms of poverty rates and shares of working poor. The Boston area presents a mix of outcomes for a smaller but highly diversified Black immigrant community. Though Black immigrants in Boston have significantly lower educational outcomes than their U.S.-born counterparts, their poverty rates are relatively lower and low-income families have better access to a safety net.
Black immigrants in the Washington, DC area are relatively more educated and have the lowest shares in low-income status, but also the highest share of Black immigrant working poor and the widest gaps between outcomes for immigrant and U.S.-born Black residents. This may be partly explained by differences in policy between those of the District of Columbia, which are very immigrant-friendly and inclusive, and suburban Maryland and Virginia.
Meanwhile, cities in states with less inclusive programs tend to have worse outcomes for both foreign- and native-born Black populations. The shares of low-income children are higher in Miami and Atlanta than the other major cities Black immigrants call home. So are the shares of Black immigrants without health insurance, likely at least partly due to state decisions not to expand Medicaid or provide a state-funded alternative.
Where Black immigrants live is driven by a range of factors. But in some regards, existing racial disparities and local policies can be crucial to their socioeconomic integration.
Sources
Kearney, Melissa. 2021. Child Poverty in the U.S. EconoFact, February 5, 2021. Available online.
Gambetta, Ricardo and Zivile Gedrimaite. 2010. Municipal Innovations in Immigrant Integration: 20 Cities, 20 Good Practices. Washington, DC: National League of Cities. Available online.
Lacarte, Valerie. 2020. Afro-Latinos and Black Latin American Immigrants in the US. Sustainable Development and Climate Change blog post, October 10, 2020. Available online.
Lacarte, Valerie, Mark Greenberg, and Randy Capps. 2021. Medicaid Access and Participation: A Data Profile of Eligible and Ineligible Immigrant Adults. Washington, DC: Migration Policy Institute. Available online.
National Equity Atlas. N.d. Neighborhood Poverty. Accessed January 5, 2022. Available online.
Sentencing Project. N.d. State-by-State Data: State Rankings. Accessed January 5, 2022. Available online.
Tamir, Christine and Monica Anderson. 2022. One-in-Ten Black People Living in the U.S. Are Immigrants. Washington, DC: Pew Research Center. Available online.
U.S. Census Bureau. 2020. 2019 American Community Survey. Accessed from Steven Ruggles, Katie Genadek, Ronald Goeken, Josiah Grover, and Matthew Sobek. Integrated Public Use Microdata Series: Version 11.0 [dataset]. Minneapolis: University of Minnesota. Available online.