

Canadian Immigrants in the United States

Connect2Canada
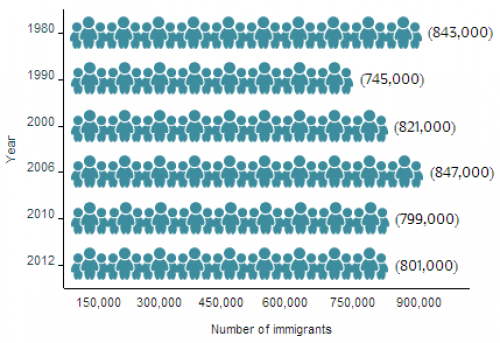
Canadian migration to the United States has historically ebbed and flowed with changes in the economic opportunities available in Canada and the United States. In 1960, Canadian immigrants comprised about 10 percent of the total U.S. foreign-born population. Since then, immigration inflow patterns in the United States have changed even as the foreign-born population from Canada has remained remarkably steady, and as of 2012, about 800,000 Canadians accounted for 2 percent of the nation’s 40.8 million immigrants.
The motivations and composition of Canadian migrants have transformed over several periods of migration to the United States. The first wave, beginning in 1867, consisted of unskilled English- and French-speaking Canadians drawn by the high volume of manufacturing jobs in the United States. In 1900, the U.S. Census recorded 747,000 English-speaking Canadian immigrants and 440,000 French-speaking immigrants. The majority of Anglophone Canadians settled along the border, in states including Michigan, New York, Massachusetts, Illinois, and Rhode Island, allowing them to easily move between the two countries. The Francophone Canadian population largely settled in New England and California. Between 1900 and 1930, the second wave witnessed a substantial influx of French-speaking Canadians motivated by discrimination in employment, education, and religion in Canada. Unlike the previous wave, Canadian immigrants arriving in the first three decades of the 20th century were more likely to stay in the United States permanently. After 1930, Canadian immigration steadily declined as the Canadian economy grew following World War II, and the political autonomy of the Francophone province of Quebec improved.
|
Figure 1. Canadian Immigrant Population in the United States, 1980-2012
|
|
Source: Data from U.S. Census Bureau 2006, 2010, and 2012 American Community Surveys (ACS), and 1980, 1990, and 2000 Decennial Census. |
The nature of migration exchange between the United States and Canada has changed greatly in the second half of the 20th century, especially following the enactment of the North American Free Trade Agreement (NAFTA) in 1994. The Canadian immigrant population has diversified to include highly educated professionals, students, those seeking family reunification, and those known as “snowbirds,” people in or near retirement attracted by warmer southern climates.
The vast majority of Canadian migrants settle in the United States, with others settling primarily in the United Kingdom (94,000), Australia (47,000), and Italy (27,000), according to mid-2013 estimates by the United Nations Population Division. Click here to view an interactive map showing where migrants from Canada and other countries have settled worldwide.
|
Definitions
|
|
|
Most Canadian immigrants in the United States obtain lawful permanent residence—also known as receiving a green card—either as immediate relatives of U.S. citizens or as employment-sponsored immigrants. Compared to the total foreign-born U.S. population, Canadian immigrants were more likely to have a higher income, experience a lower poverty rate, have health insurance, and be college educated; they were also less likely to be Limited English Proficient (LEP).
Using the most recent data from the U.S. Census Bureau’s American Community Survey (ACS), the Department of Homeland Security’s Yearbook of Immigration Statistics, and the World Bank's Annual Remittance Data, this Spotlight provides information on the Canadian immigrant population in the United States, focusing on the size, geographic distribution, and socioeconomic characteristics of the population.
Click on the bullet points below for more information:
- Distribution by State and Key Cities
- Distribution by State and Age
- English Proficiency
- Educational and Professional Attainment
- Income and Poverty
- Immigration Pathways and Naturalization
- Health Coverage
- Diaspora
- Remittances
Distribution by State and Key Cities
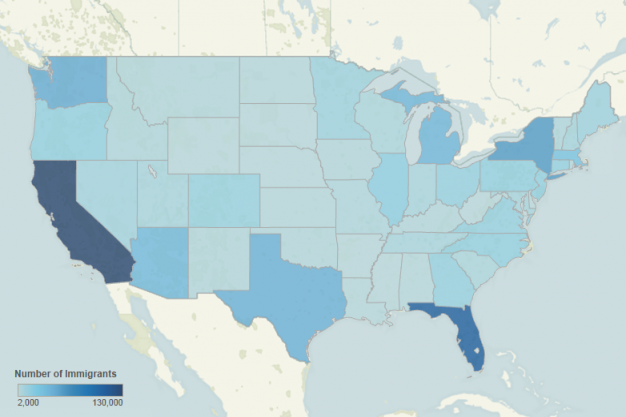
Most immigrants born in Canada settled in California (16 percent), Florida (13 percent), and New York (7 percent). The top four counties with Canadian immigrants were Los Angeles County in California, Maricopa County in Arizona, Broward County in Florida, and King County in Washington. Together, the four counties accounted for about 11 percent of the Canadian immigrant population in the United States.
|
Figure 2. Top Destination States for Canadian Immigrants in the United States, 2008-12
|
|
Note: Pooled 2008-12 ACS data were used to get statistically valid estimates at the state and metropolitan statistical area levels, for smaller-population geographies. Source: Migration Policy Institute (MPI) tabulation of data from U.S. Census Bureau pooled 2008-12 ACS. |
Click here for an interactive map that shows the geographic distribution of immigrants by state and county. Select Canada from the dropdown menu to see which states and counties have the highest distributions of Canadian immigrants.
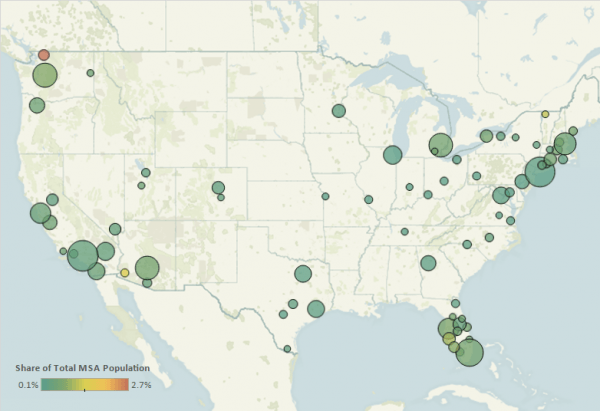
In the 2008-12 period, the U.S. cities with the highest distributions of Canadian immigrants were the greater Los Angeles, New York, and Miami metropolitan areas. These three metropolitan areas accounted for about 15 percent of the Canadian immigrant population in the United States.
|
Figure 3. Top Destination Metropolitan Areas for Canadian Immigrants in the United States, 2008-12
|
|
Source: MPI tabulation of data from the U.S. Census Bureau pooled 2008-12 ACS.
|
|
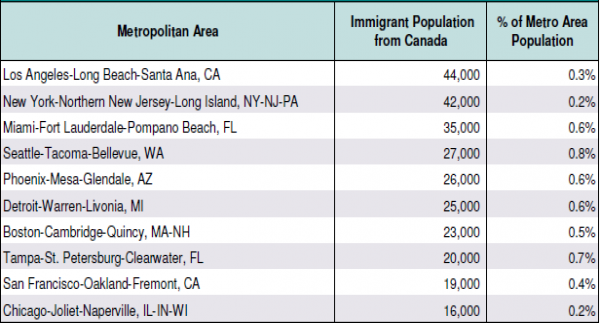
Table 1. Top Concentrations by Metropolitan Area for the Foreign Born from Canada, 2008-12
|
|
Source: MPI tabulation of data from the U.S. Census Bureau pooled 2008-12 ACS. |
Click here for an interactive map that highlights the metropolitan areas with the highest concentrations of immigrants. Select Canada from the dropdown menu to see which metropolitan areas have the highest concentrations of Canadian immigrants.
The age distribution of recent Canadian immigrants by state shows a clear migration pattern. In 2012, for all the Canadian-born immigrants whose place of residence was Canada one year ago (defined here as “recent immigrants from Canada”), the average age ranged from 26 years old in New York and Massachusetts to 63 years old in Florida and Arizona. Recent Canadian immigrants generally were younger than earlier arrivals, except in warm climate states such as Florida and Arizona. Canadian migration to Florida, Arizona, and other neighboring warm-climate states is likely driven by opportunities for recreational activity for those in or nearing retirement. States that have technology and mining industries are more likely to attract skilled workers during their prime working age. This appears to be the case in California, Texas, and Washington. New York and Massachusetts were the top destinations for younger Canadians attracted by the high-quality education options.
Canadian immigrants in the United States are more likely to be proficient in English and speak English at home than the total U.S. foreign-born population. In 2012, about only 5 percent of Canadian immigrants (ages 5 and over) reported limited English proficiency, compared to 50 percent of the total U.S. foreign-born population. Compared to 15 percent of the total U.S. foreign-born population that spoke only English at home, about 79 percent of Canadian immigrants spoke only English at home and 11 percent of Canadian immigrants spoke only French at home. German, Spanish, Hindi, and Chinese are also spoken at home by Canadian immigrants.
(Note: Limited English proficiency refers to those who indicated on the ACS questionnaire that they spoke English less than “very well.”)
Educational and Professional Attainment
Canadian immigrants tend to have much higher educational attainment compared to the total U.S. foreign-born and native-born populations. In 2012, 43 percent of Canadian immigrants (ages 25 and over) in the United States had a bachelor’s degree or higher, compared to 28 percent of the total U.S. foreign-born population and 29 percent of the native-born population.
The Canadian immigrant population in the United States was older than both the total U.S. foreign-born and native-born populations. The median age of Canadian immigrants was 53 years, compared to 43 for the total U.S. foreign-born population and 36 for the native-born population. In 2012, 66 percent of Canadian immigrants were of working age (18 to 64), 28 percent were ages 65 and over, and 6 percent were under 18. In comparison, 80 percent of the total U.S. foreign-born population was of working age, 13 percent was 65 and over, and 6 percent was under 18. Meanwhile, 60 percent of the native-born population was of working age, 14 percent was 65 and over, and 26 percent was under 18.
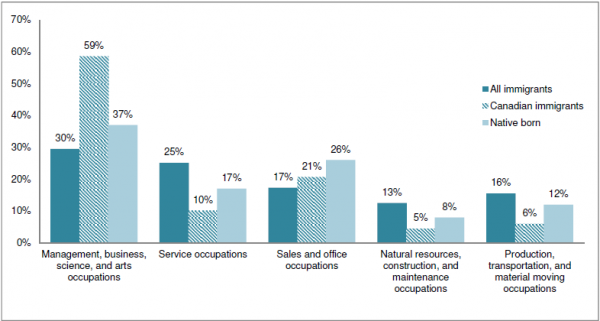
Canadian immigrants participate in the labor force at a lower rate than the total U.S. foreign-born population and the native-born population. In 2012, about 55 percent of Canadian immigrants (ages 16 and over) were in the labor force, compared to 67 percent of the total U.S. immigrant population and 63 percent of the native-born population. Canadian immigrants were more likely to be employed in management, business, science, and arts occupations (59 percent) compared to the total U.S. foreign-born population (30 percent) and the native-born population (37 percent).
|
Figure 4. Employed Immigrant Workers in the Civilian Labor Force (Ages 16 and Older) by Occupation and Origin, 2012
|
|
Source: MPI tabulation of data from the U.S. Census Bureau 2012 ACS. |
Canadian immigrants tend to have higher incomes compared to the total U.S. foreign-born and native-born populations. In 2012, the median household income among Canadian immigrants was $67,651, compared to $46,983 for the overall immigrant population and $51,975 for the native-born population.
The poverty rate among Canadian immigrants is lower than the poverty rate for the total U.S. foreign-born and native-born populations. In 2012, only 9 percent of Canadian immigrants were in poverty, compared to 19 percent for the total U.S. immigrant population and 15 percent for the native-born population.
Immigration Pathways and Naturalization
In 2012, approximately 801,000 Canadian immigrants resided in the United States, comprising about 2 percent of the total U.S. foreign-born population. About 44 percent of Canadian immigrants were naturalized U.S. citizens, slightly lower than the percentage of naturalized citizens among the total U.S. foreign-born population (46 percent).
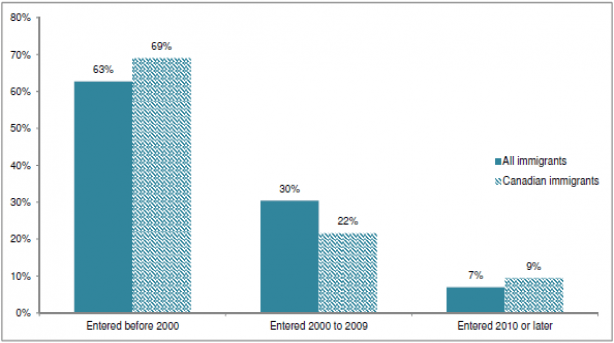
Most Canadian immigrants arrived prior to 2000 (69 percent), 22 percent between 2000 and 2009, and 9 percent in 2010 and after. Meanwhile, 63 percent of the total immigrant population arrived prior to 2000, 30 percent between 2000 and 2009, and 7 percent in 2010 and after.
|
Figure 5. Canadian Immigrants and All Immigrants in the United States by Period of Arrival, 2012
|
|
Source: MPI tabulation of data from the U.S. Census Bureau 2012 ACS. |
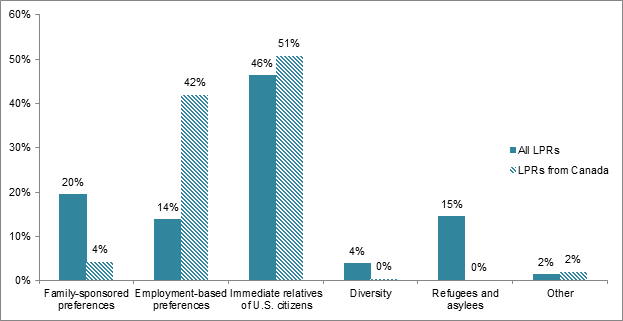
In 2012, most Canadian immigrants who became lawful permanent residents (LPRs) in the United States were immediate relatives of U.S. citizens (51 percent) or employment-based immigrants (42 percent). Canadian immigrants were much more likely to become LPRs via employment pathways, compared to the total U.S. foreign-born population (14 percent).
|
Figure 6. Immigration Pathways of Canadian Immigrants in the United States, 2012
|
|
Notes: Family-sponsored: Includes adult children and siblings of U.S. citizens as well as spouses and children of green-card holders. Immediate relatives of U.S. citizens: Includes spouses, minor children, and parents of U.S. citizens. The Diversity Visa Lottery: The Immigration Act of 1990 established the Diversity Visa Lottery to allow entry to immigrants from countries with low rates of immigration to the United States. The law states that 55,000 diversity visas are made available each fiscal year.
Source: MPI tabulation of data from Department of Homeland Security (DHS), 2012 Yearbook of Immigration Statistics (Washington, DC: DHS Office of Immigration Statistics, 2013), www.dhs.gov/publication/yearbook-2012. |
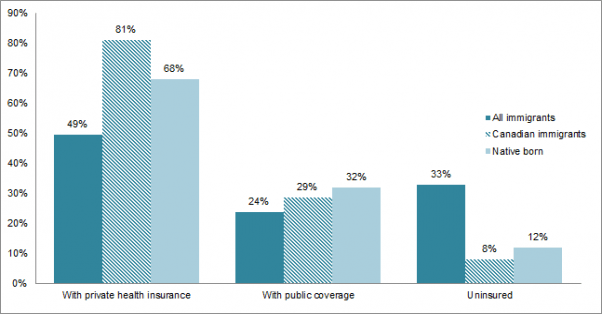
Canadian immigrants are more likely to have private health insurance compared to the overall immigrant and native-born populations. Canadian immigrants are slightly less likely to have public health insurance compared to the native-born population, but more likely to do so than the total U.S. foreign-born population. In 2012, 8 percent of Canadian immigrants were uninsured, compared to 33 percent of the total U.S. foreign-born population and 12 percent of the native-born population.
|
Figure 7. Canadian Immigrants in the United States by Type of Health Coverage, 2012
|
|
Note: The sum of shares by type of insurance is likely to be greater than 100 because people may have more than one type of insurance.
Source: MPI tabulation of data from the U.S. Census Bureau 2012 ACS. |
The Canadian diaspora population in the United States is comprised of approximately 3.3 million individuals who were either born in Canada or report Canadian ancestry.
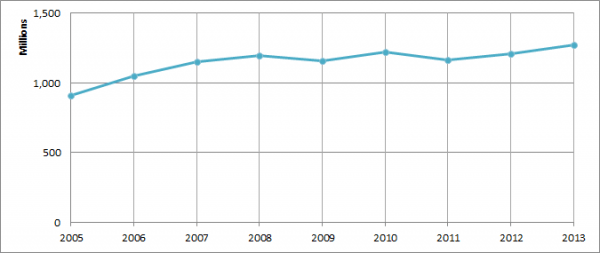
Total remittances sent to Canada via formal channels equaled US$1.3 billion in 2013, representing about 0.1 percent of the country’s gross domestic product (GDP), according to data from the World Bank. Remittances received by Canadians have increased approximately 40 percent since 2005.
|
Figure 8. Annual Remittance Flows to Canada, 2005-13
|
|
Source: MPI tabulations of data from the World Bank Prospects Group, “Annual Remittances Data,” April 2014 update. |
Visit the Data Hub’s collection of interactive remittances tools, which track remittances by inflow and outflow, between countries, and over time.
Sources
Department of Homeland Security, Office of Immigration Statistics. 2012. Yearbook of Immigration Statistics. Available Online.
Dion, Patrick and Mireille Vezina. 2010. Emigration from Canada to the United States from 2000 to 2006. Statistics Canada, Canadian Social Trends 90. Available Online.
Finnie, Ross. 2004. Who Moves? – A logit Model Analysis of Inter-Provincial Migration in Canada. Applied Economics 36 (16): 1759-79.
Gibson, Campbell J. and Emily Lennon. 1999. Working Paper No. 29, Historical Census Statistics on the Foreign-Born Population of the United States: 1850 to 1990. Washington, DC: U.S. Census Bureau.
Green, Alan, Mary MacKinnon, and Chris Minns. 2005. Conspicuous by their Absence: French Canadians and the Settlement of the Canadian West. The Journal of Economic History 65 (3): 822-49.
Lew, Byron and Bruce Cater. 2012. Canadian Emigration to the U.S., 1900-1930. Characterizing Movers and Stayers, and the Differential Impact of Immigration Policy on the Mobility of French and English Canadians. Paper prepared for the meeting of the Canadian Network for Economic History, Banff, Alberta, October 26-28, 2012.
Paquette, William A. 2013. Canadian Immigrants. Salem Press Encyclopedia. Ipswich, MA: Salem Press.
U.S. Census Bureau. 2012. 2012 American Community Survey. American FactFinder. Available Online.
---. 1850-2000 Decennial Census and 2000-2012 ACS. Accessed from Steven Ruggles, J. Trent Alexander, Katie Genadek, Ronald Goeken, Matthew B. Schroeder, and Matthew Sobek. Integrated Public Use Microdata Series: Version 5.0 [Machine-readable database]. Minneapolis: University of Minnesota, 2010. Available Online.
World Bank Prospects Group. 2013. Annual Remittances Data, April 2014 update. Available Online.