

Canadian Immigrants in the United States

A family celebrates Canada Day at the Embassy of Canada in Washington, DC. (Photo: Connect2Canada)
Canadian migration has generally been a small share of immigration to the United States, historically fluctuating according to economic factors in the two countries. In 1960, Canadian immigrants made up about 10 percent of the total U.S. foreign-born population. Though the number of Canadians in the United States has decreased and levelled off since then, this population has grown more diverse, and today includes students, family migrants, skilled professionals, and retirees. As of 2016, about 783,000 Canadians lived in the United States, accounting for less than 2 percent of the roughly 44 million U.S. immigrants.
The motives of Canadian migrants have changed over time. Beginning in 1867, migrants from Eastern Canada came to the United States to work in the burgeoning manufacturing sector. In 1900, the U.S. Census recorded 747,000 English-speaking and 440,000 French-speaking Canadian immigrants. The two groups settled in different regions: Most Anglophone Canadians took up residence near the border, in states such as Michigan, New York, Massachusetts, Illinois, and Rhode Island, allowing them to easily move between the two countries, while Francophone Canadians largely moved to New England and California. French Canadian migration increased between 1900 and 1930, driven by discrimination as well as poor economic conditions in Quebec. After 1930, increased political autonomy for Quebec and the growth of the Canadian economy following World War II led to a steady decline in Canadian arrivals.
In the second half of the 20th century, Canadian migration shifted and diversified significantly, especially after enactment of the North American Free Trade Agreement (NAFTA) in 1994. Canadian immigrants now include highly educated professionals, students, those seeking family reunification, and “snowbirds,” people in or near retirement attracted by warmer southern climates. Canadian students are the fifth-largest group of foreign students enrolled in U.S. higher education, and high-skilled Canadians receive the third-largest number of employer-sponsored H-1B temporary visas. Many Canadians also come to the United States on NAFTA Professional (TN) visas to work in a variety of professional occupations, although the exact number is unknown.
Figure 1. Canadian Immigrant Population in the United States, 1980–2016
![]()
Sources: Data from U.S. Census Bureau 2010 and 2016 American Community Surveys (ACS), and Campbell J. Gibson and Emily Lennon, "Historical Census Statistics on the Foreign-born Population of the United States: 1850-1990" (Working Paper no. 29, U.S. Census Bureau, Washington, DC, February 1999), available online.
Click here to view an interactive chart showing trends in the size of U.S. immigrant populations by country of birth, from 1960 to the present.
The United States is by far the top destination for most Canadian emigrants, with others settling primarily in the United Kingdom (92,000), Australia (57,000), France (26,000), and Italy (26,000), according to mid-2017 estimates by the United Nations Population Division. Click here to view an interactive map showing where migrants from Canada and other countries have settled worldwide.
Most Canadians in the United States who obtain lawful permanent residence—also known as receiving a green card—do so either as immediate relatives of U.S. citizens or as employer-sponsored immigrants. Compared to the overall foreign-born population, Canadians have a higher median income, are less likely to live in poverty, and are more likely to have health insurance and to be college educated. They are significantly older, on average, than the overall immigrant and U.S.-born populations.
Using data from the U.S. Census Bureau (the most recent 2016 American Community Survey [ACS] as well as pooled 2012–16 ACS data) and the Department of Homeland Security’s Yearbook of Immigration Statistics, this Spotlight provides information on the Canadian population in the United States, focusing on its size, geographic distribution, and socioeconomic characteristics.
Note: Data from ACS and DHS represent persons born in Canada; they do not include immigrants born outside of Canada who then gained Canadian citizenship via naturalization and later moved to the United States.
Click on the bullet points below for more information:
- Distribution by State and Key Cities
- English Proficiency
- Age, Education, and Employment
- Income and Poverty
- Immigration Pathways and Naturalization
- Health Coverage
- Diaspora
- Remittances
Distribution by State and Key Cities
In the 2012–16 period, most immigrants from Canada lived in California (16 percent), Florida (14 percent), or New York (7 percent). The six counties with the most Canadians were Los Angeles County in California, Maricopa County in Arizona, Broward County in Florida, King County in Washington, and Orange and San Diego counties in California. Together, these counties account for about 15 percent of the Canadian population in the United States.
Figure 2. Top States of Residence for Canadians in the United States, 2012–16
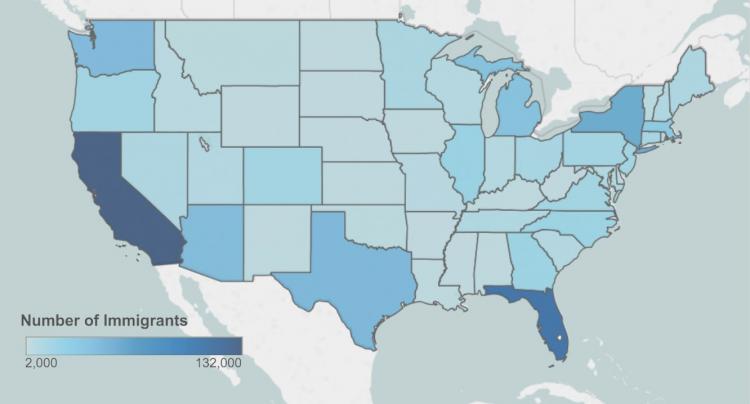
Note: Pooled 2012–16 ACS data were used to get statistically valid estimates at the state level for smaller-population geographies. Not shown is the population in Alaska and Hawaii, which are small in size; for details, visit the Migration Policy Institute (MPI) Data Hub to view an interactive map showing geographic distribution of immigrants by state and county, available online.
Source: MPI tabulation of data from U.S. Census Bureau pooled 2012–16 ACS.
As of 2012–16, the U.S. cities with the largest number of Canadians were the greater New York, Los Angeles, and Miami metropolitan areas, which together accounted for about 15 percent of Canadians in the United States.
Figure 3. Top Metropolitan Areas of Residence for Canadians in the United States, 2012–16
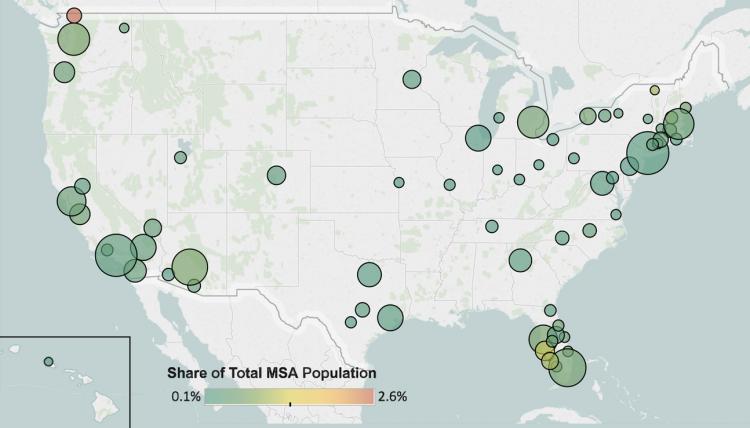
Note: Pooled 2012–16 ACS data were used to get statistically valid estimates at the metropolitan statistical-area level for smaller-population geographies. Not shown is the population in Alaska, which is small in size.
Source: MPI tabulation of data from U.S. Census Bureau pooled 2012–16 ACS.
Table 1. Top Concentrations of Canadians by Metropolitan Area, 2012–16
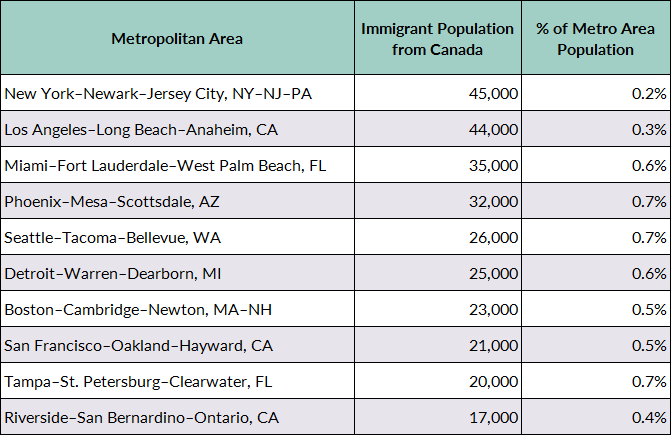
Source: MPI tabulation of data from the U.S. Census Bureau pooled 2012–16 ACS.
Click here for an interactive map that highlights the metropolitan areas with the highest concentrations of immigrants from Canada and other countries.
Canadian immigrants are more likely to be proficient in English than the overall foreign-born population. In 2016, less than 4 percent of Canadians reported limited English proficiency (LEP), compared to 49 percent of all immigrants.
Most Canadians report speaking only English at home: about 81 percent, versus 16 percent of the overall U.S. foreign-born population. Another 12 percent of Canadians speak French as a primary language at home. Some Canadians also reported speaking Spanish (less than 2 percent), Chinese (1 percent), or German (1 percent) at home.
Note: Limited English Proficient refers to those who indicated on the ACS questionnaire that they spoke English less than “very well.” Chinese includes Mandarin, Cantonese, and other Chinese languages.
Age, Education, and Employment
Canadian immigrants are significantly older than the overall foreign-born and native-born populations. In 2016, the median age of Canadians was 54 years, compared to 44 years for all immigrants and 36 years for the U.S. born. Canadians are more likely than the native born but less likely than the overall immigrant population to be of working age (18 to 64; see Figure 4).
Figure 4. Age Distribution of the U.S. Population by Origin, 2016
![]()
Note: Numbers may not add up to 100 as they are rounded to the nearest whole number.
Source: MPI tabulation of data from the U.S. Census Bureau 2016 ACS.
Canadians ages 25 and over have much higher educational attainment compared to both the native- and overall foreign-born populations. In 2016, approximately 48 percent of Canadian immigrants had a bachelor's degree or higher, compared to about 32 percent of the U.S. born and 30 percent of all immigrants. Just 8 percent of Canadian adults lack a high school diploma, versus 29 percent of all immigrant adults.
This high educational attainment is linked to the specific channels through which Canadian immigrants enter the United States. Many arrive as international college students or high-skilled temporary workers (requiring a university degree) on either NAFTA Professional (TN) or H-1B visas, who later apply for a green card. In the 2016–17 school year, close to 27,100 Canadians were enrolled in U.S. higher education institutions, accounting for 2.5 percent of the 1.1 million foreign students in the United States, according to the Institute of International Education. About half of Canadians study business and management (16 percent), health professions (14 percent), social sciences (11 percent), and physical and life sciences (10 percent).
Canadians participate in the labor force at a lower rate than both the native- and overall foreign-born populations. About 56 percent of Canadians ages 16 and over were in the civilian labor force in 2016, compared to 66 percent of all immigrants and 62 percent of the native born. Meanwhile, Canadians are much more likely to be employed in management, business, science, and arts occupations than either group (62 percent; see Figure 5).
Figure 5. Employed Workers in the Civilian Labor Force (ages 16 and older) by Occupation and Origin, 2016
![]()
Source: MPI tabulation of data from the U.S. Census Bureau 2016 ACS.
In FY 2017, Canadian citizens accounted for 1 percent of the 365,700 H-1B petitions (initial and continuing employment) for high-skilled temporary work approved by U.S. Citizenship and Immigration Services (USCIS), the third-largest group after Indians (76 percent) and Chinese (9 percent). Some Canadians also arrive on TN visas for professional work. The TN visa is similar to the H-1B classification, but it has some distinct advantages: There are no annual limits on the number of TN visas granted, and employers do not have to meet a prevailing wage requirement. Because Canadians (along with Mexicans) can apply for TN visas at the border if they meet the criteria, estimating the number of TN visa holders working in the United States is extremely difficult.
Canadians overall have significantly higher incomes than the native- and overall foreign-born populations. In 2016, households headed by a Canadian immigrant had a median income of $77,000, compared to $54,000 and $58,000 for all immigrant and U.S.-born households, respectively.
In 2016, just 6 percent of Canadian families were living in poverty, a lower rate than the 9 percent for the native born and 15 percent for immigrant families overall.
Immigration Pathways and Naturalization
Canadians are about as likely to be naturalized U.S. citizens as immigrants overall. In 2016, 47 percent of Canadians were naturalized citizens, compared to 49 percent of the total foreign-born population.
In general, Canadians arrived earlier than the overall immigrant population. The largest share, approximately 62 percent, arrived prior to 2000, followed by 18 percent between 2000 and 2009, and 20 percent in 2010 or later (see Figure 6).
Figure 6. Canadians and All Immigrants in the United States by Period of Arrival, 2016
![]()
Note: Numbers may not add up to 100 as they are rounded to the nearest whole number.
Source: MPI tabulation of data from the U.S. Census Bureau 2016 ACS.
Most Canadians who obtain green cards do so through family reunification channels. In fiscal year (FY) 2016, 57 percent of the roughly 12,800 Canadians who became lawful permanent residents (LPRs) did so as either immediate relatives of U.S. citizens or other family members, a lower share than the 68 percent of all new LPRs. In contrast, a far greater share of Canadians than of LPRs overall obtained their green cards through employment channels (see Figure 7).
Figure 7. Immigration Pathways of Canadian Immigrants and All Immigrants in the United States, 2016
![]()
Notes: Family-sponsored: Includes adult children and siblings of U.S. citizens as well as spouses and children of green-card holders. Immediate relatives of U.S. citizens: Includes spouses, minor children, and parents of U.S. citizens. Diversity Visa lottery: The Immigration Act of 1990 established the Diversity Visa lottery program to allow entry to immigrants from countries with low rates of immigration to the United States. The law states that 55,000 diversity visas in total are made available each fiscal year. Individuals born in Canada are not eligible for the lottery.
Source: MPI tabulation of data from Department of Homeland Security (DHS), 2016 Yearbook of Immigration Statistics (Washington, DC: DHS Office of Immigration Statistics, 2017), available online.
As of March 31, 2018, 730 Canadians participated in the Deferred Action for Childhood Arrivals (DACA) program—a fraction of the 693,850 unauthorized immigrants receiving work authorization and protection from deportation through DACA, according to U.S. Citizenship and Immigration Services (USCIS).
A greater share of Canadians is covered by private health insurance than the overall foreign- and U.S.-born populations. Canadians are also about as likely to have public coverage as the total immigrant population and less likely compared to the native-born population. In 2016, 5 percent of Canadian immigrants were uninsured, versus 7 percent of the native born and 20 percent of all foreign born (see Figure 8).
Figure 8. Health Coverage for Canadians, All Immigrants, and the Native Born, 2016
![]()
Note: The sum of shares by type of insurance is likely to be greater than 100 because people may have more than one type of insurance.
Source: MPI tabulation of data from the U.S. Census Bureau 2016 ACS.
The Canadian diaspora in the United States is comprised of approximately 3.3 million individuals who were either born in Canada or reported Canadian or French-Canadian ancestry, according to tabulations from the U.S. Census Bureau 2016 ACS.
In 2017, Canadians living abroad, whether in the United States or other country, sent approximately US $1.3 billion in remittances to Canada via formal channels, according to World Bank data. Remittances have not increased significantly in the past decade and represented about 0.1 percent of the country’s gross domestic product (GDP) in 2016.
Figure 9. Annual Remittance Flows to Canada, 1981–2017
![]()
Note: The 2017 figure represents World Bank estimates.
Source: MPI tabulations of data from the World Bank Prospects Group, “Annual Remittances Data,” April 2018 update.
Sources
Dion, Patrick and Mireille Vezina. 2010. Emigration from Canada to the United States from 2000 to 2006. Ottawa: Statistics Canada. Available online.
Finnie, Ross. 2004. Who Moves? A Logit Model Analysis of Inter-Provincial Migration in Canada. Applied Economics 36 (16): 1759-79.
Gibson, Campbell J. and Emily Lennon. 1999. Working Paper No. 29, Historical Census Statistics on the Foreign-Born Population of the United States: 1850 to 1990. Washington, DC: U.S. Census Bureau. Available online.
Green, Alan, Mary MacKinnon, and Chris Minns. 2005. Conspicuous by Their Absence: French Canadians and the Settlement of the Canadian West. The Journal of Economic History 65 (3): 822-49.
Institute of International Education (IIE). 2017. Open Doors: Report on International Educational Exchange. Washington, DC: IIE. Available online.
Lew, Byron and Bruce Cater. 2012. Canadian Emigration to the U.S., 1900-1930: Characterizing Movers and Stayers, and the Differential Impact of Immigration Policy on the Mobility of French and English Canadians. Paper prepared for the meeting of the Canadian Network for Economic History, Banff, Alberta, October 26-28, 2012.
Paquette, William A. 2013. Canadian Immigrants. Salem Press Encyclopedia. Ipswich, MA: Salem Press.
United Nations Population Division. N.d. International Migrant Stock by Destination and Origin. Accessed March 1, 2018. Available online.
U.S. Census Bureau. N.d. 2016 American Community Survey (ACS). American FactFinder. Accessed March 1, 2018. Available online.
---. 2017. 2016 American Community Survey. Accessed from Steven Ruggles, Katie Genadek, Ronald Goeken, Josiah Grover, and Matthew Sobek. Integrated Public Use Microdata Series: Version 7.0 [dataset]. Minneapolis: University of Minnesota, 2017. Available online.
U.S. Citizenship and Immigration Services (USCIS). 2018. DACA Population Data, March 31, 2018. Available online.
---. 2018. Characteristics of H-1B Specialty Occupation Workers: Fiscal Year 2017. Washington, DC: USCIS. Available online.
U.S. Department of Homeland Security (DHS), Office of Immigration Statistics. 2017. 2016 Yearbook of Immigration Statistics. Washington, DC: DHS Office of Immigration Statistics. Available online.
World Bank Prospects Group. 2018. Annual Remittances Data, April 2018 update. Available online.