

Canadian Immigrants in the United States

The flags of the United States and Canada. (Photo: U.S. Embassy and Consulates in Canada)
Immigration from Canada accounts for a small and shrinking share of total migration to the United States. In 1960, about 10 percent of the U.S. foreign-born population was Canadian, a share that fell to about 4 percent in 1990 and dropped yet again to less than 2 percent as of 2019. Presently, there are about 800,000 Canadians in the United States.
This decline is partly due to changing U.S. policy and improved economic and educational opportunities in Canada. Migration from Canada was relatively unrestricted through the first half of the 20th century. However, the U.S. Immigration and Nationality Act of 1965 significantly limited immigration from the Western Hemisphere, affecting Canadians as well as people from across the Americas. Combined with the growth of the Canadian economy following World War II, the number of Canadians in the United States decreased by 13 percent, from 952,000 in 1960 to 843,000 two decades later. The profile of the Canadian immigrant population also changed; newer arrivals were more likely to live away from the U.S.-Canada border and to immigrate for family reunification reasons.
The dynamics of Canadian immigration to the United States changed again in 1994 with enactment of the North American Free Trade Agreement (NAFTA), which facilitated access to new temporary work visas that became a primary pathway for Canadians. Today’s immigrants from Canada include students, highly educated professionals, family migrants, and retirees wishing to live in warmer climates. Canadian students are the fifth-largest group among the 1 million international students attending U.S. colleges and universities, and Canadians received the third-largest number of employer-sponsored H-1B temporary visas in fiscal year (FY) 2020. Still, the Canadian immigrant population has overall remained quite low compared to other groups, and its numbers have stayed relatively steady since 1980 (see Figure 1).
Figure 1. Canadian Immigrant Population in the United States, 1980-2019
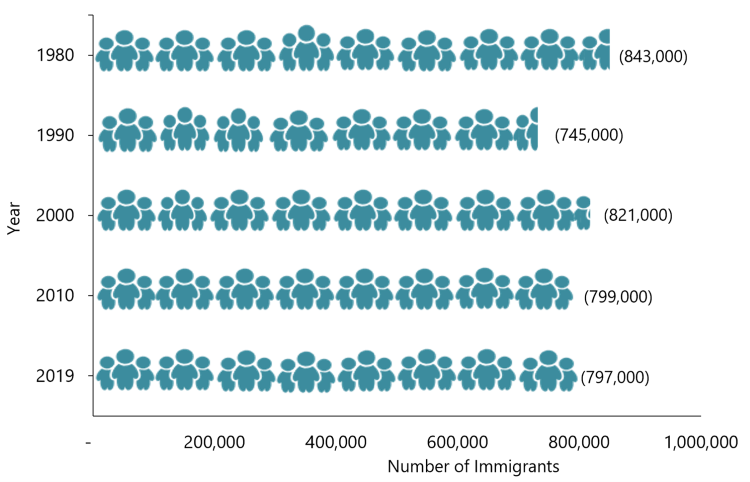
Sources: Data from U.S. Census Bureau 2010 and 2019 American Community Surveys (ACS), and Campbell J. Gibson and Kay Jung, "Historical Census Statistics on the Foreign-born Population of the United States: 1850-2000" (Working Paper no. 81, U.S. Census Bureau, Washington, DC, February 2006), available online.
The United States is by far the most popular destination for Canadians living abroad, accounting for more than 60 percent of all emigrants from Canada. The United Kingdom is home to the next largest population of Canadians (108,000), followed by Australia (58,000), France (28,000), and Italy (26,000), according to mid-2019 United Nations Population Division estimates.
Click here to view an interactive map showing where migrants from Canada and other countries have settled worldwide.
Most Canadian immigrants have been in the United States for decades, having arrived before 2000. The primary pathways to permanent residence, also known as holding a green card, are through employment or family reunification. Canadian immigrants are more likely to be highly educated compared to U.S.- and overall foreign-born adults. They also are more likely to be older and less likely to participate in the civilian labor force. Of those who do work, the majority are employed in management, business, science, and arts occupations.
Using data from the U.S. Census Bureau (the most recent 2019 American Community Survey [ACS] as well as pooled 2015-19 ACS data), the Department of Homeland Security’s Yearbook of Immigration Statistics, and the World Bank, this Spotlight provides information on the Canadian immigrant population in the United States, focusing on its size, geographic distribution, and socioeconomic characteristics.
Click on the bullet points below for more information:
- Distribution by State and Key Cities
- English Proficiency
- Age, Education, and Employment
- Income and Poverty
- Immigration Pathways and Naturalization
- Unauthorized Immigrant Population
- Health Coverage
- Diaspora
- Remittances
Distribution by State and Key Cities
In the 2015-19 period, immigrants from Canada were concentrated in California (16 percent) and Florida (14 percent), followed by New York and Texas (7 percent and 6 percent, respectively). Ten states were home to about two-thirds of the Canadian immigrant population. The top five counties by Canadian population were Los Angeles County in California, Maricopa County in Arizona, King County in Washington, Broward County in Florida, and Orange County in California. Together five these counties were home to 13 percent of Canadian immigrants in the United States.
Figure 2. Top Destination States for Canadian-Born Immigrants in the United States, 2015-19
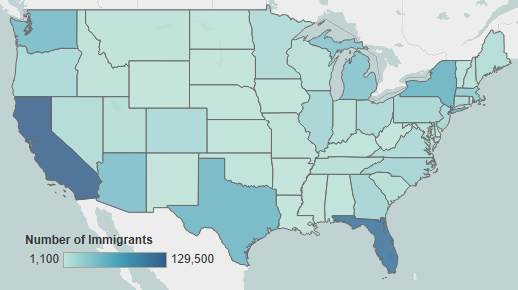
Note: Pooled 2015-19 ACS data were used to get statistically valid estimates at the state level for smaller-population geographies. Not shown are the populations in Alaska and Hawaii, which are small in size; for details, visit the Migration Policy Institute (MPI) Data Hub for an interactive map showing geographic distribution of immigrants by state and county, available online.
Source: MPI tabulation of data from U.S. Census Bureau pooled 2015-19 ACS.
Click here for an interactive map that highlights the states and counties with the highest concentrations of immigrants from Canada and other countries.
The U.S. cities with the largest number of Canadians were the greater New York, Los Angeles, Miami, Phoenix, and Seattle metropolitan areas. These five metro areas accounted for about 22 percent of Canadians residing in the United States.
Figure 3. Top Metropolitan Destinations for Canadian-Born Immigrants in the United States, 2015-19
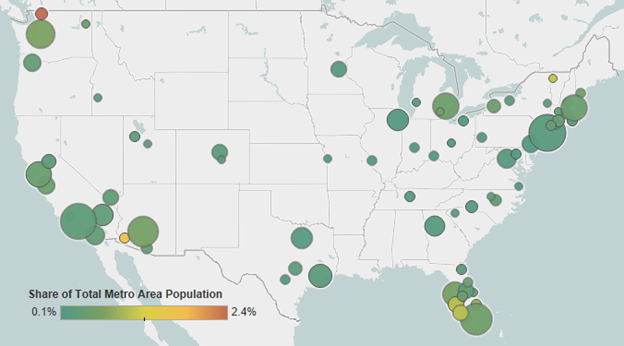
Note: Pooled 2015-19 ACS data were used to get statistically valid estimates at the metropolitan statistical-area level for smaller-population geographies.
Source: MPI tabulation of data from U.S. Census Bureau pooled 2015-19 ACS.
Click here for an interactive map that highlights the metropolitan areas with the highest concentrations of immigrants from Canada and other countries.
Table 1. Top Concentrations by U.S. Metropolitan Area for the Foreign Born from Canada, 2015-19
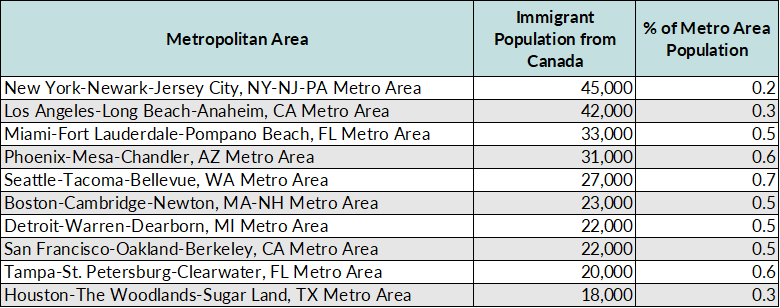
Source: MPI tabulation of data from the U.S. Census Bureau pooled 2015-19 ACS.
Canadian immigrants are much more likely to be proficient in English than the overall foreign-born population, which in 2019 stood at 44.9 million. Only about 3 percent of Canadians ages 5 and over reported limited English proficiency as of 2019, compared to 46 percent of all immigrants. Approximately 80 percent of Canadians speak only English at home, versus 16 percent of the total foreign-born population.
Note: Limited English proficiency refers to those who indicated on the ACS questionnaire that they spoke English less than “very well.”
Age, Education, and Employment
In 2019, Canadian immigrants were on average older than both the overall foreign-born population and the U.S. born. The Canadian median age was 54 years, compared to 46 years for all immigrants and 37 years for the native born. This is due to the higher number of retirement-age Canadians: 30 percent of Canadian immigrants were age 65 or older, versus only 17 percent of the overall foreign-born population and 16 percent of the native-born population. Meanwhile, Canadians ages 17 and below are represented at about the same rate as the immigrant population overall (5 percent and 6 percent, respectively), and much lower than the U.S. native-born population (about 25 percent).
Figure 4. Age Distribution by Origin, 2019
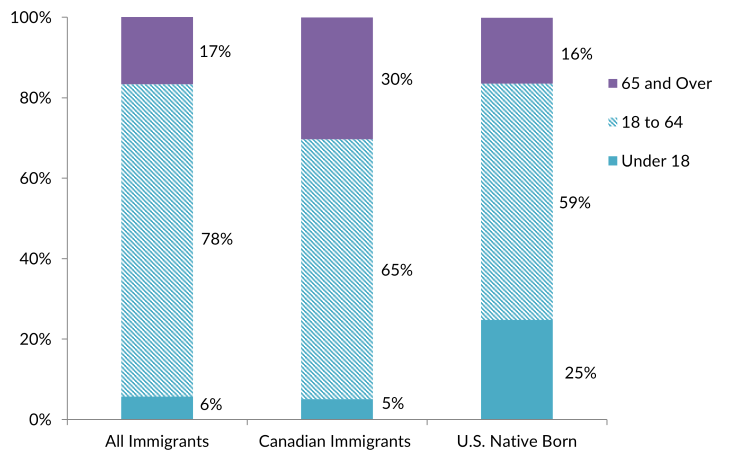
Note: Percentages may not add up to 100 as they are rounded to the nearest whole number.
Source: MPI tabulation of data from the U.S. Census Bureau 2019 ACS.
Canadians have higher education rates than both the U.S.- and overall foreign-born populations. In 2019, 51 percent of Canadian immigrants ages 25 and older reported having at least a bachelor’s degree, compared to 33 percent of both U.S.- and foreign-born adults. Notably, Canadian immigrants were more likely to have a graduate or professional degree compared to the other two groups (23 percent compared to 14 percent for all immigrants and 13 percent for the U.S. born).
This high educational attainment, in part, reflects the routes through which many Canadians enter the United States. Canada is the fifth-largest country of origin for international students enrolled in U.S. higher education institutions, after China, India, South Korea, and Saudi Arabia. About 26,000 Canadians studied in the United States in school year 2019-20, representing approximately 2 percent of all international students, according to the Institute of International Education.
Many Canadians also immigrate due to their professional skills. In FY 2020, Canadian citizens accounted for about 1 percent of the 427,000 H-1B temporary work visa petitions approved by U.S. Citizenship and Immigration Services (USCIS). This was the third most of any country; Indian and Chinese nationals accounted for 75 percent and 12 percent, respectively. Canadians are also eligible for NAFTA Professional (TN) visas to work in a variety of professional occupations such as accountants, teachers, and medical doctors. Although the exact number and the educational profile of Canadians on TN visas is not publicly available, most jobs eligible for H-1B and TN visas require at least a bachelor’s degree.
Canadians participate in the labor force at a lower rate than all immigrants and the U.S.-born population. In 2019, 58 percent of Canadian immigrants ages 16 and older were in the civilian labor force, compared to 67 percent of the foreign- and 62 percent of the native-born populations. Those Canadians who were employed were much more likely to be in management, business, science, and arts occupations (see Figure 5).
Figure 5. Employed Workers in the Civilian Labor Force (ages 16 and older) by Occupation and Origin, 2019
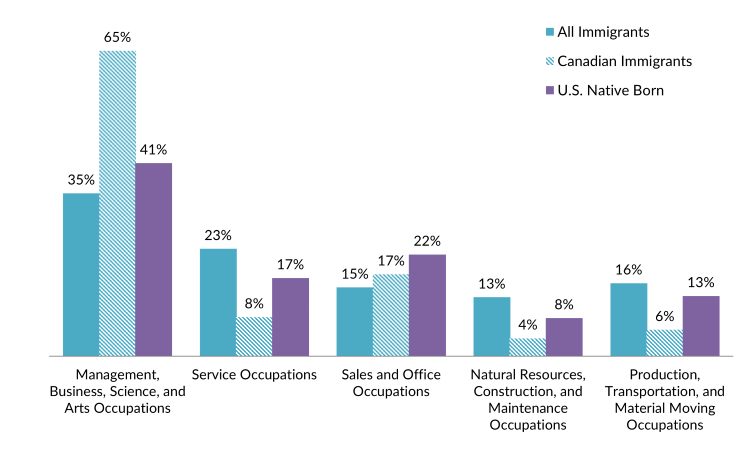
Source: MPI tabulation of data from the U.S. Census Bureau 2019 ACS.
Canadian immigrants have much higher incomes than the total foreign- and native-born populations. In 2019, households headed by a Canadian immigrant had a median income of $89,000, compared to $64,000 and $66,000 for overall immigrant and U.S.-born households, respectively.
In 2019, Canadian immigrants were less likely to be in poverty (8 percent) than immigrants overall (14 percent) or the U.S. born (12 percent).
Immigration Pathways and Naturalization
Canadians are slightly less likely to be naturalized U.S. citizens than all other immigrants. In 2019, 50 percent of Canadian immigrants were naturalized citizens, compared to 52 percent of all immigrants.
Compared to all immigrants, Canadians are more likely to have arrived before 2000. Those long-term U.S. residents account for approximately 60 percent of Canadian immigrants, whereas about 51 percent of the overall foreign-born population arrived before 2000.
Figure 6. Canadian-Born and All Immigrants in the United States by Period of Arrival, 2019

Source: MPI tabulation of data from the U.S. Census Bureau 2019 ACS.
In FY 2019, 11,400 Canadians became lawful permanent residents (LPRs), accounting for just 1 percent of the 1 million new green-card holders. Most Canadians who obtain green cards do so as immediate relatives of U.S. citizens or through employment. Fifty-three percent of Canadians who received a green card in 2019 were family members of U.S. citizens or other green-card holders. An additional 44 percent received their green card through employment-based channels, a rate about three times higher than for all new LPRs (14 percent) (see Figure 7).
Figure 7. Immigration Pathways of Canadian-Born and All Legal Permanent Residents in the United States, 2019

Notes: Immediate relatives of U.S. citizens include spouses, minor children, and parents of U.S. citizens. Family-sponsored preferences include adult children and siblings of U.S. citizens, and spouses and children of green-card holders. The Diversity Visa lottery refers to the program established by the Immigration Act of 1990 to allow immigrants from countries with low rates of immigration to enter the United States; the law states that 55,000 diversity visas in total are made available each fiscal year. Individuals born in Canada are not eligible for the Diversity Visa 2022 lottery.
Source: MPI tabulation of data from Department of Homeland Security (DHS), 2019 Yearbook of Immigration Statistics (Washington, DC: DHS Office of Immigration Statistics, 2020), available online.
Unauthorized Immigrant Population
The Migration Policy Institute (MPI) estimates that approximately 57,000 unauthorized immigrants from Canada resided in the United States as of 2018, accounting for less than 1 percent of the 11 million unauthorized immigrants in the country.
Click here for an interactive map of the 2018 unauthorized immigrant population in the United States.
As of December 2020, there were approximately 8,000 unauthorized Canadian youth and young adults who were eligible for the Deferred Action for Childhood Arrivals (DACA) program, according to MPI estimates. However, only 630 Canadians had DACA status, representing a fraction of the nearly 636,400 active DACA recipients.
Click here to view the top origin countries of DACA recipients and their U.S. states of residence.
Canadians have high health insurance coverage rates compared to both the overall immigrant and native-born populations. In 2019, just 5 percent of immigrants from Canada were uninsured, compared to 8 percent of the native born and 20 percent of the total foreign born. Canadian immigrants were also more likely to be covered by private health insurance than the overall foreign- and U.S.-born populations (see Figure 8).
Figure 8. Health Coverage for Canadian-Born Immigrants, All Immigrants, and the U.S. Born, 2019

Note: The sum of shares by type of insurance is likely to be greater than 100 because people may have more than one type of insurance.
Source: MPI tabulation of data from the U.S. Census Bureau 2019 ACS.
The Canadian diaspora in the United States is comprised of approximately 3.1 million individuals who were either born in Canada or reported Canadian ancestry or race, according to tabulations from the U.S. Census Bureau 2019 ACS.
Click here to view the top 20 diaspora groups in the United States.
Canadians living abroad and others with connections to the country sent about U.S. $911 million in remittances to Canada via formal channels in 2020, according to World Bank estimates. That represents an approximately U.S. $400 million decline from 2019, which is likely an impact of the COVID-19 pandemic and related economic crisis. Remittances had otherwise remained largely stable in the last decade and represented just 0.1 percent of the country’s gross domestic product (GDP) in 2020.
Figure 9. Annual Remittance Flows to Canada, 1990-2020

Note: The 2020 figure represents World Bank estimates.
Source: MPI tabulations of data from the World Bank Prospects Group, “Annual Remittances Data,” May 2021 update.
Click here to view an interactive chart showing annual remittances received and sent by Canada and other countries.
Sources
Dion, Patrick and Mireille Vezina. 2010. Emigration from Canada to the United States from 2000 to 2006. Ottawa: Statistics Canada. Available online.
Gibson, Campbell J. and Kay Jung. 2006. Historical Census Statistics on the Foreign-born Population of the United States: 1850-2000. Working Paper no. 81, U.S. Census Bureau, Washington, DC, February 2006. Available online.
Institute of International Education. N.d. Open Doors 2020. Accessed May 26, 2021. Available online.
Passell, Jeffrey S. and D’Vera Cohn. 2019. Mexicans Decline to Less than Half the U.S. Unauthorized Population for the First Time. Washington, DC: Pew Research Center. Available online.
United Nations Population Division. N.d. International Migrant Stock by Destination and Origin. Accessed May 10, 2021. Available online.
U.S. Census Bureau. N.d. 2019 American Community Survey. Accessed May 15, 2020. Available online.
U.S. Census Bureau and Statistics Canada. 1990. Current Population Reports, Series P-23, No. 161: Migration between the United States and Canada. Washington, DC: U.S. Government Printing Office. Available online.
U.S. Citizenship and Immigration Services (USCIS). 2020. Count of Active DACA Recipients by Country of Birth as of Dec. 31, 2020. Available online.
---. 2021. Characteristics of H-1B Specialty Occupation Workers: Fiscal Year 2020 Annual Report to Congress. Washington, DC: USCIS. Available online.
U.S. Department of Homeland Security (DHS), Office of Immigration Statistics. 2020. 2019 Yearbook of Immigration Statistics. Washington, DC: DHS Office of Immigration Statistics. Available online.
World Bank Prospects Group. 2021. Annual Remittances Data, May 2021 update. Available online.