

Caribbean Immigrants in the United States

Marchers at Dominican Day Parade in New York City. (Photo: iStock.com/Ryan Rahman)
Approximately 4.5 million Caribbean immigrants resided in the United States in 2019, representing 10 percent of the nation’s 44.9 million total foreign-born population. Close to 90 percent of immigrants in the United States from the 13 Caribbean countries and 17 dependent territories come from one of four countries: Cuba, the Dominican Republic, Jamaica, and Haiti.
The Caribbean is the most common region of birth for the 4.5 million Black immigrants in the United States, accounting for 46 percent of the total. Jamaica (16 percent) and Haiti (15 percent) are the two largest origin countries for Black immigrants.
There have been distinct push and pull factors for nationals of the Caribbean, given that the United States previously exercised direct political control over most Caribbean nations, with the notable exception of Jamaica.
Voluntary, large-scale migration from the Caribbean to the United States began in the first half of the 20th century, following the end of the Spanish-American War, when a defeated Spain renounced its claims to Cuba and, among other acts, ceded Puerto Rico to the United States. In the early 1900s, U.S. firms employed Caribbean workers to help build the Panama Canal, and many of these migrants later settled in New York. A high demand for labor among U.S. fruit harvesting industries drew additional labor migrants, particularly to Florida. After World War II, U.S. companies heavily recruited thousands of English-speaking “W2” contract workers from the Bahamas, Jamaica, and Barbados to fill critical jobs in health care and agriculture. Around the same time, political instability in Cuba, Haiti, and the Dominican Republic fueled emigration from the region. Following the 1959 Cuban Revolution, an estimated 1.4 million people fled to the United States. Whereas the first major migration of immigrants from Cuba, Haiti, the Dominican Republic, and other Caribbean nations was comprised mostly of the members of the elite and skilled professionals, the subsequent flows consisted chiefly of their family members and working-class individuals.
In the past few decades, natural disasters and deteriorating political and economic conditions have caused significant devastation and displacement, driving more migrants, from Cuba and Haiti in particular, to seek routes to the United States by land, sea, and air. While the Caribbean immigrant population tripled in size between 1980 and 2010, its growth rate had declined by 2019 (see Figure 1).
Figure 1. Caribbean Immigrants in the United States, 1980-2019
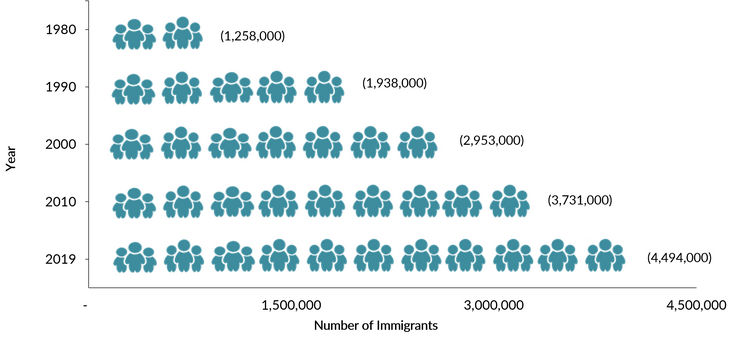
Sources: Data from U.S. Census Bureau 2010 and 2019 American Community Surveys (ACS), and Campbell J. Gibson and Kay Jung, "Historical Census Statistics on the Foreign-born Population of the United States: 1850-2000" (Working Paper No. 81, U.S. Census Bureau, Washington, DC, February 2006), available online.
Depending on the origin country and period of arrival, immigrants from the Caribbean have varying skill levels, racial composition, language background, and motivations for migration.
Table 1. Caribbean Immigrants in the United States by Country and Region of Origin, 2019
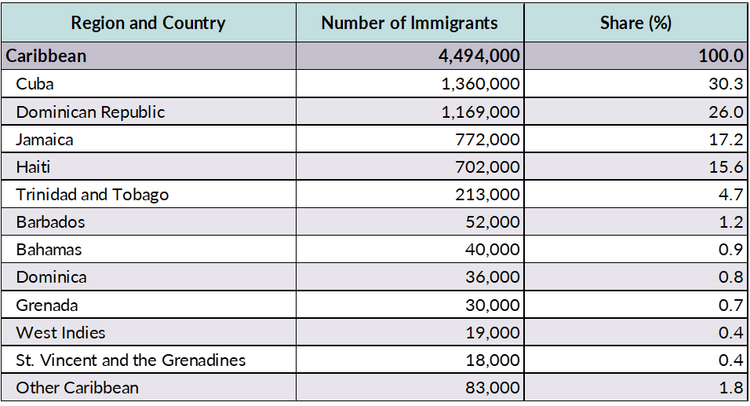
Source: Migration Policy Institute (MPI) tabulation of data from the U.S. Census Bureau 2019 ACS.
Click here for an interactive chart showing changes in the number of immigrants from the Caribbean in the United States over time. Select individual Caribbean countries from the dropdown menu.
U.S. Policy Differences for Cubans and Haitians
Cubans and Haitians have received particular designations under U.S. immigration law, with Cubans uniquely preferenced.
The 1966 Cuban Adjustment Act provided Cubans admitted or paroled into the United States a direct pathway to legal permanent residence after just one year—the only fast-track designation of its type for a particular national origin. The 1994 and 1995 U.S.-Cuba Migration Accords further set the foundation for what became known as the “wet foot, dry foot” policy, enabling Cubans who reached U.S. land to apply for legal status, with or without a valid visa. (Cubans intercepted at sea are returned to the island.) The 1966 law and the wet foot, dry foot policy resulted in large increases in the U.S. Cuban population. In working to improve diplomatic relations with Cuba, the Obama administration ended the policy in early 2017. Cuban migrants arriving at a U.S. land border without prior authorization have since been subject to deportation on par with other foreign nationals.
In May 2022, the State Department announced that it would reinstate the Cuban Family Reunification Parole program, which allows eligible U.S. citizens and legal permanent residents (also known as green-card holders) to apply for parole for relatives in Cuba. Once granted parole, a temporary status, these family members may enter the United States and apply for work authorization, while waiting for their green cards to be approved.
Haitians have not had access to similarly favorable treatment, though some Haitians living in the United States without authorization have been granted Temporary Protected Status (TPS). TPS provides protection from removal and work authorization to foreign nationals from certain designated countries experiencing ongoing armed conflict, natural disaster, or other extraordinary conditions.
Haiti initially was designated for TPS in January 2010, following a devastating earthquake that killed more than 300,000 people. The designation was continuously extended until November 2017, when the Trump administration, citing improved conditions in Haiti, announced the termination of the status. The designation was set to expire in July 2019; legal challenges prevented its termination under the Trump administration. The Biden administration took a different course: On May 22, 2021, it announced a new 18-month designation, citing turbulent conditions in Haiti. The U.S. government estimated that 155,000 Haitians already in the United States may be eligible for TPS under this new designation (which is open to Haitians covered under the previous designation).
Caribbean Immigrants in the United States
Globally, approximately 9.1 million migrants from the Caribbean reside outside their countries of birth, according to mid-2020 estimates by the United Nations Population Division. Of these, about 860,000 (9 percent) lived elsewhere within the region. Outside the region, the United States was by far the top destination for Caribbean immigrants, followed by Canada (415,000), Spain (351,000), and Chile (297,000).
Click here to view an interactive map showing where migrants from the Caribbean and other countries have settled worldwide. Select individual Caribbean countries from the dropdown menu.
On average, most Caribbean immigrants obtain lawful permanent residence in the United States through either family reunification or humanitarian channels. Compared to the total foreign-born population, Caribbean immigrants are more likely to be naturalized citizens and slightly less likely to be Limited English Proficient (LEP), but have lower educational attainment and higher poverty rates.
Using data from the U.S. Census Bureau (the 2019 American Community Survey [ACS], as well as pooled 2015-19 ACS data), the Department of Homeland Security’s Yearbook of Immigration Statistics, and World Bank annual remittances data, this Spotlight provides information on the Caribbean immigrant population in the United States, focusing on its size, geographic distribution, and socioeconomic characteristics.
The article examines the population of immigrants from the entire Caribbean region, as well as those from the five largest origin countries: Cuba, the Dominican Republic, Jamaica, Haiti, and Trinidad and Tobago.
Click on the bullet points below for more information:
- Distribution by State and Key Cities
- English Proficiency
- Age, Education, and Employment
- Income and Poverty
- Immigration Pathways and Naturalization
- Unauthorized Immigrant Population
- Health Coverage
- Diaspora
- Remittances
Distribution by State and Key Cities
Two-third of immigrants from the Caribbean lived in just two states: Florida (41 percent) and New York (25 percent) as of the 2015-19 period. Miami-Dade County in Florida was home to 864,800 Caribbean immigrants, the highest share among all U.S. counties, representing 20 percent of the total Caribbean foreign-born population. Much smaller numbers reside in Broward County in Florida and Bronx, Kings, and Queens counties in New York. Together, these five counties accounted for 43 percent of the total Caribbean immigrant population in the United States.
Figure 2. Top States of Residence for Caribbean Immigrants in the United States, 2015-19
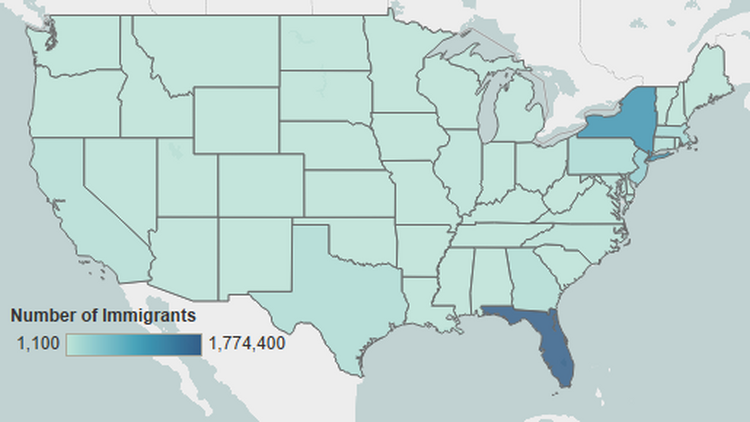
Note: Pooled 2015-19 ACS data were used to get statistically valid estimates at the state level for smaller-population geographies. Not shown are the populations in Alaska and Hawaii, which are small in size; for details, visit the Migration Policy Institute’s (MPI) Migration Data Hub for an interactive map showing geographic distribution of immigrants by state and county, available online.
Source: MPI tabulation of data from U.S. Census Bureau pooled 2015-19 ACS.
Click here for an interactive map that shows the geographic distribution of immigrants by state and county. Select the Caribbean region or an individual Caribbean nation from the dropdown menu to see which states and counties have the highest distributions of immigrants from the region/country.
The greater New York and Miami metropolitan areas were the U.S. cities with the most Caribbean immigrants. Approximately 60 percent of all Caribbean immigrants in the United States lived in these two metro areas.
Figure 3. Top Metropolitan Areas of Residence for Caribbean Immigrants in the United States, 2015-19
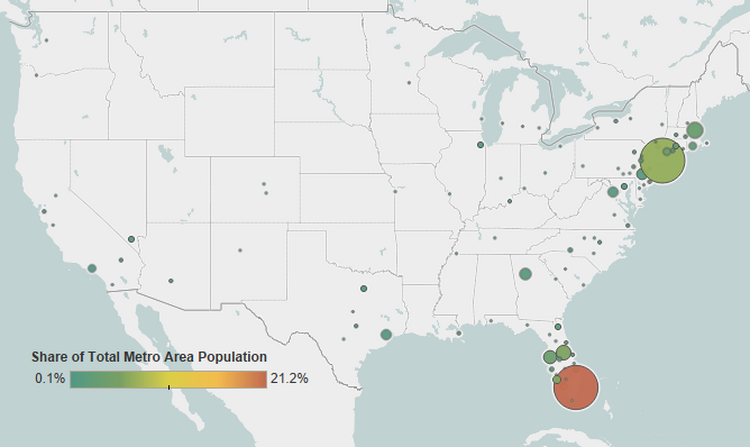
Note: Pooled 2015-19 ACS data were used to get statistically valid estimates at the metropolitan statistical area level for smaller-population geographies. Not shown are the populations in Alaska and Hawaii, which are small in size.
Source: MPI tabulation of data from the U.S. Census Bureau pooled 2015-19 ACS.
Click here for an interactive map that highlights the metropolitan areas with the highest concentrations of immigrants from the Caribbean and other countries.
Table 2. Top Concentrations of Caribbean Immigrants by Metropolitan Area, 2015-19
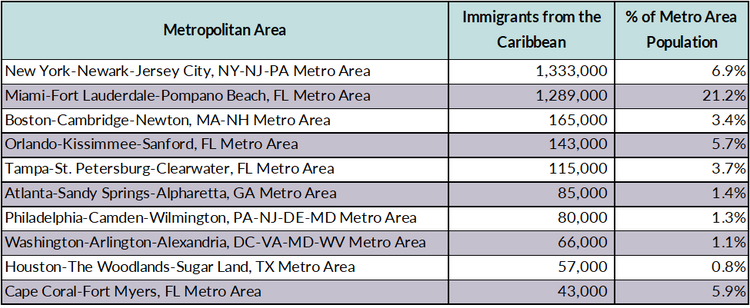
Source: MPI tabulation of data from the U.S. Census Bureau pooled 2015-19 ACS.
Caribbean immigrants are slightly more likely to be proficient in English than the overall foreign-born population. In 2019, approximately 43 percent of Caribbean immigrants (ages 5 and over) reported limited English proficiency, versus 46 percent of all immigrants. Very few immigrants from English-speaking Jamaica and Trinidad and Tobago (1 percent each) were LEP, while immigrants from the Dominican Republic (63 percent) and Cuba (62 percent) had much higher LEP shares than all U.S immigrants.
Note: Limited English proficiency refers to those who indicated on the ACS questionnaire that they spoke English less than “very well.”
Age, Education, and Employment
Caribbean immigrants are generally older than both the foreign- and U.S.-born populations. The median age of immigrants from the Caribbean was approximately 50 in 2019, compared to 46 for the overall foreign-born population and 37 for the U.S.-born. Seventy-three percent of Caribbean immigrants were of working age (18 to 64 years old), compared to 78 percent and 59 percent for the overall immigrant and native-born populations, respectively. Most immigrants from the Dominican Republic (77 percent), Haiti (76 percent), and Trinidad and Tobago and Jamaica (75 percent each) were of working age, while more than one-quarter (28 percent) of Cuban immigrants were seniors (ages 65 and older).
Figure 4. Age Distribution of the U.S. Population by Origin, 2019

Note: Percentages may not add up to 100 as they are rounded to the nearest whole number.
Source: MPI tabulation of data from the U.S. Census Bureau, 2019 ACS.
Caribbean immigrant adults (ages 25 and older) are more likely to have graduated from high school but less likely to have graduated from college than the overall foreign-born population. About 22 percent of Caribbean immigrants had not finished high school, compared to 26 percent of all immigrants and 8 percent of U.S.-born adults as of 2019. Approximately 22 percent of Caribbean adults had a bachelor’s degree or higher, versus 33 percent of foreign- and native-born adults. More than one-quarter of immigrants from Trinidad and Tobago (28 percent) and Jamaica (27 percent) held at least a bachelor’s degree, while nearly one-third (31 percent) from the Dominican Republic did not graduate from high school.
In the 2020-21 school year, about 11,200 Caribbean students were enrolled in U.S. higher educational institutions, representing approximately 1 percent of the 914,100 international students in the United States. Jamaica (2,700), the Bahamas (2,300), and the Dominican Republic (1,200) were the region’s top origin countries for international students.
Caribbean immigrants participate in the U.S. civilian labor force at the same rate as the overall foreign-born population and at a higher rate than the U.S. born. About 67 percent each of the Caribbean and overall immigrant populations ages 16 and over were in the civilian labor force in 2019, compared to 62 percent of the U.S. born.
Caribbean immigrants are more likely to be employed in service occupations and production, transportation, and material moving occupations than the other two groups of workers. Immigrants from Trinidad and Tobago were most likely to be employed in management, business, science, and arts occupations (41 percent), while those from Haiti (38 percent) and the Dominican Republic (32 percent) were the mostly like to be in service occupations.
Figure 5. Employed Workers in the U.S. Civilian Labor Force (ages 16 and older) by Occupation and Origin, 2019
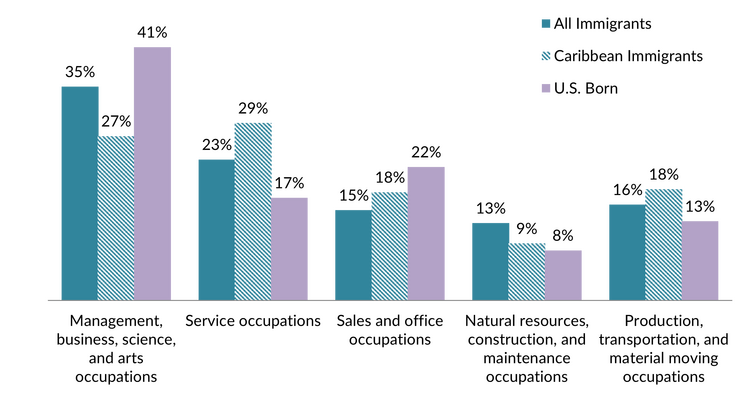
Source: MPI tabulation of data from the U.S. Census Bureau 2019 ACS.
Income and Poverty
On average, household incomes of Caribbean immigrants were lower in 2019, with a median income of $52,000, compared to $64,000 for all immigrant households and $66,000 for U.S.-born households. The highest median household incomes among the largest Caribbean populations in the United States were those headed by immigrants from Trinidad and Tobago ($67,000) and Jamaica ($62,000), while those from the Dominican Republic had the lowest ($44,000).
Approximately 15 percent of Caribbean immigrants were living in poverty (defined as earning less than $25,750 for a family of four in 2019), compared to 14 percent of the entire immigrant population and 12 percent of the U.S. born. For major origin groups, poverty rates were highest among immigrants from the Dominican Republic (19 percent) and Cuba (16 percent) and lowest among those from Jamaica (10 percent).
Immigration Pathways and Naturalization
Caribbean immigrants were more likely to be naturalized U.S. citizens than the overall foreign-born population (63 percent and 52 percent, respectively). Immigrants from Trinidad and Tobago (74 percent) and Jamaica (69 percent) had the highest naturalization share among the major national-origin groups from the region, while those from the Dominican Republic had the lowest rate (57 percent), though still higher than for the overall immigrant population.
Caribbean immigrants, on average, have similar patterns of arrival as the overall foreign-born population. Seventy-one percent of those from Trinidad and Tobago entered before 2000, compared to 53 percent of the total Caribbean immigrant population. About 28-29 percent of immigrants from the Dominican Republic and Cuba are recent arrivals (2010 or later).
Figure 6. Caribbean Immigrants and All Immigrants in the United States by Period of Arrival, 2019
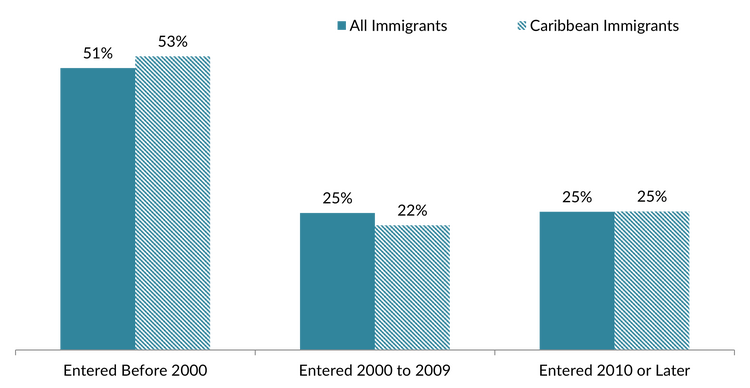
Note: Numbers may not add up to 100 as they are rounded to the nearest whole number.
Source: MPI tabulation of data from the U.S. Census Bureau 2019 ACS.
About 10 percent (72,900) of the 707,400 immigrants who became lawful permanent residents (LPRs) in 2020 were from the Caribbean; about 80 percent of them received a green card as immediate relatives of U.S. citizens or through family-sponsored preferences.
New green-card holders from the Caribbean were more likely to have been admitted as refugees or asylees (17 percent) than the overall LPR population (9 percent), due to the large number of Cuban nationals who have adjusted their status under the fast-track process set by the Cuban Adjustment Act. Approximately 74 percent of Cubans who got a green card in 2020 entered the United States initially via a humanitarian channel. Meanwhile, Caribbean immigrants were much less likely to become green-card holders via employment pathways (2 percent) than all new LPRs (21 percent).
Figure 7. Immigration Pathways of Caribbean Immigrants and All Lawful Permanent Residents in the United States, FY 2020
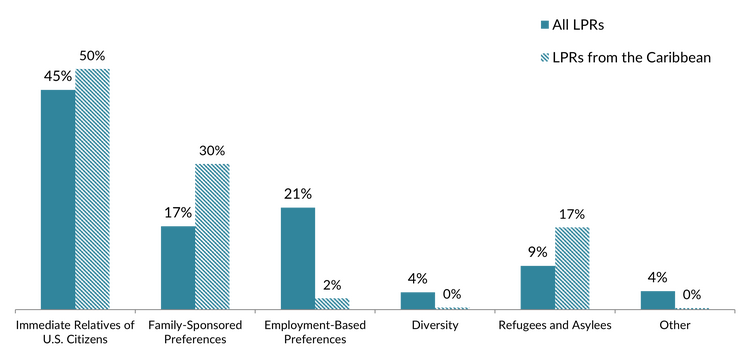
Notes: Immediate relatives of U.S. citizens include spouses, minor children, and parents of U.S. citizens. Family-sponsored preferences include adult children and siblings of U.S. citizens as well as spouses and children of green-card holders. The Diversity Visa lottery was established by the Immigration Act of 1990 to allow entry to immigrants from countries with low rates of immigration to the United States. The law states that 55,000 diversity visas in total are to be made available each fiscal year. Individuals born in the Dominican Republic, Haiti, Jamaica, and several United Kingdom dependent territories in the Caribbean (Anguilla, British Virgin Islands, Cayman Islands, Montserrat, and Turks and Caicos Islands) were not eligible for the 2023 lottery.
Source: MPI tabulation of data from Department of Homeland Security (DHS), 2020 Yearbook of Immigration Statistics (Washington, DC: DHS Office of Immigration Statistics, 2022), available online.
Unauthorized Immigrant Population
The Migration Policy Institute (MPI) estimates as that as of 2019, approximately 327,000 (3 percent) of the 11 million unauthorized immigrants living in the United States were from the Caribbean. About half of the unauthorized Caribbean immigrant population was from the Dominican Republic (164,000), followed by Haiti (70,000), Jamaica (55,000), and Trinidad and Tobago (14,000).
Click here for an interactive data tool showing top states and counties of residence for unauthorized immigrants in the United States by country or region of origin.
Click here for demographic profiles of the unauthorized immigrant population in the United States at national, state, and top county levels.
According to the most recent data available from U.S. Citizenship and Immigration Services (USCIS), approximately 6,210 unauthorized immigrants from the Caribbean were active participants in the Deferred Action for Childhood Arrivals (DACA) program, which provides temporary deportation relief and work authorization, as of December 2021. These individuals represented about 1 percent of all 611,500 DACA participants. Individuals from Jamaica (2,020 participants), the Dominican Republic (1,780), and Trinidad and Tobago (1,340) were the largest Caribbean groups participating in DACA.
Click here for two interactive data tools showing MPI estimates of DACA-eligible unauthorized immigrant populations for top states and counties and by national origin.
Caribbean immigrants are more likely to be insured than the overall foreign-born population. Among the largest Caribbean immigrant-origin groups, those from Trinidad and Tobago had the lowest rate of being uninsured (10 percent) in 2019, while those from Cuba and Haiti had the highest rates (18 percent and 17 percent, respectively).
Figure 8. Health Insurance Coverage for Caribbean Immigrants, All Immigrants, and the U.S. Born, 2019
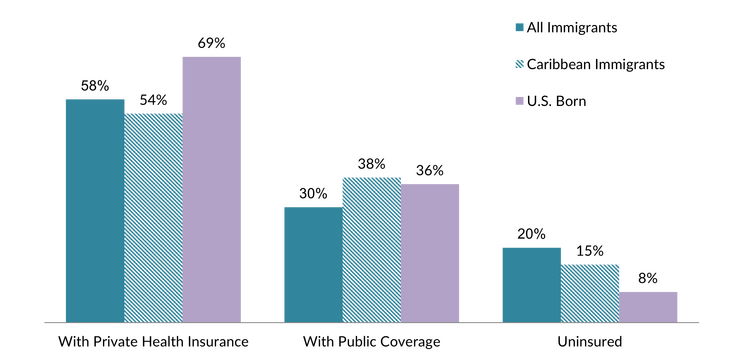
Note: The sum of shares by type of insurance is likely to be greater than 100 because people may have more than one type of insurance.
Source: MPI tabulation of data from the U.S. Census Bureau, 2019 ACS.
The Caribbean diaspora in the United States is comprised of more than 8.5 million individuals who were either born in the Caribbean or reported ancestry of a given country in the Caribbean, according to tabulations from the U.S. Census Bureau’s 2019 ACS.
Remittances sent to the Caribbean have grown steadily since 1990 despite a small decline after the 2007-09 Great Recession. In 2020, remittances originating around the world and sent via formal channels to the region equaled $15.1 billion, up 7 percent from $14.1 billion in 2019.
The Dominican Republic received more than half (55 percent) of all remittances sent to the Caribbean, followed by Haiti (21 percent) and Jamaica (20 percent). (Note: no remittances data are available for Cuba and the Bahamas). The level of dependence on remittances varies significantly by country: Remittances accounted for 22 percent of Haiti’s gross domestic product (GDP) and 21 percent of Jamaica’s, 11 percent of the Dominican Republic’s, and about 1 percent each in Aruba and Trinidad and Tobago.
Figure 9. Annual Remittance Flows to Caribbean Countries, 1980-2020
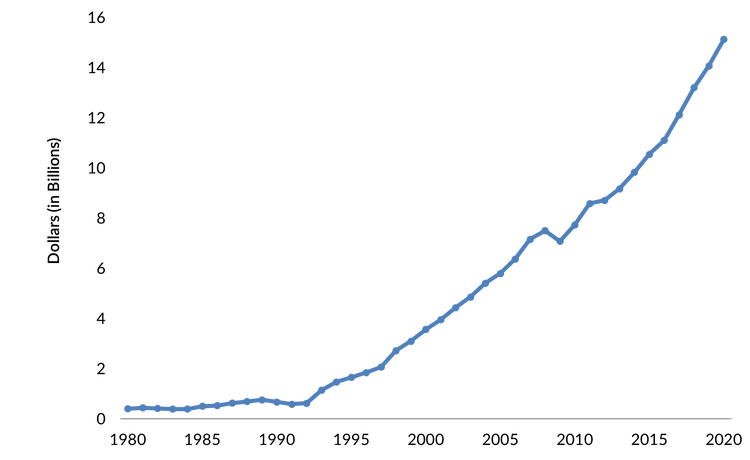
Note: The 2020 figure represents World Bank estimates. No data are available for Anguilla, Bahamas, British Virgin Islands, Cuba, the former country of Guadeloupe, Martinique, Montserrat, and Bonaire, Saba, and Sint Eustatius.
Source: World Bank Prospects Group, “Annual Remittances Data,” May 2021 update, available online.
Visit the Migration Data Hub’s collection of interactive remittances tools, which track remittances by inflow and outflow, between countries, and over time.
Sources
Acosta, Yesenia and Patricia de la Cruz. 2011. The Foreign Born from Latin America and the Caribbean: 2010. Washington, DC: U.S. Census Bureau. Available online.
Chishti, Muzaffar and Jessica Bolter. 2022. Rise in Maritime Migration to the United States Is a Reminder of Chapters Past. Migration Information Source, May 25, 2022. Available online.
Duany, Jorge. 2017. Cuban Migration: A Postrevolution Exodus Ebbs and Flows. Migration Information Source, July 6, 2017. Available online.
Foner, Nancy. 2001. West Indian Migration to New York: An Overview in Islands in the City: West Indian Migration to New York, 1-22. University of California Press. Available online.
Francis, Tam’ra-Kay. 2022. West Indian Immigration to the United States (1900 - ). BlackPast, January 27, 2022. Available online.
Gibson, Campbell J. and Emily Lennon. 2006. Historical Census Statistics on the Foreign-Born Population of the United States: 1850 to 1990. Working Paper No. 81, U.S. Census Bureau, Washington, DC, February 2006. Available online.
Institute of International Education (IIE). 2021. International Students: All Places of Origin. Washington, DC: IIE. Available online.
International Organization for Migration (IOM) Global Migration Data Analysis Center (GMDAC) Migration Data Portal. 2021. Migration Data in the Caribbean. Updated August 27, 2021. Available online.
Tamir, Christine and Monica Anderson. 2022. One-In-Ten Black People in the U.S. Are Immigrants. Washington, DC: Pew Research Center. Available online.
Thomas, Kevin J. A. 2012. A Demographic Profile of Black Caribbean Immigrants in the United States. Washington, DC: Migration Policy Institute. Available online.
United Nations Population Division. 2020. International Migrant Stock 2020: Destination and Origin. Available online.
U.S. Census Bureau. 2020. 2019 American Community Survey. Accessed from Steven Ruggles, Katie Genadek, Ronald Goeken, Josiah Grover, and Matthew Sobek. Integrated Public Use Microdata Series: Version 11.0 [dataset]. Minneapolis: University of Minnesota. Available online.
U.S. Citizenship and Immigration Services (USCIS). 2022. Count of Active DACA Recipients by Month of Current DACA Expiration as of December 31, 2021. Available online.
U.S. Department of Homeland Security (DHS), Office of Immigration Statistics. 2022. 2020 Yearbook of Immigration Statistics. Washington, DC: DHS Office of Immigration Statistics. Available online.
Wilson, Jill. 2022. Temporary Protected Status and Deferred Enforced Departure. Washington, DC: Congressional Research Service. Updated April 19, 2022. Available online.
World Bank Prospects Group. 2021. Annual Remittances Data, May 2021 update. Available online.