

Chinese Immigrants in the United States

A street view of Chinatown in New York City. In 2016, the New York metro area was home to the largest number of Chinese immigrants in the United States. (Photo: Thomas Hawk)
Chinese immigrants are the third-largest foreign-born group in the United States, after Mexicans and Indians. Chinese immigration to the United States has consisted of two waves, the first arriving in the mid-1800s and the second from the late 1970s to the present. The population has grown more than six-fold since 1980, reaching 2.3 million in 2016, or 5 percent of the approximately 44 million immigrant population overall.
Chinese migration to the United States picked up during the mid-19th century, when primarily male manual laborers arrived in the West Coast for agricultural, mining, railroad construction, and other low-skilled jobs. In 1882, the Chinese Exclusion Act, a political response to virulent anti-Chinese public attitudes and pressures from labor unions, severely limited future immigration of Chinese workers and barred Chinese residents from obtaining U.S. citizenship. Though the law was repealed in 1943, few mainland Chinese could immigrate due to other restrictions placed on non-European immigration in the 1920s.
Beginning in the mid-1960s, significant policy changes in the United States and China opened a new chapter of Chinese migration. These shifts included the 1965 Immigration Act in the United States that re-opened migration pathways for non-European immigrants and created temporary worker programs for skilled workers, as well as China’s loosening of its emigration controls in 1978, and the normalization of U.S.-China relations in 1979. The number of immigrants from mainland China in the United States nearly doubled from 299,000 in 1980 to 536,000 in 1990, and again to 989,000 in 2000, reaching 2.1 million in 2016.
Nationals of Hong Kong, a territory of the United Kingdom until 1997, were not subject to the same set of immigration limits as mainland Chinese citizens; they began moving to the United States in the late 1960s. By 1980, there were 85,000 Hong Kong-born immigrants in the United States, which increased to 212,000 by 2016, comprising about 9 percent of all Chinese immigrants.
Unlike in the 19th century, Chinese immigrants arriving post-1965 are predominantly skilled: China is now the principal source of foreign students enrolled in U.S. higher education, and its nationals receive the second-largest number of employer-sponsored H-1B temporary visas, after India. Chinese immigrants are enrolled in college and graduate school at a rate more than twice that of immigrants overall (15 percent, compared to 7 percent). Chinese nationals are also overrepresented in applications for the EB-5 investor visa program, accounting for 90 percent of applicants in fiscal year (FY) 2015.
Figure 1. Chinese Immigrant Population in the United States, 1980-2016
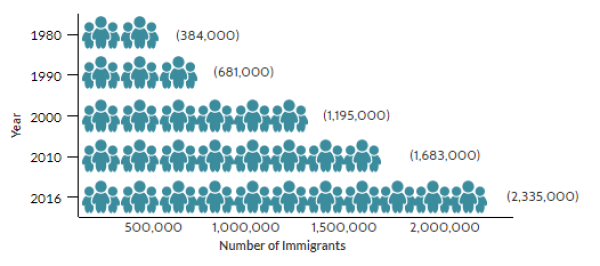
Sources: Data from U.S. Census Bureau 2010 and 2016 American Community Surveys (ACS), and 1980, 1990, and 2000 Decennial Census.
The United States is the top destination for Chinese immigrants, accounting for 22 percent of the nearly 11 million Chinese living outside of China, according to mid-2015 estimates by the United Nations Population Division. Other popular destinations include Canada (939,000), South Korea (751,000), Japan (652,000), Australia (547,000), and Singapore (511,000).
Click here to view an interactive map showing where migrants from China and other countries have settled worldwide.
Compared to the overall foreign- and native-born populations in the United States, Chinese immigrants on average are significantly better educated and are more likely to be employed in management positions. Thirty percent of Chinese immigrants who obtain lawful permanent residence in the United States (also known as getting a green card) do so through employment-based routes. The remainder qualify through family ties or as asylees.
Using data from the U.S. Census Bureau (the most recent 2016 American Community Survey [ACS] and pooled 2011-15 ACS data), the Department of Homeland Security’s Yearbook of Immigration Statistics, and World Bank annual remittance data, this Spotlight provides information on the Chinese immigrant population in the United States, focusing on its size, geographic distribution, and socioeconomic characteristics.
Click on the bullet points below for more information:
- Distribution by State and Key Cities
- English Proficiency
- Age, Education, and Employment
- Income and Poverty
- Immigration Pathways and Naturalization
- Health Coverage
- Diaspora
- Remittances
Distribution by State and Key Cities
The Chinese immigrant population is highly concentrated in two states, with roughly half residing in California (31 percent) or New York (20 percent). The top four counties by concentration in the 2011-15 period were Los Angeles County, CA; Queens County, NY; Kings County, NY; and San Francisco County, CA. Together, these four counties accounted for about 28 percent of the overall Chinese population in the United States.
Figure 2. Top Destination States for Chinese Immigrants in the United States, 2011-15
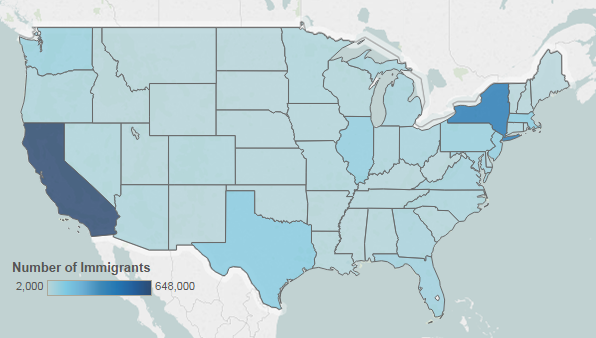
Note: Pooled 2011-15 ACS data were used to get statistically valid estimates at the state level for smaller-population geographies. Not shown are Chinese populations in Alaska and Hawaii, which are small in size; for details, visit the Migration Policy Institute (MPI) Data Hub for an interactive map showing geographic distribution of immigrants by state and county, available online.
Source: MPI tabulation of data from U.S. Census Bureau pooled 2011-15 ACS.
As of 2011-15, New York City, San Francisco, and Los Angeles were the U.S. metropolitan areas with the largest number of Chinese immigrants. These three metro areas accounted for about 44 percent of Chinese immigrants.
Figure 3. Top Metropolitan Destinations for Chinese Immigrants in the United States, 2011-15
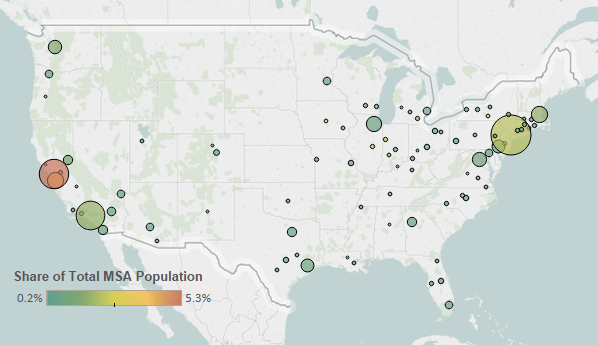
Note: Pooled 2011-15 ACS data were used to get statistically valid estimates at the metropolitan statistical-area level for smaller-population geographies.
Source: MPI tabulation of data from U.S. Census Bureau pooled 2011-15 ACS.
Table 1. Top Concentrations by Metropolitan Area for Chinese Immigrants, 2011-15
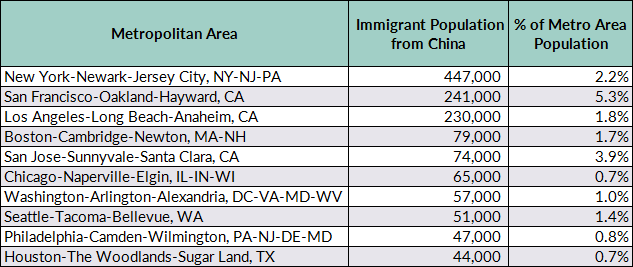
Source: MPI tabulation of data from the U.S. Census Bureau pooled 2011-15 ACS.
Click here for an interactive map that highlights the metropolitan areas with the highest concentrations of immigrants. Select China from the dropdown menu.
Chinese immigrants were less likely to be proficient in English and speak English at home than the overall U.S. foreign-born population. In 2016, about 61 percent of Chinese immigrants ages 5 and over reported limited English proficiency, compared to 49 percent of the total foreign-born population. Approximately 10 percent of Chinese immigrants spoke only English at home, versus 16 percent of all immigrants.
Note: Limited English proficiency refers to those who indicated on the ACS questionnaire that they spoke English less than “very well.”
Age, Education, and Employment
In 2016, the median age of mainland Chinese immigrants was the same as that of the overall foreign born (44 years), higher than that of the U.S. born (36 years), and lower than that of immigrants born in Hong Kong (52 years).
Overall, Chinese immigrants were more likely than the native born but slightly less likely than the overall foreign born to be of working age (18 to 64; see Figure 4).
Figure 4. Age Distribution of the U.S. Population by Origin, 2016
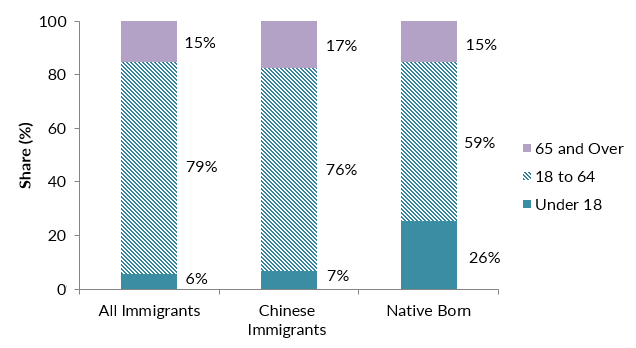
Note: Numbers may not add up to 100 as they are rounded to the nearest whole number.
Source: MPI tabulation of data from the U.S. Census Bureau, 2015 ACS. Click here to view an interactive chart showing the age and sex distribution of top immigrant groups, including the Chinese born.
Chinese immigrants have much higher levels of educational attainment compared to the overall foreign- and U.S.-born populations. In 2016, about half of Chinese adults (ages 25 and over) had at least a bachelor’s degree, significantly higher than among immigrants overall and U.S.-born adults (30 percent and 32 percent, respectively). Notably, Chinese immigrants were twice as likely to have a graduate or professional degree compared to the other two groups (27 percent compared to 13 percent for all immigrants and 12 percent for the U.S. born).
This high educational attainment is linked to the specific channels through which Chinese immigrants enter the United States. Many post-1965 Chinese immigrants arrived either as international college students or high-skilled H-1B temporary workers (requiring a university degree), and who then apply for U.S. permanent residency. China is the leading sending country of U.S. international students: In the 2015-16 school year, close to 329,000 Chinese were enrolled in U.S. higher education institutions, according to the Institute of International Education. They accounted for nearly one-third of the 1 million foreign students studying in the United States. Approximately 43 percent of Chinese students were enrolled in science, technology, engineering, and math (STEM) fields. In FY 2016, Chinese citizens accounted for 9 percent of the 345,000 H-1B petitions (initial and continuing employment) approved by U.S. Citizenship and Immigration Services (USCIS).
Chinese immigrants participated in the labor force at a lower rate than the overall immigrant and native-born populations. In 2016, about 58 percent of Chinese immigrants ages 16 and over were in the civilian labor force, compared to 66 percent and 62 percent of the total foreign- and native-born populations, respectively. Slightly more than half of Chinese immigrants were employed in management, business, science, and arts occupations, versus 32 percent of the overall foreign-born and 39 percent of the native-born population.
Figure 5. Employed Workers in the Civilian Labor Force (ages 16 and older) by Occupation and Origin, 2016
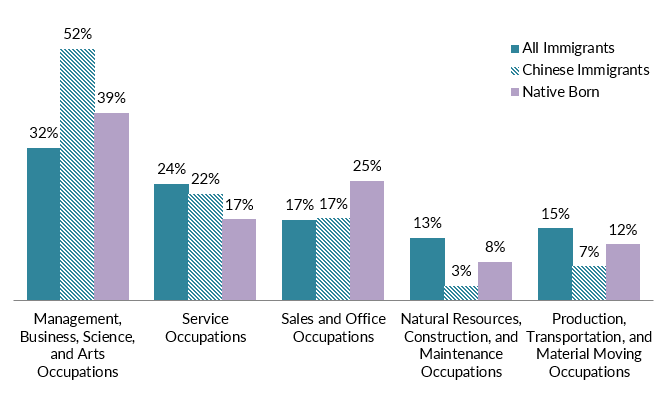
Source: MPI tabulation of data from the U.S. Census Bureau 2016 ACS.
Chinese immigrants recorded a slightly higher median household income in 2016 than that of the overall foreign-born population. Households headed by mainland Chinese immigrants had a median income of $56,000, compared to $54,000 and $58,000 for overall immigrant and native-born households, respectively. Separately, the median income of households headed by immigrants from Hong Kong was much higher, at approximately $99,000.
Reflecting income patterns, Chinese families are less likely to live in poverty than immigrant families overall. In 2016, 13 percent and 6 percent, respectively, of families headed by an immigrant from mainland Chinese or Hong Kong lived in poverty, compared to 15 percent for all immigrant families. For comparison, 9 percent of families with a U.S.-born head of household lived in poverty.
Immigration Pathways and Naturalization
In 2016, 51 percent of the 2.3 million Chinese immigrants in the United States were naturalized U.S. citizens, a rate slightly higher than the 49 percent for the overall foreign-born population.
Compared to all immigrants, the Chinese born are more likely to have arrived in the United States recently. Thirty-one percent of Chinese immigrants arrived in 2010 or later. Another 25 percent arrived between 2000 and 2009, and 44 percent before 2000 (see Figure 6).
Figure 6. Immigrants from China and All Immigrants in the United States by Period of Arrival, 2016
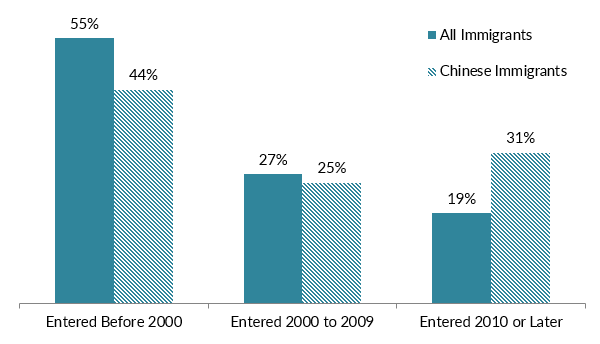
Source: MPI tabulation of data from the U.S. Census Bureau 2016 ACS. Numbers may not add up to 100 as they are rounded to the nearest whole number.
In FY 2015, China was the second largest country of origin, after Mexico, for new lawful permanent residents (LPRs, also known as green-card holders): Close to 77,000 or 7 percent of the 1,051,000 new LPRs were from mainland China, Hong Kong, or Macau. Compared to new green-card holders in general, Chinese immigrants were more likely to use employment-based preferences: Thirty percent, compared to 14 percent of the total (see Figure 6). Chinese immigrants were less likely than new LPRs overall to obtain green cards as immediate relatives of U.S. citizens (37 percent, compared to 44 percent).
There were significant backlogs for mainland Chinese citizens applying for LPR status through employment-based and family-sponsored channels, due to the annual per-country quota of immigrant visas available for these categories. According to the most recent visa issuance data, in September 2017 the State Department was processing visa applications for some family and employment preferences that had been filed by Chinese applicants in January 2002.
Figure 7. Immigration Pathways of Chinese Immigrants and All Immigrants in the United States, 2015
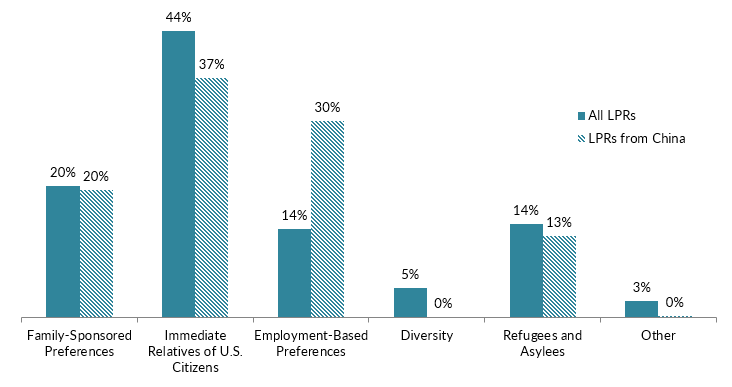
Notes: Family-sponsored: Includes adult children and siblings of U.S. citizens as well as spouses and children of green-card holders. Immediate relatives of U.S. citizens: Includes spouses, minor children, and parents of U.S. citizens. Diversity Visa Lottery: The Immigration Act of 1990 established the Diversity Visa Lottery to allow entry to immigrants from countries with low rates of immigration to the United States. The law states that 55,000 diversity visas in total are made available each fiscal year. Individuals born in mainland China are not eligible for the lottery, but those from Hong Kong and Macau are eligible.
Source: MPI tabulation of data from Department of Homeland Security (DHS), 2015 Yearbook of Immigration Statistics (Washington, DC: DHS Office of Immigration Statistics, 2016), available online.
Although most Chinese immigrants in the United States are legally present, approximately 268,000 of them were unauthorized in 2014, according to Migration Policy Institute (MPI) estimates, comprising around 2 percent of the 11 million unauthorized immigrants in the United States.
In 2016, approximately 25,000 Chinese youth were immediately eligible for the Deferred Action for Childhood Arrivals (DACA) program, according to MPI estimates. However, as of September 4, 2017, just 740 youth from mainland China were active DACA holders. The DACA program, which offers work authorization and relief from deportation to young unauthorized immigrants brought to the United States as children, is set to be phased out starting in March 2018.
Chinese immigrants were more likely to have private health insurance than the overall foreign-born population (67 percent compared to 56 percent). Meanwhile, they were as likely as immigrants overall to be covered by public health insurance programs, but half as likely to be uninsured (see Figure 8).
Figure 8. Health Coverage for Chinese Immigrants, All Immigrants, and the Native Born, 2016
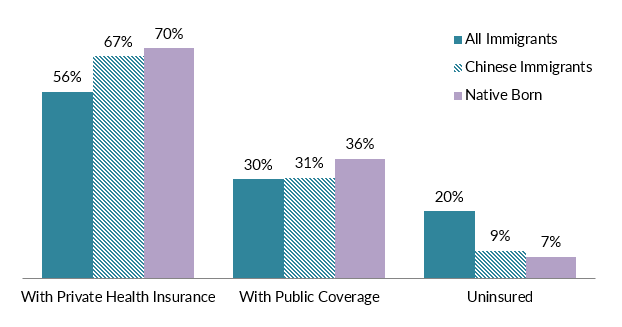
Note: The sum of shares by type of insurance is likely to be greater than 100 because people may have more than one type of insurance.
Source: MPI tabulation of data from the U.S. Census Bureau, 2016 ACS.
The Chinese diaspora in the United States is comprised of approximately 5 million individuals who were either born in China or reported Chinese ancestry or race, according to tabulations from the U.S. Census Bureau 2015 ACS.
Despite a slight drop in remittance inflow between 2015 and 2016, China remains the second largest recipient of remittances in the world (after India), taking in an estimated $61 billion in remittances via formal channels in 2016. Remittances represented less than 1 percent of China’s gross domestic product (GDP) in 2015.
Figure 9. Annual Remittance Flows to China, 1982 to 2016
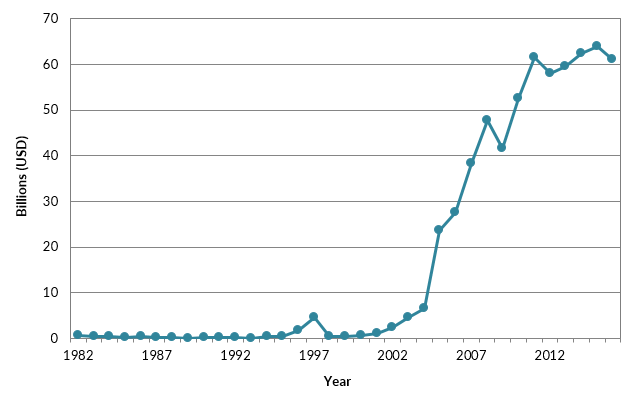
Source: MPI tabulations of data from the World Bank Prospects Group, “Annual Remittances Data,” April 2017 update.
Visit the Data Hub’s collection of interactive remittances tools, which track remittances by inflow and outflow, between countries, and over time.
Sources
Institute of International Education. N.d. Open Doors 2016. Accessed September 28, 2017. Available online.
Tian, Fangmeng. 2017. Millionaire Emigration: The Allure of Investor Visas among China’s Elite. Migration Information Source, September 20, 2017. Available online.
United Nations Population Division. N.d. International Migrant Stock by Destination and Origin. Accessed September 28, 2017. Available online.
U.S. Census Bureau. N.d. 2016 American Community Survey (ACS). American FactFinder. Accessed September 28, 2017. Available online.
---. 2016. 2015 ACS. Accessed from Steven Ruggles, Katie Genadek, Ronald Goeken, Josiah Grover, and Matthew Sobek. Integrated Public Use Microdata Series: Version 6.0 [Machine-readable database]. Minneapolis: University of Minnesota, 2010. Available online.
U.S. Citizenship and Immigration Services (USCIS). 2017. DACA Population Data. Available online.
---. 2017. Characteristics of H-1B Specialty Occupation Workers: Fiscal Year 2016. Washington, DC: USCIS. Available online.
U.S. Department of Homeland Security (DHS) Office of Immigration Statistics. N.d. 2015 Yearbook of Immigration Statistics. Accessed September 28, 2017. Available online.
U.S. Department of State. 2017. Visa Bulletin for September 2017. Available online.
World Bank Prospects Group. 2017. Annual Remittances Data, April 2017 update. Available online.