

College-Educated Immigrants in the United States

About 29 percent of immigrant adults had a college degree or higher in 2014. (Photo: Shutterstock)
In 2014, 10.5 million immigrants had a college degree or higher, representing about 29 percent of the total 36.7 million U.S. foreign-born population ages 25 and over. The Immigration Act of 1990 and other legislation passed in the last two decades have facilitated the immigration of college-educated individuals to the United States by creating temporary visa programs for high-skilled workers and attracting international students to higher education institutions, especially those in science, technology, engineering, and math (STEM) fields.
The number of immigrants with higher education has grown at more than twice the rate of the same population among the U.S. born. Between 1990 and 2000, the college-educated immigrant population increased 89 percent from 3.1 million to 5.9 million, and a further 78 percent between 2000 and 2014 (from 5.9 million to 10.5 million, see Figure 1). The native-born college-educated population grew over the same periods by 32 percent and 39 percent, respectively. Given the faster rate of growth, the foreign-born share of the total college-educated population also increased over the last two and a half decades: from 10 percent in 1990 to 16 percent in 2014.
Figure 1. Number of College-Educated Individuals in the United States by Nativity, 1990-2014
![]()
Source: Migration Policy Institute (MPI) analysis of data from the U.S. Census Bureau’s 1990 and 2000 Decennial Census and 2014 American Community Survey (ACS).
In 2014, immigrants accounted for 16 percent of all civilian employed workers. However, they represented much higher shares of workers in certain occupations including 32 percent of computer programmers, close to 30 percent of health-care support professionals, and nearly 26 percent of physicians.
Using data from the U.S. Census Bureau (the most recent 2014 American Community Survey [ACS]), Institute of International Education (IIE), and U.S. Citizenship and Immigration Services (USCIS), this spotlight provides a brief demographic and socioeconomic profile of the U.S.- and foreign-born (age 25 and older) population with at least a bachelor’s degree and highlights recent trends in and characteristics of international students and H-1B specialty occupation workers.
- Geographic Distribution
- Age, Race and Ethnicity, and Country of Origin
- English Proficiency and Education
- Employment and Occupation
- Brain Waste
- Income and Poverty
- International Students
- H1-B Specialty Occupation Workers
Similar to the overall immigrant population, college-educated immigrants are heavily concentrated in a handful states. In 2014, California had the largest number of college-educated immigrants with 2.5 million (or 24 percent of all college-educated immigrants in the United States), followed by New York (1.2 million, or 11 percent), Florida (873,000, or 8 percent), and Texas (869,000, or 8 percent, see Table 1). These four states accounted for 52 percent of the 10.5 million college-educated immigrants in the country. The next six states—New Jersey (6 percent); Illinois (5 percent); Virginia, Massachusetts, and Maryland (3 percent each); and Washington (2 percent)—accounted for another 23 percent.
Table 1. U.S. States with the Largest College-Educated Foreign-Born Population, 2014
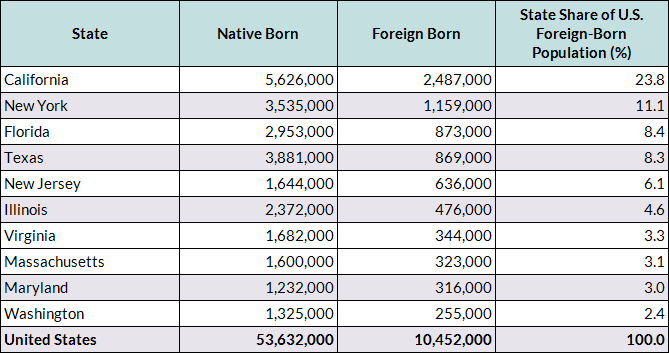
Source: MPI tabulation of data from the U.S. Census Bureau 2014 ACS.
Age, Race and Ethnicity, and Country of Origin
College-educated immigrants are younger and more likely to be of prime working age than their native-born counterparts. In 2014, 37 percent of college-educated immigrants were younger than 40 years old, compared to 32 percent of those born in the United States (see Table 2).
Table 2. Age Distribution by Nativity, 2014
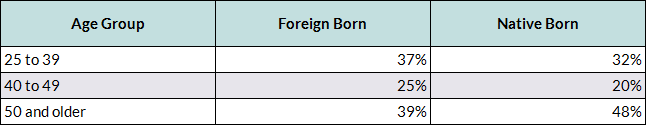
Source: MPI tabulation of data from the U.S. Census Bureau 2014 ACS.
Asians accounted for 46 percent of the total college-educated immigrant population, followed by whites (28 percent) and Latinos (17 percent). In contrast, an overwhelming majority of native college-educated individuals were white (85 percent), while minorities, particularly Asians and Latinos, were underrepresented (see Figure 2).
Figure 2. College-Educated Foreign- and Native-Born Adults by Race and Ethnicity, 2014
![]()
Notes: According to U.S. Census Bureau definitions, Latino includes all individuals who identified as Latino, regardless of race. Non-Latino Black refers to those who identified as "black only" or as "black with white, Asian or other race combinations." Non-Latino Asian includes people who identified as "Asian only" or as "Asian with white or other race combinations." Non-Latino White refers to those who reported "white only" race. Non-Latino Other Race includes individuals who identified as "other race only" or as "other race and white."
Source: MPI tabulation of data from the U.S. Census Bureau 2014 ACS.
In 2014, the top three countries of origin for college-educated immigrants were India (14 percent), China (including Hong Kong, about 8 percent), and the Philippines (8 percent, see Figure 3). The top ten countries of birth accounted for 52 percent of all college-educated immigrants.
Figure 3. Top Ten Countries of Origin of College-Educated Immigrants, 2014
![]()
Note: China includes mainland China and Hong Kong.
Source: MPI tabulation of data from the U.S. Census Bureau 2014 ACS.
English Proficiency and Education
College-educated immigrants are less likely to be Limited English Proficient (LEP) than the overall immigrant population. Twenty-seven percent of college-educated immigrants reported limited English proficiency in 2014, compared to 50 percent of the total foreign-born population.
Note: Limited English proficiency refers to those who indicated on the ACS questionnaire that they spoke English less than “very well.”
College-educated immigrants are more likely to have advanced degrees than their U.S.-born counterparts. In 2014, 14 percent of the college-educated foreign born held professional or doctorate degrees, compared to 10 percent of their native-born peers. Both groups were almost equally likely to have a master’s degree (28 percent for the foreign born and 27 percent for the native born).
Unemployment rates for college-educated adults are in general very low, and college-educated immigrants are almost as likely to be unemployed as their native counterparts. In 2014, only 4 percent of the 7.8 million college-educated immigrants in the U.S. civilian labor force were unemployed, compared to 3 percent of the 40.2 million U.S.-born college graduates.
College-educated immigrant workers are more likely than their native-born counterparts to be in high-tech, science, or engineering occupations. Although immigrants only accounted for 16 percent of total civilian employed workers in 2014, they represented much higher shares of college-educated workers in certain occupations, including computer programmers (32 percent), health-care support professionals (roughly 30 percent), and physicians (26 percent, see Figure 4).
Figure 4. Immigrant Share (%) of Employed College-Educated Workers by Occupational Group, 2014
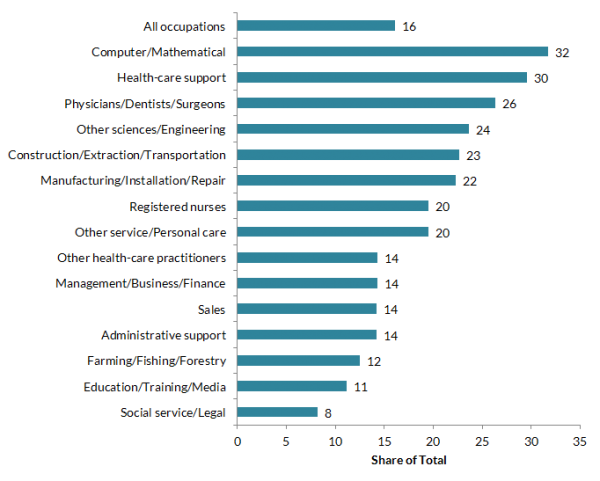
Source: MPI tabulation of data from the U.S. Census Bureau 2014 ACS.
In the 2012-14 period, approximately 1.8 million college-educated immigrants in the U.S. labor market were either unemployed or working in low-skilled jobs including as dishwashers, security guards, or taxi drivers (see Table 4). This situation represents a waste of human capital affecting around 23 percent of college-educated immigrants (compared to 18 percent of college-educated natives). Click here to read an in-depth report on brain waste and the employment pathways of skilled immigrants.
Table 3. Number and Share of College-Educated Adults (Age 25 and Older) Affected by Brain Waste, 2012-14
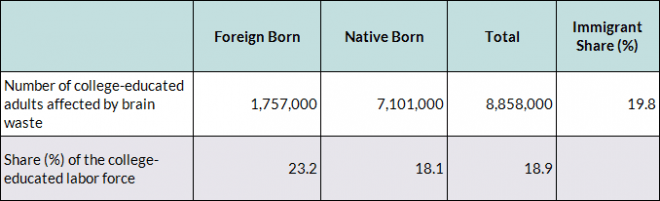
Notes: College-educated adults affected by brain waste are those who are either unemployed or are employed in low-skilled jobs such as construction labor and domestic help.
Source: MPI tabulation of data from the U.S. Census Bureau pooled 2012-14 ACS.
Overall, college-educated immigrant workers who worked at least 50 weeks in 2013 reported slightly higher median earnings than their U.S.-born counterparts ($65,000 versus $60,000).
Compared to the total foreign-born population, college-educated immigrants and their families are much less likely to live below the federal poverty line. However, they are still slightly more likely to be in poverty than their U.S.-born peers due to a combination of factors including larger family sizes, a higher level of underemployment, and a higher likelihood of working part time. In 2014, close to 8 percent of college-educated immigrants were in poverty, compared to 19 percent of all immigrants and 4 percent of their native-born counterparts.
Since 1990, the number of international students enrolled in U.S. higher-education institutions more than doubled, from 408,000 in the 1990-91 school year to 975,000 in 2014-15, according to Open Doors data from the Institute of International Education. This growth represented an increase in the share of international students in higher education from 3 percent to 5 percent over the same period.
Asia is the primary sending region of international students in the United States. In the 2014-15 school year, 736,000 students from Asia accounted for 76 percent of all international students enrolled in U.S. higher-education institutions. Mainland China (304,000), India (133,000), South Korea (64,000), Saudi Arabia (60,000), and Canada (27,000) were the top five origin countries of international students, representing 60 percent of the total.
Business and management, engineering, and math and computer science were the most popular fields of study for international students in 2014-15: together, they accounted for more than half (52 percent) of the total.
Undergraduate students accounted for 41 percent (399,000) of international students in 2014-15, followed by graduate students (37 percent or 362,000) and nondegree students (94,000 or 10 percent). Individuals pursuing Optional Practical Training (OPT) accounted for 12 percent (120,000).
OPT is a period during which undergraduate and graduate students with F-1 (foreign student) status who have completed or have been pursuing their degrees for more than nine months are permitted by USCIS to work. All F-1 international students are entitled to a 12-month OPT, and those who studied in qualifying STEM fields are eligible for a 17-month extension. Approximately 43 percent of international students in 2014-15 were eligible for the STEM extension.
Table 4. International Students in the United States by Field of Study, 2014-15
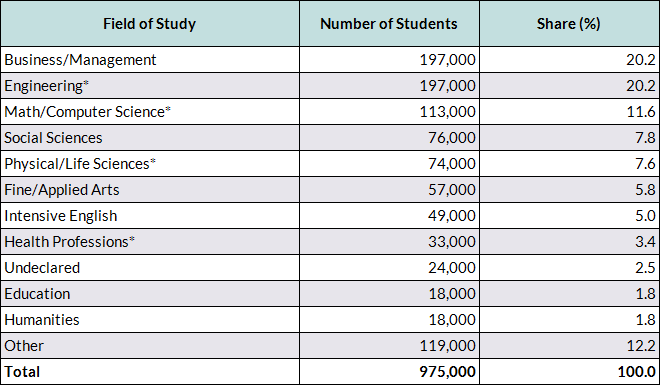
Note: *Subject is considered a science, technology, engineering, or math (STEM) field according to the Institute of International Education (IIE).
Source: MPI tabulation of data from IIE, "International Students by Field of Study, 2013/14 - 2014/15," Open Doors Report on International Educational Exchange (New York: IIE, 2015), available online.
International students account for a higher share of students in U.S. PhD programs than in all higher education programs combined. In 2014, close to one-third (29 percent) of doctorate recipients were temporary visa holders (mostly on F-1 visas), according to the National Science Foundation’s Survey of Doctorate Recipients. While the share of temporary visa holders among doctorate recipients in education and humanities programs was relatively small (10 percent and 13 percent, respectively), they represented roughly half of doctorate recipients in engineering (52 percent) and physical sciences (42 percent). China (including Hong Kong), India, South Korea, Taiwan, and Canada were the top five origin countries of temporary visa holders earning doctorates at U.S. colleges and universities, accounting for 62 percent of foreign PhD students.
H1-B Specialty Occupation Workers
Created under the Immigration Act of 1990, the H-1B Temporary Skilled Worker Program is designed to permit certain highly skilled foreign nationals to enter the United States and work for U.S. companies or organizations. To qualify, the prospective U.S. job must be considered a “specialty occupation,” meaning it requires at least a four-year degree in a specialty field. Common specialty occupations include computer professionals, engineers and scientists, financial analysts, management consultants, university professors, and researchers. It is the most common skill-based employment visa program for college-educated foreign-born individuals in the United States.
Click here to read a spotlight article on the H-1B Temporary Skilled Worker Program.
The annual cap on initial H-1B visas (valid for up to three years) is set at 85,000, including 20,000 H-1B visas specially designated for those holding advanced degrees from U.S. universities. Institutions of higher education, related or affiliated nonprofit entities, and nonprofit or governmental research organizations are exempted from this cap. There is also no cap on H-1B visas issued for continuing employment.
The number of total H-1B petitions (which includes initial and continuing employment) filed and approved has fluctuated over the last 15 years (see Figure 5). Recessions in 2001 and 2008 significantly decreased demand for H-1B workers in the following years. As the economy improved, the number of filed and approved petitions rose.
Figure 5. H-1B Petitions Filed and Approved, 2000-14
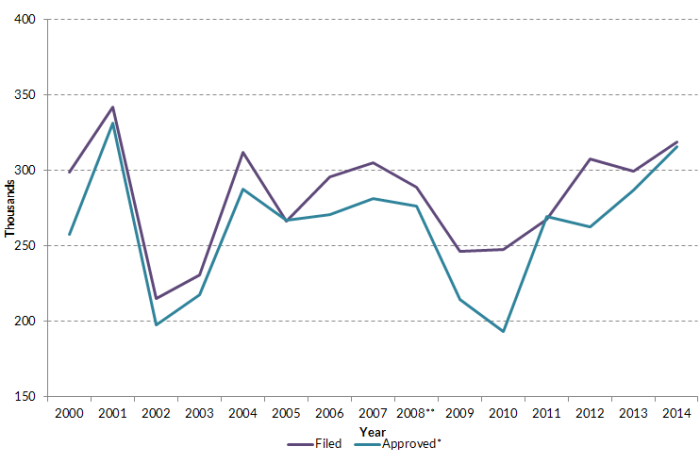
Notes: *Regardless of when filed; ** Excludes about 63,000 petitions submitted but not selected in the computer-generated random lottery in April 2008.
Source: Department of Homeland Security (DHS), Characteristics of Specialty Occupation Workers (H-1B), Washington, DC: DHS, various years.
The H-1B program has been a mainstay of information-technology companies, and the share of computer-related workers among all approved H-1B petitions has increased significantly in recent years, reaching a record high in 2014. Close to two-thirds (65 percent) of approved H-1B petitions (203,425) in fiscal year (FY) 2014 were for workers in computer-related occupations, mainly systems analysts and programmers, compared to roughly half before 2012 (see Figure 6).
Figure 6. Share of Computer-Related Workers among All Approved H-1B Petitions, 2004-14
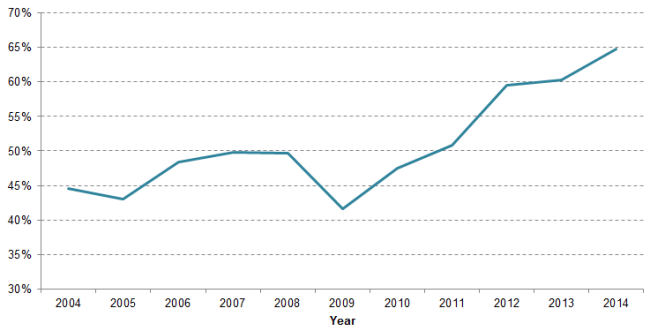
Source: DHS, Characteristics of Specialty Occupation Workers (H-1B).
In FY 2014, 70 percent of H-1B recipients were from India, followed by China, Canada, the Philippines, South Korea, the United Kingdom, Mexico, Taiwan, France, and Japan (see Figure 7). Together these ten countries accounted for 87 percent of the total 315,857 approved petitions.
Figure 7. Top Origin Countries of H-1B Recipients by Share of All Approved Petitions, 2014
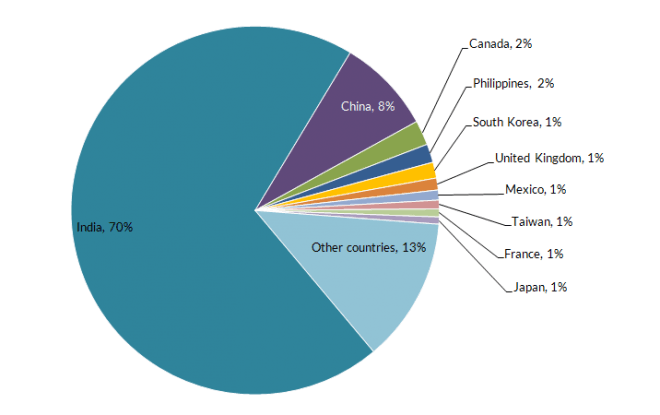
Source: DHS, Characteristics of Specialty Occupation Workers (H-1B), 2014.
Sources
Institute of International Education. 2015. Open Doors Report on International Educational Exchange. New York: IIE. Available Online.
National Science Foundation (NSF) and the National Center for Science and Engineering Statistics (NCSES). 2015. Survey of Earned Doctorates: 2014. Arlington, VA: NSF and NCSES. Available Online.
U.S. Census Bureau. 2015. 2014 American Community Survey. Accessed from Steven Ruggles, Katie Genadek, Ronald Goeken, Josiah Grover, and Matthew Sobek. Integrated Public Use Microdata Series: Version 6.0 [Machine-readable database]. Minneapolis: University of Minnesota, 2015. Available Online.
U.S. Department of Homeland Security (DHS). 2015. Characteristics of H-1B Specialty Occupation Workers: Fiscal Year 2014 Annual Report to Congress. Washington, DC: DHS. Available Online.
---. 2015. Improving and Expanding Training Opportunities for F-1 Nonimmigrant Students with STEM Degrees and Cap-Gap Relief for All Eligible F-1 Students. Federal Register, October 19, 2015. Available Online.