

Cuban Immigrants in the United States

A sign for Calle Ocho in Miami's Little Havana neighborhood. (Photo: iStock.com/bpperry)
Haga clic aquí para leer este artículo en español.
For decades, Cuban immigrants have enjoyed a unique position in U.S. immigration law unlike that offered any other immigrant group. As a legacy of the Cold War and communist Cuba’s strategic location in the Caribbean, those who left Cuba and made it to U.S. soil were typically eligible for a direct and swift path to U.S. legal permanent residence under the Cuban Adjustment Act of 1966. This unique status has waned in recent years as policies have evolved, including 2017 changes to the “wet foot, dry foot” treatment of Cuban arrivals amid efforts to normalize political relations with Cuba. Today, Cubans are treated more on par with prospective immigrants from the rest of the world, though they remain the beneficiaries of some favored-status programs that are in some cases accorded a handful of other nationalities.
There has been a significant increase in the number of Cubans migrating irregularly to the United States since 2020, amounting to the largest such emigration in Cuba’s modern history. In fiscal year (FY) 2022, Cubans were encountered by U.S. authorities at the U.S.-Mexico border nearly 225,000 times and were interdicted at sea more than 6,000 times—numbers that combined far surpass episodes such as the 1980 Mariel boatlift or 1994 Cuban balsero (“rafter”) crisis.
As a result, federal policymakers have advanced policies to open legal pathways, hoping to deter spontaneous border arrivals in favor of managed entries. In January 2023, the Department of Homeland Security (DHS) announced new humanitarian parole processes for qualifying Cubans (as well as for Haitians, Nicaraguans, and Venezuelans), allowing those with U.S.-based supporters and traveling by air to reside in the United States for two years. More than 43,000 Cubans had arrived by late August under this program, which lets up to 30,000 individuals from the four nationalities into the United States monthly, with Mexico accepting an equivalent number who are turned away at the U.S. border. Separately, in January, the U.S. embassy in Havana resumed regular visa and consular services for the first time in five years. And in May 2022, the United States announced the resumption of the Cuban Family Reunification Parole Program, which was established in 2007 but suspended in 2018; the program allows entry into the United States on three-year parole for individuals whose family-based immigrant visa petitions are being processed.
In 2021, the most recent year for which data are available from the U.S. Census Bureau’s American Community Survey (ACS), close to 1.3 million Cuban immigrants resided in the United States, representing 3 percent of all 45.3 million U.S. immigrants. Compared with the overall immigrant and U.S.-born populations, Cubans are less likely to be proficient in English, less likely to hold a college degree, and tend to earn a lower household income. They are also much more likely than the overall immigrant population to be U.S. citizens.
This Spotlight provides information on the Cuban immigrant population in the United States, focusing on its size, geographic distribution, and socioeconomic characteristics.
Click on the bullet points below for more information:
- Size of Immigrant Population over Time
- Distribution by U.S. State and Key Cities
- English Proficiency
- Age, Education, and Employment
- Income and Poverty
- Immigration Pathways and Naturalization
- Health Coverage
- Diaspora
- Top Global Destinations
Size of Immigrant Population over Time
Since 1980, the Cuban immigrant population has more than doubled (see Figure 1). Between 2010 and 2021, it grew faster than the overall immigrant population: 16 percent versus 13 percent. Since 1970, Cubans have been among the top ten national-origin U.S. immigrant groups. As the top origin country from the Caribbean, Cuba accounted for 28 percent of the 4.5 million Caribbean immigrants residing in the United States.
Figure 1. Cuban Immigrant Population in the United States, 1980-2021
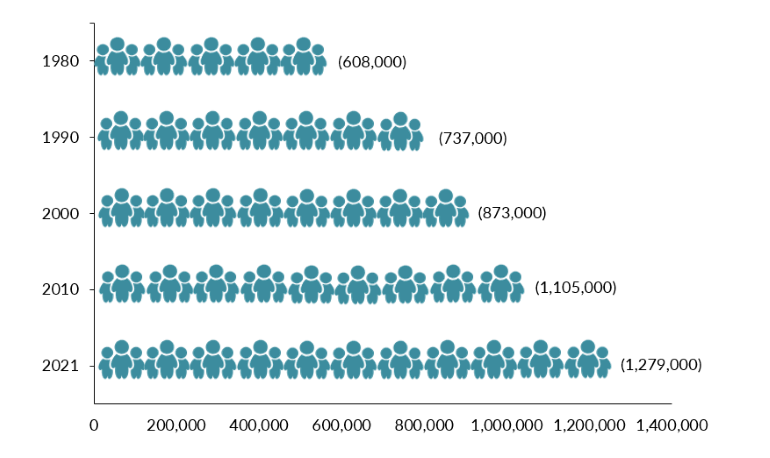
Sources: Data from U.S. Census Bureau 2010 and 2021 American Community Surveys (ACS), and Campbell J. Gibson and Kay Jung, "Historical Census Statistics on the Foreign-Born Population of the United States: 1850-2000" (Working Paper no. 81, U.S. Census Bureau, Washington, DC, February 2006), available online.
Distribution by U.S. State and Key Cities
Most Cuban immigrants were settled in Florida (76 percent), followed distantly by Texas (5 percent) and New Jersey (3 percent) in the 2017-21 period. One county in Florida, Miami-Dade, alone was home to 52 percent of all Cuban immigrants in the United States. The next four counties with the largest number of Cubans—Hillsborough, Broward, Palm Beach, and Lee—are also all in Florida and accounted for another 14 percent combined.
Figure 2. Top States of Residence for Cuban Immigrants in the United States, 2017-21
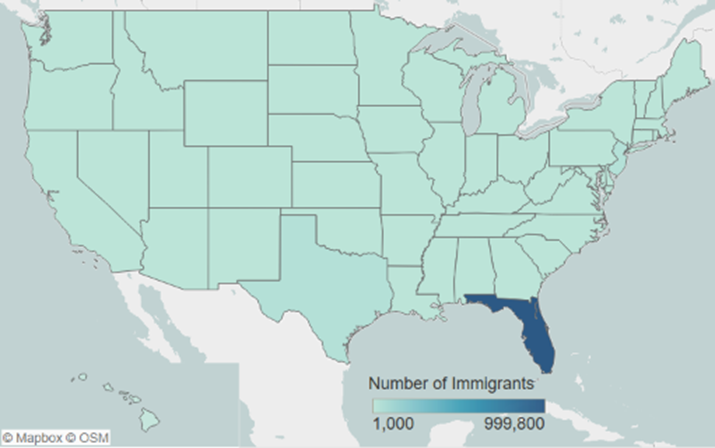
Note: Pooled 2017-21 ACS data were used to get statistically valid estimates at the state level for smaller-population geographies. Not shown is the population in Alaska, which is small in size; for details, visit the Migration Policy Institute (MPI) Migration Data Hub for an interactive map showing geographic distribution of immigrants by state and county, available online.
Source: MPI tabulation of data from U.S. Census Bureau pooled 2017-21 ACS.
Click here for an interactive map that highlights the states and counties with the highest concentrations of immigrants from Cuba and other countries.
Cuban immigrants are also highly concentrated by city. Sixty percent of Cubans in the United States lived in the greater Miami metropolitan area. The Tampa metro area hosted the second-largest population (6 percent), followed by the New York metro area (5 percent). Approximately one in eight residents in the greater Miami area was born in Cuba (see Table 1).
Figure 3. Top Metropolitan Destinations for Cuban Immigrants in the United States, 2017-21
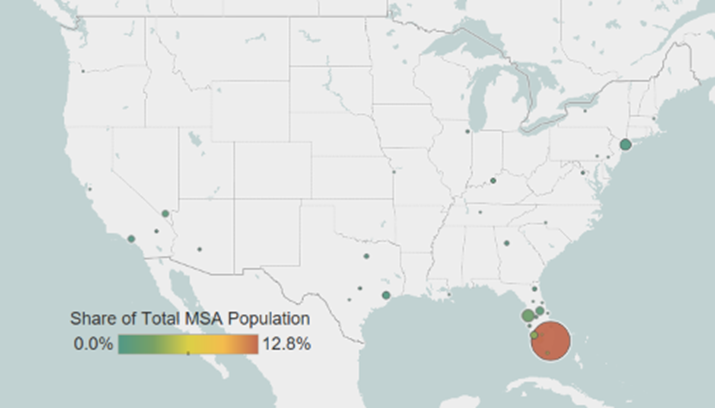
Note: Pooled 2017-21 ACS data were used to get statistically valid estimates at the metropolitan statistical-area level for smaller-population geographies.
Source: MPI tabulation of data from U.S. Census Bureau pooled 2017-21 ACS.
Click here for an interactive map that highlights the metropolitan areas with the most immigrants from Cuba and other countries.
Table 1. Top U.S. Metropolitan Areas for Cuban Immigrants, 2017-21
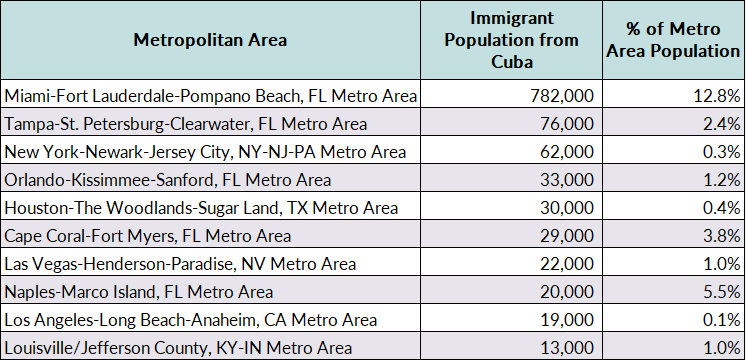
Source: MPI tabulation of data from the U.S. Census Bureau pooled 2017-21 ACS.
Cuban immigrants are much less likely to be proficient in English and speak English at home than the overall foreign-born population. Fifty-nine percent of Cubans ages 5 and over reported speaking English less than “very well” as of 2021, compared to 46 percent of the total foreign-born population. Approximately 6 percent of Cubans in the United States spoke only English at home, compared to 17 percent of all immigrants.
Age, Education, and Employment
Immigrants from Cuba on average are older than other immigrants. In 2021, the median age for Cubans was 55 years old, much higher than that of the U.S. born (37 years) and all immigrants (47 years).
Figure 4. Age Distribution of the U.S. Population by Origin, 2021
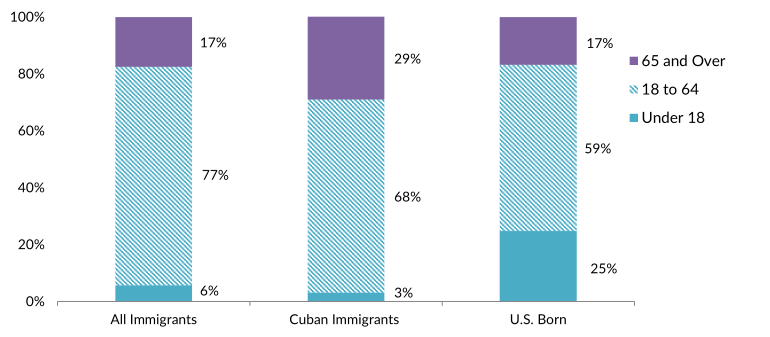
Note: Percentages may not add up to 100 as they are rounded to the nearest whole number.
Source: MPI tabulation of data from the U.S. Census Bureau 2021 ACS.
About 23 percent of Cuban immigrants ages 25 and older had less than a high school diploma as of 2021, versus 26 percent of all foreign-born adults and 7 percent of U.S.-born adults (see Figure 5). At the same time, 24 percent of immigrants from Cuba had at least a bachelor’s degree, about 10 percent points lower than the rate for the total immigrant (34 percent) and U.S.-born (35 percent) adult populations. The share of college graduates was slightly higher among Cubans who arrived between 2017 and 2021: 27 percent. For comparison, 47 percent of all immigrant adults arriving during that same recent five-year period held a college degree.
Click here for data on immigrants’ educational attainment by country of origin and overall.
Figure 5. Educational Attainment of the U.S. Population (ages 25 and older) by Origin, 2021
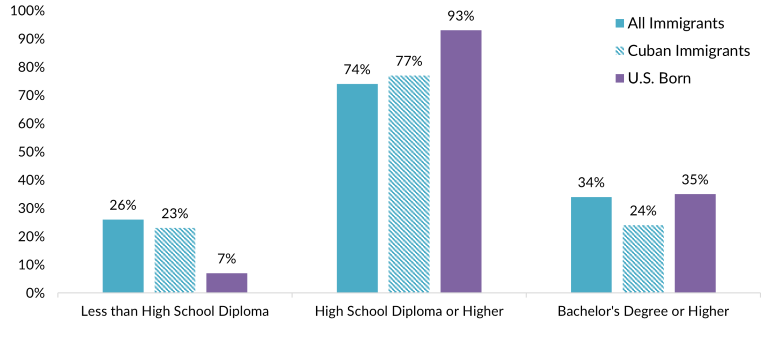
Note: Percentages may not add up to 100 as they are rounded to the nearest whole number.
Source: MPI tabulation of data from the U.S. Census Bureau 2021 ACS.
According to the Institute of International Education, just 114 students from Cuba were enrolled in U.S. colleges and universities in the 2021-22 school year, comprising a tiny share of the overall 949,000 international students in the United States.
In part because they tend to be older, Cuban immigrants are less likely to participate in the labor force. In 2021, 60 percent of Cubans ages 16 and above were engaged in the U.S. civilian labor force versus 66 percent and 62 percent of the overall foreign- and U.S.-born populations, respectively. Close to half of Cubans were in either management, business, science, and arts (29 percent) or production, transportation, and material moving (20 percent) occupations (see Figure 6).
Figure 6. Employed Workers in the Civilian Labor Force (ages 16 and older) by Occupation and Origin, 2021
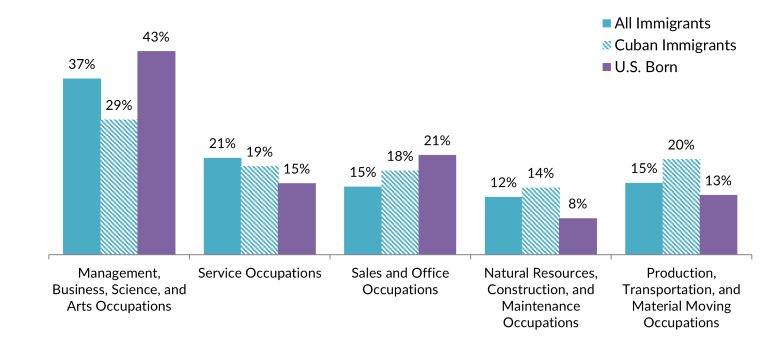
Note: Percentages may not add up to 100 as they are rounded to the nearest whole number.
Source: MPI tabulation of data from the U.S. Census Bureau 2021 ACS.
Households headed by a Cuban immigrant had a median income of $52,000 in 2021, lower than that of all immigrants and the U.S. born (approximately $70,000 for each). Sixteen percent of Cubans lived in poverty (defined as having an income of $27,500 for a family of four with two children in 2021), slightly higher than all immigrants (14 percent) and the U.S. born (13 percent).
Immigration Pathways and Naturalization
Cubans are particularly likely to be naturalized U.S. citizens, which may be explained by the Cuban Adjustment Act of 1966, which puts Cubans on a much faster path to citizenship. In 2021, 66 percent of Cuban immigrants in the United States were naturalized citizens, compared to 53 percent of the total foreign-born population. Nearly half of all Cuban immigrants arrived in the United States prior to 2000, and they are slightly more likely than the overall immigrant population to have entered the country since 2010 (see Figure 7).
Figure 7. Immigrants from Cuba and All Immigrants in the United States by Period of Arrival, 2021
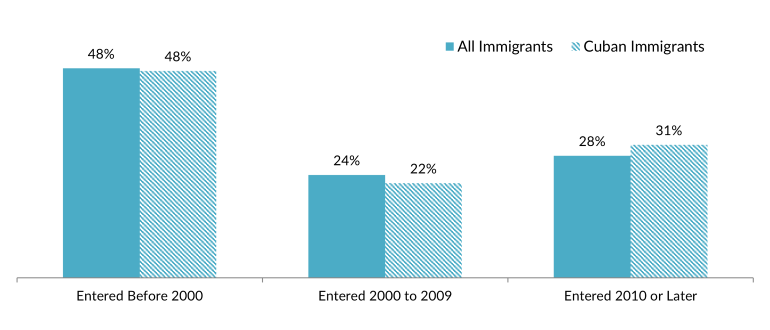
Note: Percentages may not add up to 100 as they are rounded to the nearest whole number.
Source: MPI tabulation of data from the U.S. Census Bureau 2021 ACS.
As a result of Cubans’ special treatment under the Cuban Adjustment Act, most who have obtained U.S. legal permanent residence (also known as getting a green card) have done so through the humanitarian protection channel. In FY 2022, 40 percent of the 36,600 Cuban nationals who became lawful permanent residents (LPRs) adjusted through a humanitarian pathway, compared to 8 percent of all new green-card holders.
Today, Cubans are just as likely as the total LPR population to obtain green cards through family reunification (58 percent). Virtually no Cubans obtained their green cards through employment sponsorship (just 38 people in FY 2022).
Figure 8. Immigration Pathways of Cuban and All Lawful Permanent Residents in the United States, 2022
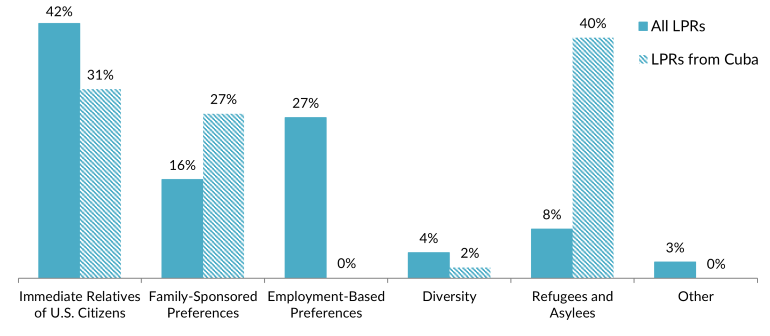
Notes: Immediate Relatives of U.S. Citizens: Includes spouses, minor children, and parents of U.S. citizens. Family-Sponsored Preferences: Includes adult children and siblings of U.S. citizens as well as spouses and children of green-card holders. The Diversity Visa lottery was established by the Immigration Act of 1990 to allow entry to immigrants from countries with low rates of immigration to the United States. The law states that 55,000 diversity visas in total are made available each fiscal year. Individuals born in Cuba were eligible for the 2024 lottery. Percentages may not add up to 100 as they are rounded to the nearest whole number.
Source: MPI tabulation of data from Department of Homeland Security (DHS), “Table 10D: Persons Obtaining Lawful Permanent Resident Status by Broad Class of Admission and Region and Country of Birth: Fiscal Year 2022,” updated August 21, 2023, available online.
Approximately 52 percent of Cuban immigrants had private health insurance coverage and 40 percent had public coverage as of 2021. Cuban immigrants were less likely than all immigrants to lack health insurance (16 percent compared to 19 percent; see Figure 9).
Figure 9. Health Coverage for Cuban Immigrants, All Immigrants, and the U.S. Born, 2021
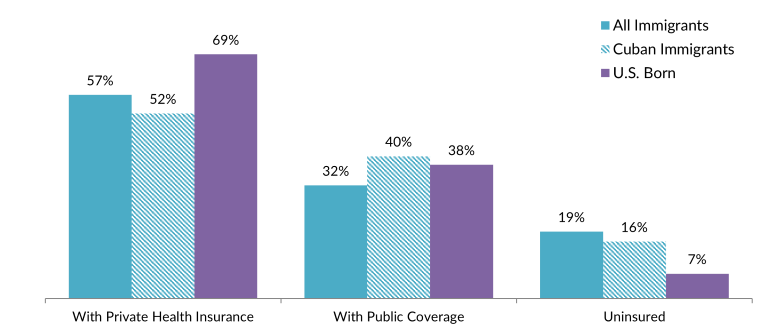
Note: The sum of shares by type of insurance is likely to be greater than 100 because people may have more than one type of insurance.
Source: MPI tabulation of data from the U.S. Census Bureau 2021 ACS.
The Cuban diaspora is comprised of approximately 2.7 million U.S. residents who were either born in Cuba or reported Cuban ancestry, according to Migration Policy Institute (MPI) tabulation of data from the U.S. Census Bureau’s 2021 ACS. People born in the United States accounted for 1.4 million (52 percent) of the U.S.-based Cuban diaspora.
Click here to see estimates of the top 35 diasporas groups in the United States in 2021.
Worldwide, the United States was the top destination for Cubans living abroad, followed by Spain (162,000), as of the most recent, mid-2020 United Nations Population Division estimates. Other top destinations included Italy (39,000), Chile (24,000), and Canada (19,000).
Click here to view an interactive map showing where migrants from Cuba and other countries have settled worldwide.
Sources
Duany, Jorge. 2017. Cuban Migration: A Postrevolution Exodus Ebbs and Flows. Migration Information Source, July 6, 2017. Available online.
Gibson, Campbell J. and Kay Jung. 2006. Historical Census Statistics on the Foreign-Born Population of the United States: 1850-2000. Working Paper no. 81, U.S. Census Bureau, Washington, DC, February 2006. Available online.
Institute of International Education (IIE). N.d. International Students: All Places of Origin. Accessed August 5, 2023. Available online.
Migration Policy Institute (MPI), Migration Data Hub. N.d. Countries of Birth for U.S. Immigrants, 1960-Present. Accessed May 11, 2023. Available online.
---. N.d. Top Diaspora Groups in the United States, 2021. Accessed May 11, 2023. Available online.
Montoya-Galvez, Camilo. 2023. Biden Policy That Has Allowed 200,000 Migrants to Enter the U.S. in 10 Months Faces Key Legal Test. CBS News, August 24, 2023. Available online.
Ruiz Soto, Ariel G. 2022. Record-Breaking Migrant Encounters at the U.S.-Mexico Border Overlook the Bigger Story. Migration Policy Institute (MPI) commentary, October 2022. Available online.
Sesin, Carmen. 2022. Historic Wave of Cuban Migrants Will Have a Lasting Impact on Florida. NBC News, December 16, 2022. Available online.
UN Population Division. N.d. International Migrant Stock by Destination and Origin. Accessed August 5, 2023. Available online.
U.S. Census Bureau. 2022. 2021 American Community Survey. Access from Steven Ruggles, Katie Genadek, Ronald Goeken, Josiah Grover, and Matthew Sobek. Integrated Public Use Microdata Series: Version 7.0 [dataset]. Minneapolis: University of Minnesota. Available online.
---. N.d. 2021 American Community Survey—Advanced Search. Accessed August 10, 2023. Available online.
U.S. Coast Guard. 2023. Coast Guard Repatriates 28 People to Cuba. Press release, April 13, 2023. Available online.
U.S. Department of Homeland Security (DHS). 2023. Fact Sheet: Data from First Six Months of Parole Processes for Cubans, Haitians, Nicaraguans, and Venezuelans Shows That Lawful Pathways Work. Press release, July 25, 2023. Available online.
U.S. Department of Homeland Security, Office of Immigration Statistics. 2023. Yearbook of Immigration Statistics 2022. Updated August 21, 2023. Available online.
Wasem, Ruth Ellen. 2009. Cuban Migration to the United States: Policy and Trends. Washington, DC: Congressional Research Service. Available online.