

Cuban Immigrants in the United States

An attendee waves a Cuban flag at the reopening ceremony of the Cuban Embassy in Washington, DC, in July 2015. (Photo: Elvert Barnes)
For decades, immigrants from Cuba have held a uniquely preferential position in U.S. immigration law, owing to Cold War-era tensions between the two rivals. Cubans have been among the top ten immigrant populations in the United States since 1970, and in 2016 were the seventh largest group. Nearly 1.3 million Cubans lived in the United States in 2016, accounting for roughly 3 percent of the approximately 44 million immigrants overall.
Large-scale migration from Cuba began following the Cuban Revolution in 1959, when Fidel Castro led a communist takeover of the island and ouster of the Fulgencio Batista regime. The Cuban population in the United States grew almost six-fold within a decade, from 79,000 in 1960 to 439,000 in 1970.
From the 1960s onward, most Cubans who arrived on U.S. soil were admitted or paroled in through special humanitarian provisions—citing communist oppression on the island—rather than via traditional immigration pathways required for other immigrant groups. In 1966, Congress passed the Cuban Adjustment Act (CAA), which allows Cubans to become lawful permanent residents (LPRs, also known as green-card holders) after being physically present in the United States for at least one year. Though the communist government generally limited emigration, on several major occasions it allowed people to leave for the United States without authorization, partly as an escape valve for dissidence and excess labor. The largest was the Mariel boatlift of 1980, which brought roughly 124,800 Cubans to Florida by boat.
Figure 1. Cuban Immigrant Population in the United States, 1980-2016
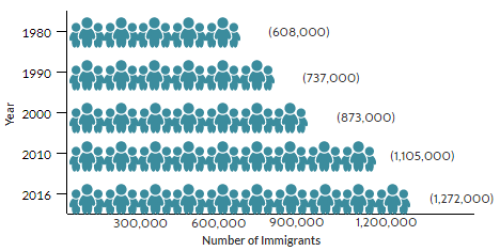
Sources: Data from U.S. Census Bureau 2006, 2010, and 2016 American Community Surveys (ACS), and Campbell J. Gibson and Kay Jung, "Historical Census Statistics on the Foreign-born Population of the United States: 1850-2000" (Working Paper no. 81, U.S. Census Bureau, Washington, DC, February 2006), available online.
By the mid-1990s, rising spontaneous boat migration had prompted the two governments to negotiate new migration terms. The resulting 1995 accords established the “wet-foot, dry-foot” policy: Unless citing fears of persecution, Cubans intercepted at sea would be returned to Cuba, where the government agreed not retaliate against them. Meanwhile, those who reached the United States, whether by land or sea, would be permitted to stay. Cuban arrivals subsequently surged, with some 650,000 admitted to the United States between 1995 and 2015.
The historic 2014 decision by U.S. President Barack Obama and Cuban President Raúl Castro to normalize relations opened a new era for Cuban migration. Anticipating an end to their special immigration treatment, Cuban arrivals more than doubled from fewer than 24,300 in fiscal year (FY) 2014 to 56,400 in FY 2016. During the final days of his presidency in January 2017, President Obama ended the “dry-foot” aspect of the policy, which had resulted in thousands of Cubans making their way through Central America and Mexico to reach the U.S. border. Since then, Cubans who have attempted to enter the United States without a visa have been deemed inadmissible and subject to deportation like other foreign nationals. However, those who enter on a visa remain eligible for a green card after one year in the country.
The United States is home to the largest number of Cubans abroad. Other popular destinations include Spain (125,000), Italy (33,000), Mexico (18,000), Germany and Canada (15,000 each), and Puerto Rico (13,000), according to mid-2015 estimates by the United Nations Population Division.
Click here to view an interactive map showing where migrants from Cuba and other countries have settled worldwide.
Compared to the overall foreign- and U.S.-born populations, Cubans were less likely to be proficient in English, had lower educational attainment, and earned lower household incomes. Using data from the U.S. Census Bureau (the most recent 2016 American Community Survey [ACS] as well as pooled 2011-15 ACS data) and the Department of Homeland Security’s Yearbook of Immigration Statistics, this Spotlight provides information on the Cuban immigrant population in the United States, focusing on its size, geographic distribution, and socioeconomic characteristics.
Click on the bullet points below for more information:
- Distribution by State and Key Cities
- English Proficiency
- Age, Education, and Employment
- Income and Poverty
- Immigration Pathways and Naturalization
- Health Coverage
- Diaspora
Distribution by State and Key Cities
Within the United States, the Cuban population is very highly concentrated, with 78 percent living in Florida in 2011-15. The next two top states of residency were New Jersey and California, accounting for just 4 percent and 3 percent of Cuban immigrants, respectively.
Similarly, the top four counties by concentration were all in Florida: Miami-Dade, Broward, Hillsborough, and Palm Beach. Together, these counties accounted for about 68 percent of all Cuban immigrants in the United States.
Figure 2. Top States of Residence for Cuban Immigrants in the United States, 2011-15
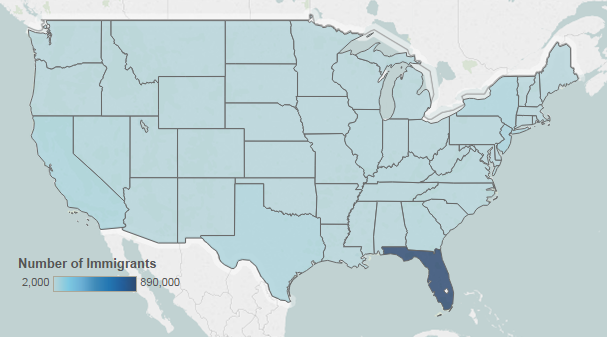
Note: Pooled 2011-15 ACS data were used to get statistically valid estimates at the state level for smaller-population geographies. Not shown are populations in Alaska and Hawaii, which are small in size; for details, visit the Migration Policy Institute (MPI) Data Hub for an interactive map showing geographic distribution of immigrants by state and county, available online.
Source: MPI tabulation of data from U.S. Census Bureau pooled 2011-15 ACS.
Cuban immigrants are also highly concentrated by city: In the 2011-15 period, 64 percent lived in the greater Miami metropolitan area. The New York metro area came in second, with 6 percent.
Figure 3. Top Metropolitan Areas of Residence for Cuban Immigrants in the United States, 2011-15
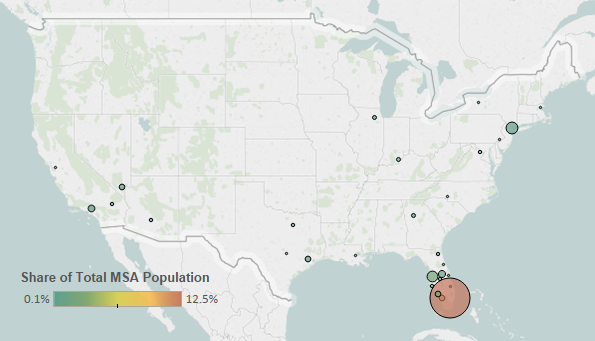
Note: Pooled 2011-15 ACS data were used to get statistically valid estimates at the metropolitan statistical-area level for smaller-population geographies.
Source: MPI tabulation of data from U.S. Census Bureau pooled 2011-15 ACS.
Table 1. Top Concentrations by Metropolitan Area for Cuban Immigrants, 2011-15
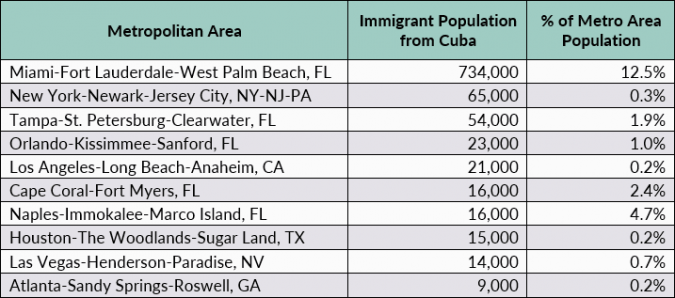
Source: MPI tabulation of data from the U.S. Census Bureau pooled 2011-15 ACS.
Click here for an interactive map that highlights the metropolitan areas with the highest concentrations of immigrants. Select Cuba from the dropdown menu.
Cuban immigrants were much less likely to be proficient in English and speak English at home than the overall foreign-born population. In 2016, about 64 percent of Cubans ages 5 and over reported limited English proficiency, compared to 49 percent of the total foreign-born population. Approximately 5 percent of Cubans spoke only English at home, versus 16 percent of all immigrants.
Note: Limited English proficiency refers to those who indicated on the ACS questionnaire that they spoke English less than “very well.”
Age, Education, and Employment
In 2016, Cubans had a much higher median age than that of the overall foreign- and U.S.-born populations: Fifty-three years, compared to 44 years and 36 years, respectively. This is due in large part to the disproportionately high number of Cuban seniors. Twenty-eight percent of Cubans were 65 or older, versus 15 percent of both the overall foreign- and native-born populations. Meanwhile, Cuban immigrants were more likely than the native born but less likely than the overall foreign born to be of working age (18 to 64; see Figure 4).
Figure 4. Age Distribution of the U.S. Population by Origin, 2016

Note: Numbers may not add up to 100 as they are rounded to the nearest whole number.
Source: MPI tabulation of data from the U.S. Census Bureau, 2016 ACS. Click here to view an interactive chart showing the age and sex distribution of top immigrant groups, including the Cuban born.
Overall, Cubans have lower levels of educational attainment compared to the total foreign- and U.S.-born populations. In 2016, 22 percent of Cuban adults ages 25 and over had a bachelor’s degree or higher, compared to 30 percent of the overall immigrant population and 32 percent of the native-born population.
Cuban immigrants participated in the labor force at a lower rate than the total foreign- and U.S.-born populations, owing in part to the higher share of elderly Cubans. In 2016, about 58 percent of Cubans ages 16 and over were in the civilian labor force, compared to 66 percent and 62 percent of all immigrants and the native born, respectively. Compared to immigrants overall, Cubans were more likely to be employed in sales and office jobs as well as production, transportation, and material moving occupations (see Figure 5).
Figure 5. Employed Workers in the Civilian Labor Force (ages 16 and older) by Occupation and Origin, 2016
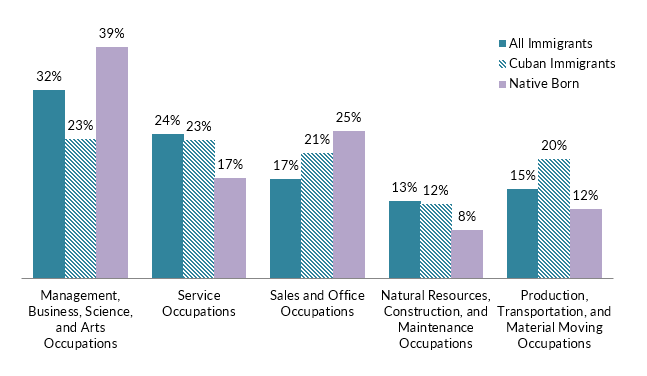
Source: MPI tabulation of data from the U.S. Census Bureau 2016 ACS.
Cuban immigrants had significantly lower incomes compared to the total foreign- and native-born populations. In 2016, households headed by a Cuban immigrant had a median income of $39,000, compared to $54,000 and $58,000 for all immigrant and native-born households, respectively.
In 2016, Cuban families were living in poverty at the same rate as immigrant families overall, about 15 percent each. In contrast, roughly 9 percent of families with a U.S.-born head of household lived in poverty.
Immigration Pathways and Naturalization
Cubans were more likely to be naturalized U.S. citizens than immigrants overall. In 2016, 58 percent of Cuban immigrants were naturalized citizens, compared to 49 percent of the total foreign-born population. The Cuban Adjustment Act placed Cubans on a faster path to citizenship than other immigrant groups, who typically have to spend five years as legal permanent residents before being eligible to naturalize.
The largest share of Cubans, approximately 53 percent, arrived prior to 2000, followed by 25 percent who arrived between 2000 and 2009, and 23 percent in 2010 or later. Compared to all immigrants, Cubans were slightly more likely to have arrived since 2010 (see Figure 6).
Figure 6. Immigrants from Cuba and All Immigrants in the United States by Period of Arrival, 2016
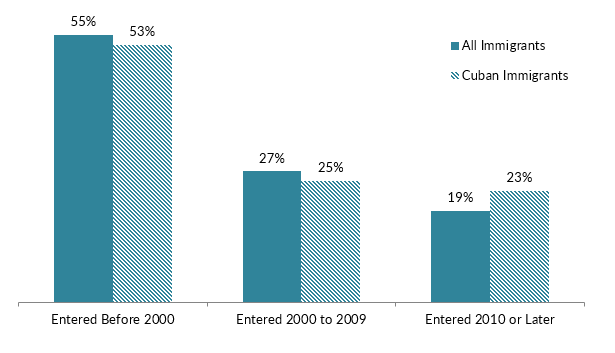
Note: Numbers may not add up to 100 as they are rounded to the nearest whole number.
Source: MPI tabulation of data from the U.S. Census Bureau 2016 ACS.
As a result of Cubans’ special treatment in U.S. immigration law, the majority of Cuban immigrants who obtain green cards do so through the humanitarian protection channel. In FY 2015, 88 percent of the roughly 54,400 Cuban individuals who became lawful permanent residents (LPRs) that year did so via the refugee category, compared to just 14 percent of all new LPRs. New Cuban green-card holders were much less likely than new LPRs overall to obtain green cards as immediate relatives of U.S. citizens (7 percent versus 44 percent), or through family-sponsored channels (4 percent versus 20 percent).
Figure 7. Immigration Pathways of Cuban Immigrants and All Immigrants in the United States, 2015
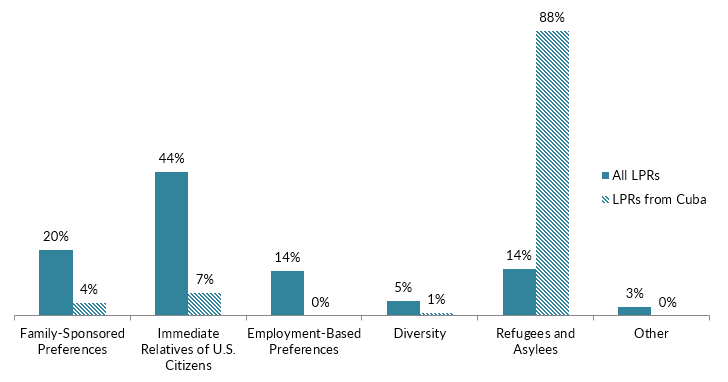
Notes: Family-sponsored: Includes adult children and siblings of U.S. citizens as well as spouses and children of green-card holders. Immediate relatives of U.S. citizens: Includes spouses, minor children, and parents of U.S. citizens. Diversity Visa Lottery: The Immigration Act of 1990 established the Diversity Visa Lottery to allow entry to immigrants from countries with low rates of immigration to the United States. The law states that 55,000 diversity visas in total are made available each fiscal year. Individuals born in Cuba are eligible for the lottery.
Source: MPI tabulation of data from Department of Homeland Security (DHS), 2015 Yearbook of Immigration Statistics (Washington, DC: DHS Office of Immigration Statistics, 2016), available online.
Cubans were slightly less likely to be uninsured in 2016 than the immigrant population overall (17 percent compared to 20 percent). Meanwhile, just 7 percent of the native-born population lacked insurance. Compared to immigrants overall, Cubans were more likely to be covered by public health insurance but much less likely to have private coverage than the foreign- and U.S.-born populations (see Figure 8).
Figure 8. Health Coverage for Cuban Immigrants, All Immigrants, and the Native Born, 2016
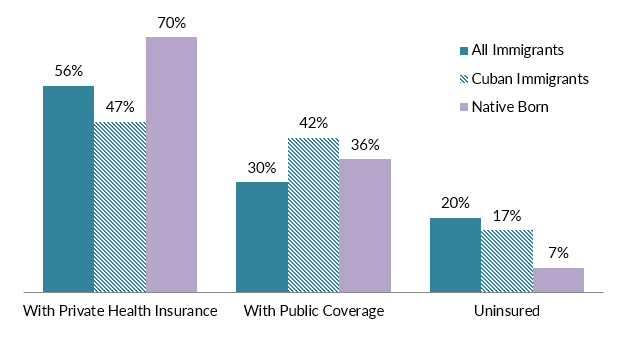
Note: The sum of shares by type of insurance is likely to be greater than 100 because people may have more than one type of insurance.
Source: MPI tabulation of data from the U.S. Census Bureau, 2016 ACS.
The Cuban diaspora in the United States is comprised of nearly 2.5 million individuals who were either born in Cuba or reported Cuban ancestry or race, according to tabulations from the U.S. Census Bureau’s 2016 ACS.
Sources
Duany, Jorge. 2017. Cuban Migration: A Postrevolution Exodus Ebbs and Flows. Migration Information Source, July 6, 2017. Available online.
Gibson, Campbell J. and Kay Jung. 2006. Historical Census Statistics on the Foreign-born Population of the United States: 1850-2000. Working Paper no. 81, U.S. Census Bureau, Washington, DC, February 2006. Available online.
Krogstad, Jens Manuel. 2017. Surge in Cuban Immigration to U.S. Continued through 2016. Pew Research Center Fact Tank, January 13, 2017. Available online.
U.S. Census Bureau. N.d. 2016 American Community Survey (ACS). American FactFinder. Accessed November 3, 2017. Available online.
U.S. Department of Homeland Security (DHS) Office of Immigration Statistics. 2016. 2015 Yearbook of Immigration Statistics. Washington, DC: DHS Office of Immigration Statistics. Available online.
Wasem, Ruth Ellen. 2009. Cuban Migration to the United States: Policy and Trends. Washington, DC: Congressional Research Service. Available online.