

Cuban Immigrants in the United States

People celebrating a Cuban Day Parade in Union City, New Jersey. (Photo: Luigi Novi)
Over the last decade, U.S. policy on Cuban immigration has reversed itself in dramatic fashion. Cuban immigrants have enjoyed preferential treatment in the United States since the 1960s, and been given a direct and swift path to legal permanent residence. But as Cold War-era tensions between the two countries lessened and normalization of relations began in 2014 under President Obama, Cubans began traveling through Central America and arriving at the U.S. border in greater numbers, fearful that the unique status they have long enjoyed would cease. As a result, shortly before leaving office, Obama ended one part of the “wet-foot, dry-foot” policy that began in the mid-1990s, under which Cubans arriving at a U.S. land port without a visa would be admitted or paroled into the country. Following this change, Cuban migrants arriving at the U.S. border without prior authorization have been removed on par with other foreign nationals, with their deportations rising seven-fold from fiscal year (FY) 2017 to FY 2018.
Historically, Cubans have been among the top ten immigrant groups in the United States since 1970, and in FY 2018 were the seventh largest group, with more than 1.3 million Cubans accounting for roughly 3 percent of the overall immigrant population of 44.7 million. The United States is the top destination for Cuban immigrants, followed by Spain (141,400), Italy (37,300), Canada (19,000), Germany (13,400), and Mexico (12,900), according to mid-2019 United Nations Population Division estimates. Puerto Rico is also a top destination, with 13,600 Cubans.
Given the shift in policies towards Cubans and recent overall immigration policy changes by the Trump administration, Cuban flows to the United States increased at a slower rate in 2018—growing 2 percent from 2017 to 2018, down from 3 percent the previous year. Despite a 2016 surge in Cuban arrivals, which came in anticipation of the end to preferential treatment, the rate of growth of the U.S. Cuban population has slowed overall in the last decade. (See Figure 1.)
Figure 1. Cuban Immigrant Population in the United States, 1980-2018
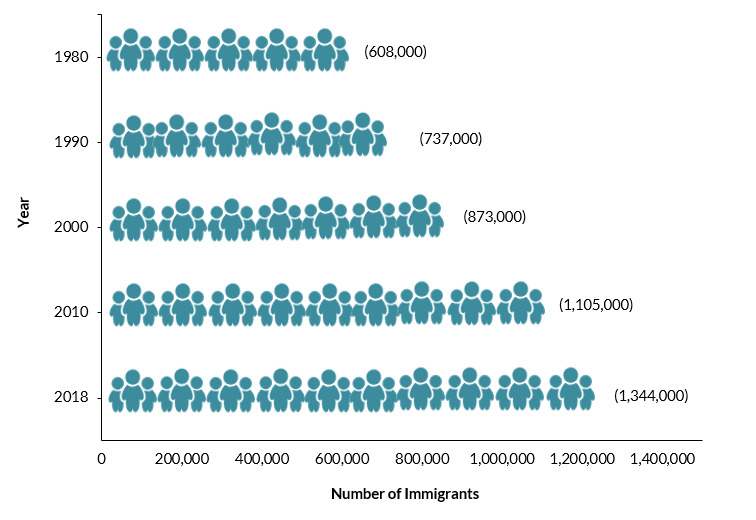
Sources: Data from U.S. Census Bureau 2010 and 2018 American Community Surveys (ACS), and Campbell J. Gibson and Kay Jung, "Historical Census Statistics on the Foreign-born Population of the United States: 1850-2000" (Working Paper no. 81, U.S. Census Bureau, Washington, DC, February 2006), available online.
Cubans began arriving in the United States in large numbers after the 1959 communist revolution led by Fidel Castro. At first, the elite class arrived as political refugees and supporters of the U.S.-backed regime that Castro’s revolution had ousted. The flows then grew to include middle- and lower-class Cubans as the revolution radicalized. In 1966, Congress passed the Cuban Adjustment Act, which allows Cubans to become lawful permanent residents (LPRs, also known as green-card holders) after being physically present in the United States for at least one year. The Cuban population in the United States grew almost six-fold within a decade, from 79,000 in 1960 to 439,000 in 1970.
Although Cuba limited emigration of its residents, three events after the 1959 revolution allowed Cubans to exit the island for the United States. The 1980 Mariel boatlift brought nearly 125,000 Cubans to Florida. Continued migration by sea to the United States led to the 1995 establishment of the wet-foot, dry-foot policy, which allowed any Cuban arriving by land or sea to remain in the United States legally. Despite recently resumed sanctions against Cuba and increased deportations of Cuban nationals, the Cuban Adjustment Act remains in effect today.
Compared to the overall foreign- and U.S.-born populations, Cuban immigrants are less likely to be proficient in English, have lower educational attainment, and earn lower household incomes. Using data from the U.S. Census Bureau (the most recent 2018 American Community Survey [ACS] as well as pooled 2014-18 ACS data) and the Department of Homeland Security’s Yearbook of Immigration Statistics, this Spotlight provides information on the Cuban immigrant population in the United States, focusing on its size, geographic distribution, and socioeconomic characteristics.
Click on the bullet points below for more information:
- Distribution by State and Key Cities
- English Proficiency
- Age, Education, and Employment
- Income and Poverty
- Immigration Pathways and Naturalization
- Health Coverage
- Diaspora
Distribution by State and Key Cities
Within the United States, the Cuban population is very highly concentrated, with 77 percent living in Florida during the period 2014-18. The next three top states of residency were Texas and New Jersey (each containing 4 percent of the population) and California (3 percent).
The top four counties by concentration were all in Florida: Miami-Dade, Broward, Hillsborough, and Palm Beach. Together, these counties were home to about 67 percent of all Cuban immigrants in the United States.
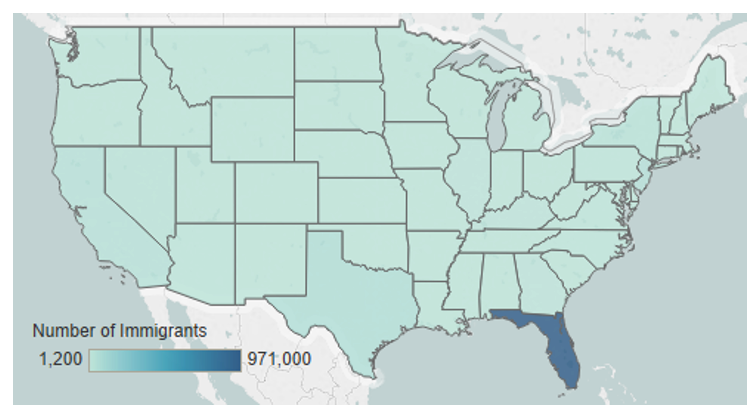
Note: Pooled 2014-18 ACS data were used to get statistically valid estimates at the state level for smaller-population geographies. Not shown are populations in Alaska and Hawaii, which are small in size; for details, visit the Migration Policy Institute (MPI) Data Hub for an interactive map showing geographic distribution of immigrants by state and county, available online.
Source: MPI tabulation of data from U.S. Census Bureau pooled 2014-18 ACS.
Cuban immigrants are also highly concentrated by city. In the 2014-18 period, 63 percent of Cubans in the United States lived in the greater Miami metropolitan area. The Tampa metro area hosted the second-largest population and the greater New York metro area was a close third, with about 5 percent of all Cuban immigrants living in each area.

Note: Pooled 2014-18 ACS data were used to get statistically valid estimates at the metropolitan statistical-area level for smaller-population geographies.
Source: MPI tabulation of data from U.S. Census Bureau pooled 2014-18 ACS.
Table 1. Top Concentrations by Metropolitan Area for Cuban Immigrants, 2014-18
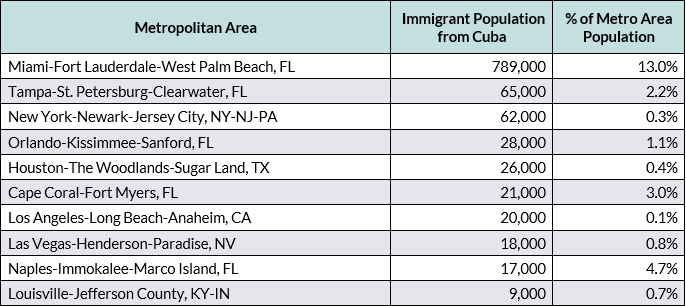
Source: MPI tabulation of data from the U.S. Census Bureau pooled 2014-18 ACS.
Click here for an interactive map that highlights the metropolitan areas with the highest concentrations of immigrants. Select Cuba from the dropdown menu.
Cuban immigrants are much less likely to be proficient in English and speak English at home than the overall foreign-born population. In FY 2018, about 61 percent of Cubans ages 5 and over reported limited English proficiency, compared to 47 percent of the total foreign-born population. Approximately 7 percent of Cubans in the United States spoke only English at home, compared to 17 percent of all immigrants.
Note: Limited English proficiency refers to those who indicated on the ACS questionnaire that they spoke English less than “very well.”
Age, Education, and Employment
In FY 2018, the median age of Cuban immigrants was 53, much higher than that of the overall foreign- and U.S.-born populations, at 45 and 36, respectively. In large part, this is a result of the disproportionately high number of Cuban seniors. Twenty-seven percent of Cubans were 65 or older, whereas this age group accounted for just 16 percent of the overall foreign- and native-born populations. Meanwhile, Cuban immigrants are more likely than the native born but less likely than the overall foreign-born population to be of working age (ages 18 to 64; see Figure 4).
Figure 4. Age Distribution of the U.S. Population by Origin, 2018
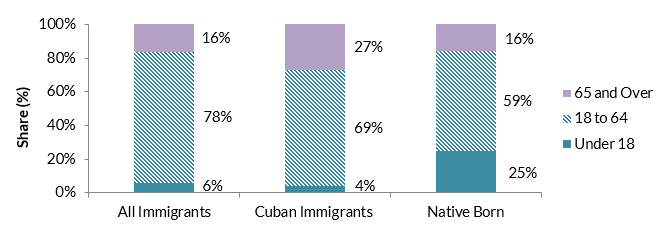
Note: Numbers may not add up to 100 as they are rounded to the nearest whole number.
Source: MPI tabulation of data from the U.S. Census Bureau, 2018 ACS.
Overall, Cuban immigrants have lower levels of educational attainment compared to the total foreign- and U.S.-born populations. In FY 2018, 54 percent of Cuban adults ages 25 and older had no more than a high school diploma (or equivalent) compared to 49 percent of all immigrants and 36 percent of all native-born adults. Twenty-four percent of Cubans had a bachelor’s degree or higher, compared to 32 percent and 33 percent for the overall immigrant and native-born adult populations, respectively.
Prior to the job dislocation caused by the COVID-19 pandemic, Cuban immigrants participated in the labor force at a lower rate than the total foreign- and U.S.-born populations, owing in part to the higher share of elderly Cubans. In 2018, about 60 percent of Cubans ages 16 and over were in the civilian labor force, compared to 66 percent and 62 percent of all immigrants and the native born, respectively. Compared to immigrants overall, Cubans were less likely to be employed in management, business, science, and arts occupations (see Figure 5).
Figure 5. Employed Workers in the Civilian Labor Force (ages 16 and older) by Occupation and Origin, 2018

Source: MPI tabulation of data from the U.S. Census Bureau 2018 ACS.
Cuban immigrants overall have significantly lower incomes than both the overall immigrant and native-born populations. Households headed by a Cuban immigrant had a median income of $46,000 in 2018, while all immigrant households had a median income of $60,000 and native households had a median income of $62,000.
In 2018, Cuban families were living in poverty at the same rate as immigrant families overall, at 13 percent, compared to 8 percent of families with a U.S.-born head of household.
Immigration Pathways and Naturalization
Cubans were more likely than the overall immigrant population to be naturalized U.S. citizens. In FY 2018, 59 percent of the approximately 1.3 million Cuban immigrants in the United States were naturalized citizens, compared to 51 percent of the total foreign-born population. This comparatively high rate of citizenship may be explained by the Cuban Adjustment Act, which puts Cubans on a much faster path to citizenship.
Half of all Cuban immigrants arrived in the United States prior to 2000, and they are slightly more likely than the overall immigrant population to have entered the country since 2010 (see Figure 6).
Figure 6. Immigrants from Cuba and All Immigrants in the United States by Period of Arrival, 2018
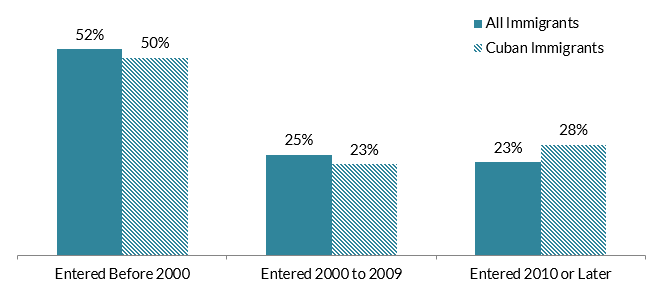
Note: Numbers may not add up to 100 as they are rounded to the nearest whole number.
Source: MPI tabulation of data from the U.S. Census Bureau 2018 ACS.
As a result of Cubans’ special treatment under U.S. law, most Cuban immigrants who have obtained green cards have done so through the humanitarian protection channel. In FY 2018, 91 percent of the 76,500 Cuban nationals who became LPRs adjusted from the refugee status, compared to 17 percent of all new LPRs. New Cuban green-card holders were much less likely to obtain green cards as immediate relatives of U.S. citizens (4 percent versus 44 percent of all new LPRs) or through family-sponsored channels (4 percent versus 20 percent).
Figure 7. Immigration Pathways of Cuban Immigrants and All Immigrants in the United States, 2018

Notes: Family-sponsored: Includes adult children and siblings of U.S. citizens as well as spouses and children of green-card holders. Immediate relatives of U.S. citizens: Includes spouses, minor children, and parents of U.S. citizens. Diversity Visa Lottery: The Immigration Act of 1990 established the Diversity Visa Lottery to allow entry to immigrants from countries with low rates of immigration to the United States. The law states that 55,000 diversity visas in total are made available each fiscal year. Individuals born in Cuba are eligible for the lottery.
Source: MPI tabulation of data from Department of Homeland Security (DHS), 2018 Yearbook of Immigration Statistics (Washington, DC: DHS Office of Immigration Statistics, 2019), available online.
Cuban immigrants were slightly less likely to be uninsured in 2018 than the immigrant population overall (18 percent versus 20 percent). In contrast, only 7 percent of U.S. natives had no health insurance. Cubans were more likely than the overall immigrant population to be covered by public health insurance and less likely to have private coverage than both the foreign- and U.S.-born populations (see Figure 8).
Figure 8. Health Coverage for Cuban Immigrants, All Immigrants, and the Native Born, 2018
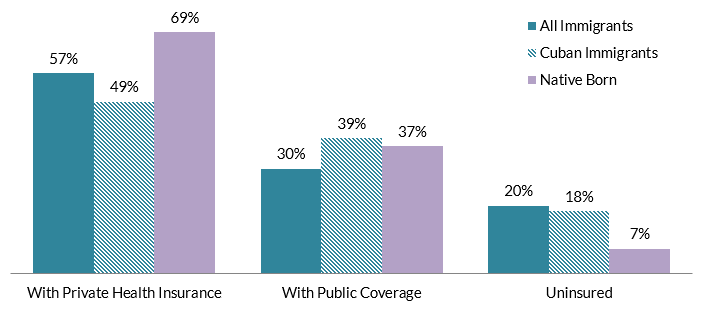
Note: The sum of shares by type of insurance is likely to be greater than 100 because people may have more than one type of insurance.
Source: MPI tabulation of data from the U.S. Census Bureau, 2018 ACS.
The Cuban diaspora in the United States is comprised of nearly 2.7 million individuals who were either born in Cuba or reported Cuban ancestry or race, according to tabulations from the U.S. Census Bureau’s 2018 ACS.
Sources
Duany, Jorge. 2017. Cuban Migration: A Postrevolution Exodus Ebbs and Flows. Migration Information Source, July 6, 2017. Available online.
Gibson, Campbell J. and Kay Jung. 2006. Historical Census Statistics on the Foreign-born Population of the United States: 1850-2000. Working Paper no. 81, U.S. Census Bureau, Washington, DC, February 2006. Available online.
Krogstad, Jens Manuel. 2017. Surge in Cuban Immigration to U.S. Continued through 2016. Pew Research Center Fact Tank, January 13, 2017. Available online.
United Nations, Department of Economic and Social Affairs, Population Division. 2019. International Migrant Stock 2019. Accessed June 1, 2020. Available online.
U.S. Census Bureau. N.d. 2018 American Community Survey (ACS). Accessed December 20, 2019. Available online.
U.S. Department of Homeland Security (DHS) Office of Immigration Statistics. 2019. 2018 Yearbook of Immigration Statistics. Washington, DC: DHS Office of Immigration Statistics. Available online.
Wasem, Ruth Ellen. 2009. Cuban Migration to the United States: Policy and Trends. Washington, DC: Congressional Research Service. Available online.