

Detailed Characteristics of the South American Born in the United States in 2000
Source Spotlights are often updated as new data become available. Please click here to find the most recent version of this Spotlight.
This spotlight examines the foreign born from South America. It is the fourth in a series on the size and characteristics of the foreign-born population in the United States by region and country of birth.
The South American born make up a small proportion of both the overall foreign-born population and the Latin American-born population in the United States. However, the number of immigrants born in South America has grown rapidly over the past 30 years.
As a group, the foreign born from South American countries are about as likely to be proficient in English and have university degrees as the overall foreign-born population. However, they are slightly more likely to participate in the labor force and to work in sales and office or service occupations. Yet closer examination of this population reveals a great deal of variation by country of birth.
The series draws primarily from Census 2000 data, including social, economic, and housing profiles of the foreign born developed by the U.S. Census Bureau.
Click on the bullet points below for more information:
- The South American born accounted for about six percent of the total U.S. foreign-born population in 2000.
- The South American born made up the smallest proportion of the Latin American-born population in 2000.
- The South American born ranked second among Latin American groups in terms of the rate of population growth between 1990 and 2000.
- Immigrants born in Colombia, Ecuador, Peru, and Brazil accounted for most of the increase in the numbers of the South American born between 1960 and 2000.
View Map (pdf) - Colombians made up the largest proportion of the South American born, followed by those from Ecuador, Peru, Brazil, and Guyana.
- Of the South American born living in the United States in 2000, three in four arrived after 1980.
- Colombia, Ecuador, and Brazil accounted for the largest number of arrivals between 1990 and 2000.
- The South America-born groups with the largest percentage of recent arrivals were from Brazil, Venezuela, and Paraguay.
- New York, Florida, New Jersey, California, and Massachusetts were the top five states in which the South American born resided in 2000.
- The South American born compose over one-tenth of the foreign-born populations of New Jersey, Florida, New York, Connecticut, and Puerto Rico.
- The South American born were slightly less likely to be citizens than the foreign-born population in general.
- The South American born tended to be about the same age as the overall foreign-born population in 2000.
- Slightly over half of the South American born were women.
- Four of every five South American born spoke a language other than English at home.
- About three out of every five of the South American born who spoke a language other than English at home spoke English less than "very well."
- Almost three-quarters of the South American born had a high school or higher degree.
- Nearly one-quarter of the South American born had a college education.
- The South American born were slightly more likely to participate in the labor force than the overall foreign-born population.
- The South American born were slightly more likely to be unemployed than the foreign born in general.
- The South American born were concentrated in sales or office and service occupations.
- South American men from Argentina, Venezuela, and Uruguay had the highest median earnings.
- South American women from Argentina, Uruguay, Guyana, and Chile had the highest median earnings.
- About 15 percent of South America-born individuals lived in poverty.
- About two-fifths of South America-born householders owned their own home.
|
|
||
|
The South American born accounted for about six percent of the total U.S. foreign-born population in 2000.
In 2000, of the 31.1 million foreign born in the United States, about 1,930,271 (6.2 percent) were born in South American countries.
The South American born made up the smallest proportion of the Latin American-born population in 2000.
The South American born (1.9 million) were the smallest foreign-born group from Latin America behind those from Central America (2.0 million), the Caribbean (3.0 million), and Mexico (9.1 million).
The South American born ranked second among Latin American groups in terms of the rate of population growth between 1990 and 2000.
Between 1990 and 2000, the number of South America-born individuals living in the United States increased from 1,037,497 to about 1.9 million, an increase of 892,774 (86.1 percent). This was the second highest growth rate among the foreign born from Latin America over this period. The number of foreign born from Mexico increased 130 percent, from Central America 78.7 percent, and from the Caribbean 52.3 percent.
|
|
||
|
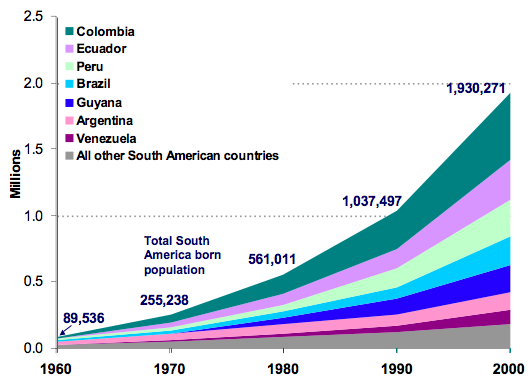
Immigrants born in Colombia, Ecuador, Peru, and Brazil accounted for most of the increase in the numbers of the South American born between 1960 and 2000.
The bulk of the increase after 1960 is a result of growing numbers from Colombia, Ecuador, Peru, and Brazil. The foreign-born population from Colombia grew by 497,288 over this period, from Ecuador by 290,955, from Peru by 271,083, and from Brazil by 198,442 (see Figure 1).
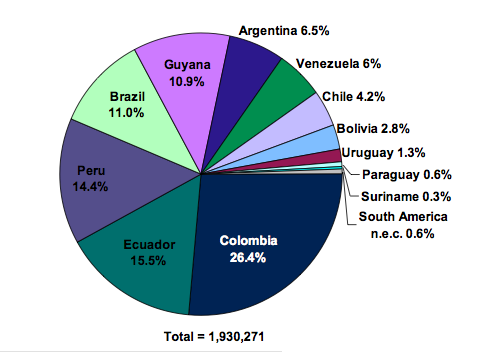
Colombians made up the largest proportion of the South American born, followed by those from Ecuador, Peru, Brazil, and Guyana.
Colombians (509,870) accounted for 26.4 percent of the overall South America-born population in 2000. The other main countries of birth were Ecuador (298,625), Peru (278,185), Brazil (212,430), and Guyana (211,190) (see Figure 2).
- For information on where specific groups are living in the United States, see State Immigration Data Profiles.
|
|
||
|
Of the South American born living in the United States in 2000, three in four arrived after 1980.
Of the total South American born in the United States, 46.7 percent arrived between 1990 and 2000, 28.3 percent arrived between 1980 and 1989, and 24.9 percent arrived before 1980.
Colombia, Ecuador, and Brazil accounted for the largest number of arrivals between 1990 and 2000.
The South America-born groups with the largest numbers who entered between 1990 and 2000 were from Colombia (228,870), Ecuador (141,695), and Brazil (139,225).
The South America-born groups with the largest percentage of recent arrivals were from Brazil, Venezuela, and Paraguay.
The South America-born groups with the largest percentage of their own populations arriving between 1990 and 2000 were from Brazil (65.5 percent), Venezuela (63.2 percent), and Paraguay (49.7 percent), together accounting for 212,830 new arrivals.
New York, Florida, New Jersey, California, and Massachusetts were the top five states in which the South American born resided in 2000.
Almost three-quarters (74 percent) of the South American born lived in five states in 2000. New York was home to 518,251 (27 percent), Florida to 407,880 (21 percent), New Jersey to 238,123 (12 percent), California to 202,628 (10 percent), and Massachusetts to 69,805 (four percent).
The South American born compose over one-tenth of the foreign-born populations of New Jersey, Florida, New York, Connecticut, and Puerto Rico.
While the South American born made up 6.2 percent of the total foreign-born population in 2000, they represented 16 percent of the 1.5 million foreign born in New Jersey, 15 percent of the 2.7 million foreign born in Florida, 13 percent of the 3.9 million foreign born in New York, 13 percent of the 369,967 foreign born in Connecticut. Although the U.S. Census Bureau does not include the foreign born in Puerto Rico in its national count, the South American born accounted for 10 percent of the 109,581 foreign born in Puerto Rico.
The South American born were slightly less likely to be citizens than the foreign-born population in general.
Just under two-fifths (750,629) or 38.9 percent of the South American born were naturalized U.S. citizens, compared with about 40 percent (12.5 million) of the total foreign-born population.
The South American countries whose nationals were most likely to be naturalized were Guyana (59.2 percent), Uruguay (50.7 percent), and Paraguay (50.5 percent). Conversely, the sending countries with the lowest naturalization rates — Brazil (21.5 percent), Venezuela (24.5 percent), Ecuador (34.3 percent), and Suriname (35.9 percent) — tended to be those with the highest proportions entering between 1990 and 2000.
The South American born tended to be about the same age as the overall foreign-born population in 2000.
The median age of the South American born was about the same (37 years) as the overall foreign-born population (37.5 years) in 2000. The oldest South America-born groups were from Uruguay (with a median age of 43.2 years old), Argentina (42.9 years old), Chile (40.2 years old), and Guyana (39.8 years old). The youngest South America-born groups were from Venezuela (32.5 years old), Paraguay (33.3 years old), and Brazil (33.7 years old).
However, the countries of birth with older median ages represent populations that have been in the United States the longest, suggesting that the immigrants aged while in the United States and were not necessarily older at the time of immigration. Conversely, the countries with lowest median ages are also the countries with the highest proportions entering between 1990 and 2000.
Slightly over half of the South American born were women.
About 52.3 percent of the South American born were women, compared with 50.2 percent of the foreign-born population in general. Only two countries, Uruguay and Ecuador, had more male immigrants than female, though the difference was slight (52.0 and 50.5 percent male, respectively).
The gender ratio of immigrants from all South American countries was nearly balanced. The countries with the least balanced gender ratios were Colombia (54.9 percent female), Suriname (54.3 percent female), Brazil (53.8 percent female), and Guyana (53.6 percent female).
- See the Spotlight on Sex Ratios of the Foreign Born in the United States
Four of every five South American born spoke a language other than English at home.
About 1.6 million (83.7 percent) of the South American born age 5 and older spoke a language other than English at home, compared with about 83 percent of the foreign-born population in general.
The groups with the highest percent of those speaking a language other than English at home — Ecuador (95.0 percent), Peru (94.3 percent), Bolivia (93.8 percent), and Colombia (93.6 percent) — were also among the more recent groups to enter the United States.
Only 8.9 percent of those from English-speaking Guyana spoke a language other than English at home.
About three out of every five of the South American born who spoke a language other than English at home spoke English less than "very well."
Of the South American born age 5 and older who spoke a language other than English at home, 40.8 percent reported speaking English "very well" compared with 38.5 percent of the overall foreign-born population.
Suriname (72.4 percent), where English is commonly spoken, and English-speaking Guyana (65.3 percent) had the highest percentage of those with a high degree of English proficiency, followed by Argentina (55.3) and Venezuela (54.5 percent).
Conversely, the South America-born groups least likely to speak English "very well" were from Ecuador (31.5 percent), Colombia (34.8 percent), and Peru (40.3 percent).
- See the Spotlight on English Abilities of the U.S. Foreign-Born Population
Almost three-quarters of the South American born had a high school or higher degree.
Of the South American-born population age 25 and older, 74.3 percent reported having a high school or higher degree compared to 61.8 percent of the total foreign-born population.
Those born in Venezuela (87.6 percent), Suriname (83.1 percent), and Bolivia (82.9 percent) were the most likely to report having a high school degree or higher. Those born in Ecuador (61.5 percent), Guyana (70.0 percent), and Uruguay (71.7 percent) were the least likely to report having completed a high school education.
Nearly one-quarter of the South American born had a college education.
Of the South America-born population age 25 and older, 23.4 percent had a bachelor’s degree or higher education, compared to 24 percent of the overall foreign-born population.
Those born in Venezuela (43.2 percent), Argentina (34.5 percent), and Brazil (32.0 percent) were the most likely to report having a bachelor’s or higher degree. Those born in Ecuador (13.0 percent) were least likely to report having a bachelor’s or higher degree, followed by those born in Guyana (16.6 percent) and Colombia (21.6 percent).
The South American born were slightly more likely to participate in the labor force than the overall foreign-born population.
Among the population age 16 and older, 64.5 percent (1.1 million) of the South American born participated in the civilian labor force, compared to 60.6 percent (17.3 million) of the total foreign born.
South America-born groups who were most likely be in the labor force were from Uruguay (68.7 percent), Guyana (68.0 percent), Bolivia (66.8 percent), and Brazil (65.6 percent). The South American born who had the lowest labor force participation rates were from Suriname (61.0 percent), Colombia (62.6 percent), and Venezuela (62.9 percent).
The South American born were slightly more likely to be unemployed than the foreign born in general.
Of the population age 16 and older in the civilian labor force in 2000, 7.1 percent of the South American born reported they were unemployed, compared with 6.8 percent of the overall foreign-born population.
The South America-born groups most likely to be unemployed were from Ecuador (8.6 percent), Colombia (8.0 percent), and Venezuela (7.0 percent). The South America-born groups least likely to be unemployed were from Argentina (4.8 percent), Chile (5.6 percent), and Brazil (5.7 percent).
The South American born were concentrated in sales or office and service occupations.
Of the employed population age 16 and older in the civilian labor force, the South American born were more likely to work in sales and office as well as service occupations than the overall foreign-born population.
Additionally, the South American born were less likely to work in management or professional; farming, fishing, and forestry; construction; or production, transportation, and material moving occupations than the foreign born in general (see Table 1).
|
|
||||||||||||||||||||||||||||||||||||||||||||||
|
||||||||||||||||||||||||||||||||||||||||||||||
South American men from Argentina, Venezuela, and Uruguay had the highest median earnings.
Among full-time, year-round workers in 1999, the median earnings for South America-born men were about the same as for foreign-born men in general, with each group earning about $30,000. The South America-born men with highest median earnings were from Argentina ($41,094), Venezuela ($36,645), and Uruguay ($35,639). Those with the lowest median earnings were from Ecuador ($25,796), Peru ($29,673), Colombia ($30,481), and Bolivia ($31,261). These low earning groups correspond with the groups least likely to speak English "very well."
South American women from Argentina, Uruguay, Guyana, and Chile had the highest median earnings.
Among full-time, year-round workers in 1999, the median earnings for South America-born women ($24,000) were about the same as those for all foreign-born women ($25,000). The South America-born women with highest median earnings were from Argentina ($30,556), Uruguay ($28,001), Guyana ($27,352), and Chile ($26,813). Those with the lowest median earnings were from Ecuador ($21,615), Peru ($22,232), Colombia ($22,937), Suriname ($24,981), and Bolivia ($24,994).
About 15 percent of South America-born individuals lived in poverty.
Of the people for whom poverty status was determined in 1999, South America-born individuals (15.5 percent) were slightly less likely to be in poverty than the total foreign born (17.9 percent). The South American groups with the lowest poverty rates were from Uruguay (10.1 percent), Paraguay (10.5 percent), and Guyana (11.6 percent). The South America-born groups with the highest poverty rates were from Brazil (18.7 percent), Venezuela (18.0 percent), Colombia (17.9 percent), and Ecuador (16.6 percent).
About two-fifths of South America-born householders owned their own home.
In 2000, 43.1 percent of South America-born householders owned their homes, compared to 49.8 percent of all foreign-born householders.
The South America-born householders most likely to own their homes were from Argentina (56.6 percent), Guyana (54.7 percent), and Uruguay (53.1 percent). The South America-born householders least likely to own their homes were from Brazil (31.3 percent), Ecuador (32.8 percent), and Colombia (41.0 percent).
Notes: Some descriptions of the characteristics of the South American born do not include those reporting the Falkland Islands, French Guiana, or South America as their place of birth. For information on sampling error, nonsampling error, and definitions (labor force, occupations, and poverty), click here.
Sources
Gibson, Campbell and Emily Lennon (1999). "Working Paper No. 29: Historical Census Statistics on the Foreign-Born Population of the United States: 1850 to 1990." U.S. Government Printing Office; Washington, DC.
U.S. Census Bureau, Census 2000. "Population and Housing and Census."
U.S. Census Bureau, Census 2000. "5% Public Use Microdata Sample."