

European Immigrants in the United States

A celebration for the Feast of San Gennaro in New York's Little Italy. (Photo: iStock.com/littleny)
Europe has been a major source of North American immigration and population growth for more than five centuries. However, Europeans’ prevalence among U.S. immigrants began to wane in the second half of the 20th century. Significant changes in U.S. immigration policy in 1965 opened pathways for non-European immigrants, bright economic opportunities in post-World War II Western Europe made emigration less attractive, and Communist governments in most Eastern Europe countries erected barriers to emigration, all of which led to a significant drop in both the numbers and share of European immigrants in the United States. Whereas in 1960 Europeans constituted 75 percent of all U.S. immigrants, their share fell to 22 percent by 1990. While the fall of the Berlin Wall in 1989 led to a rise in immigration primarily from Eastern Europe and the former Soviet Union, the proportion of European immigrants in the United States has continued to fall.
Europeans comprised 10 percent, or slightly more than 4.7 million, of the 46.2 million immigrants living in the United States in 2022, according to the most recent U.S. Census Bureau data. Europeans represent the third-largest region-origin immigrant group after those from the Americas (52 percent) and Asia (31 percent). Recently, the Russian invasion of Ukraine has sparked new movements to the United States, with Ukrainians and Russians alike seeking refuge and opportunity. This trend highlights how geopolitical events continue to influence migration patterns.
Europeans are more likely than other immigrants to have strong English skills and to be naturalized U.S. citizens. Compared to immigrants overall and the U.S. born, European immigrants are more likely to hold a bachelor’s degree and have a higher income. European immigrants also tend to be considerably older than the overall foreign- and native-born populations. While most Europeans who became lawful permanent residents (LPRs, also known as green-card holders) in fiscal year (FY) 2022 did so through family reunification channels, nearly one-third were sponsored by U.S. employers.
This Spotlight provides information on the European immigrant population in the United States, focusing on its size, geographic distribution, and socioeconomic characteristics.
Click on the bullet points below for more information:
- Size of Immigrant Population over Time
- Subregions and Countries of Origin
- Distribution by U.S. State and Key Cities
- English Proficiency
- Age, Education, and Employment
- Income and Poverty
- Immigration Pathways and Naturalization
- Unauthorized Immigrant Population
- Health Coverage
- Diaspora
- Top Global Destinations
- Remittances
Size of Immigrant Population over Time
The European immigrant population has mostly declined over the last four decades, except for during the post-Cold War period between 1990 and 2000. It decreased by 16 percent between 1980 and 1990, and then increased by 13 percent from 1990 to 2000. The downward trend subsequently resumed at a more moderate rate, with a decrease of around 2 percent from 2000 to 2010 and then again from 2010 and 2022.
Figure 1. European Immigrant Population in the United States, 1980-2022

Sources: Data from U.S. Census Bureau 2010 and 2022 American Community Surveys (ACS), and Campbell J. Gibson and Kay Jung, "Historical Census Statistics on the Foreign-Born Population of the United States: 1850-2000" (Working Paper no. 81, U.S. Census Bureau, Washington, DC, February 2006), available online.
Subregions and Countries of Origin
Between 1990 and 2010, the number of Eastern European immigrants increased significantly due in part to the dissolution of Czechoslovakia, the Soviet Union, and Yugoslavia (see Figure 2). This growth began to taper off with enlargements of the European Union in 2004 and 2007; when many Eastern European countries joined the bloc, their nationals had easier access to other Member States and felt less pull to migrate to the United States. Meanwhile, the U.S. population of Europeans from other parts of the continent continued to decrease.
Figure 2. European Immigrants in the United States, by Subregion of Birth, 1960–2022
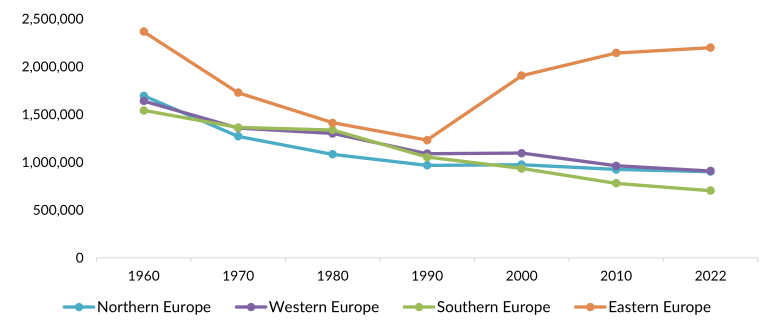
Note: The increase in Eastern European immigration from 1990 to 2010 is particularly noteworthy, given that after the collapse of the Soviet Union the U.S. Census Bureau reclassified some former Soviet republics such as Armenia and Kazakhstan as part of Asia rather than Eastern Europe.
Sources: Data from U.S. Census Bureau 2010 and 2022 ACS and Gibson and Jung, “Historical Census Statistics on the Foreign-Born Population of the United States: 1850-2000.”
In 2022, Eastern European immigrants accounted for the largest share of Europeans in the United States, at 46 percent (see Table 1). They were followed by Western and Northern Europeans, who each made up about 19 percent. The top origin countries were the United Kingdom, Germany, Ukraine, Russia, and Poland, together representing 51 percent of all European immigrants.
Russia’s full-scale invasion of Ukraine in early 2022 led to Europe’s largest displacement crisis since World War II and forced millions of Ukrainians to flee their country. While the overwhelming majority settled in countries across Europe, as of end of 2023 more than 186,000 were estimated to have arrived in the United States by seeking entry at the U.S.-Mexico border or participating in a special humanitarian parole program called Uniting for Ukraine. Russians previously comprised the largest group of Eastern Europeans in the United States, but in 2022 they were overtaken by Ukrainians.
Table 1. European Immigrants by Subregion and Country of Origin, 2022
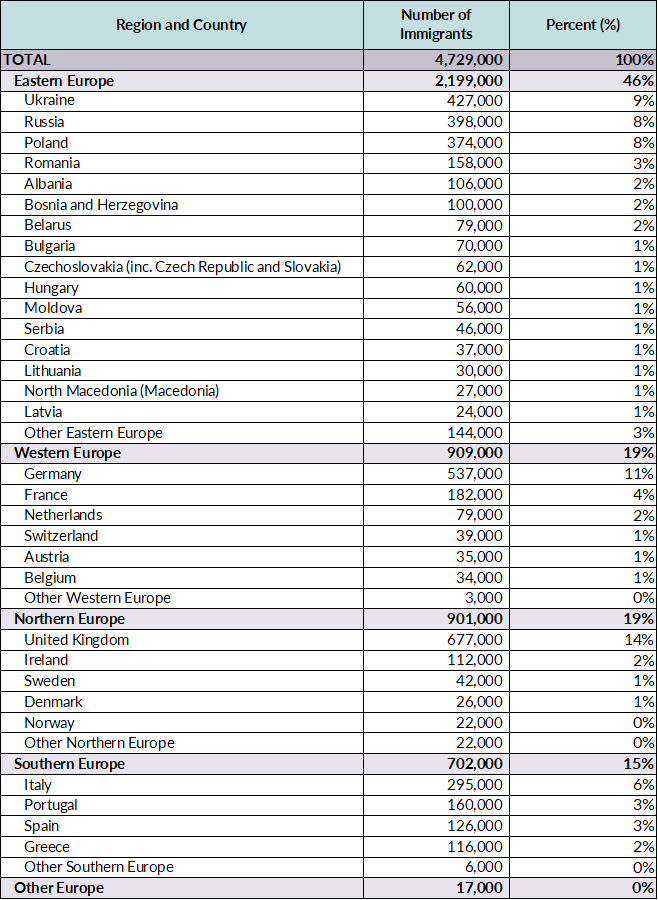
Source: MPI tabulation of data from the U.S. Census Bureau 2022 ACS.
Distribution by U.S. State and Key Cities
Immigrants from Europe were highly concentrated in New York and California (15 percent and 14 percent, respectively) in the 2017-21 period. The next three most populous states—Florida, Illinois, and New Jersey—were home to approximately 22 percent of the European population collectively. The top five counties for European immigrants were Cook County, Illinois; Kings County, New York; Los Angeles County, California; and Queens and New York counties in New York. Together these counties accounted for 17 percent of European immigrants in the United States.
Figure 3. Top States of Residence for European Immigrants in the United States, 2017-21
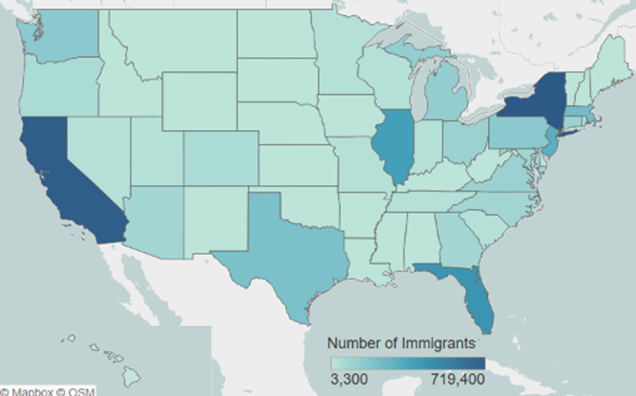
Note: Pooled 2017-21 ACS data were used to get statistically valid estimates at the state level for smaller-population geographies. Not shown is the population in Alaska, which is small in size; for details, visit the Migration Policy Institute (MPI) Migration Data Hub for an interactive map showing geographic distribution of immigrants by state and county, available online.
Source: MPI tabulation of data from the U.S. Census Bureau's pooled 2017-21 ACS.
Click here for an interactive map that highlights the states and counties with the highest concentrations of immigrants from Europe and other regions and countries.
The greater New York, Chicago, and Los Angeles metropolitan areas were home to 30 percent of European immigrants in the United States as of the 2017-21 period. Around 4 percent of all residents in the greater New York and Chicago metro areas were born in Europe (see Table 2).
Figure 4. Top Metropolitan Destinations for European Immigrants in the United States, 2017-21
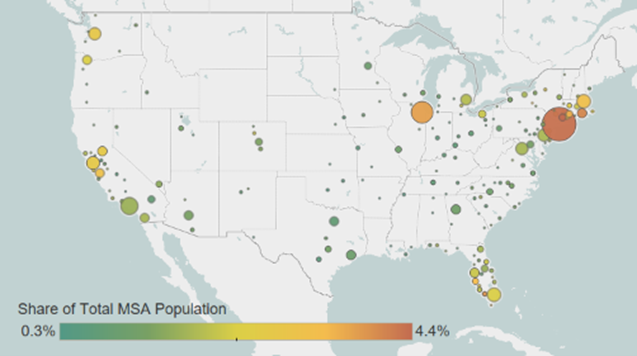
Note: Pooled 2017-21 ACS data were used to get statistically valid estimates at the metropolitan statistical-area level for smaller-population geographies. Not shown are the populations in Alaska and Hawaii, which are small in size; for details, visit MPI’s Migration Data Hub for an interactive map showing geographic distribution of immigrants by metro area, available online.
Source: MPI tabulation of data from U.S. Census Bureau pooled 2017-21 ACS.
Click here for an interactive map that highlights the metro areas with the most immigrants from Europe and other regions and countries.
Table 2. Top Concentrations of European Immigrants by U.S. Metropolitan Area, 2017-21
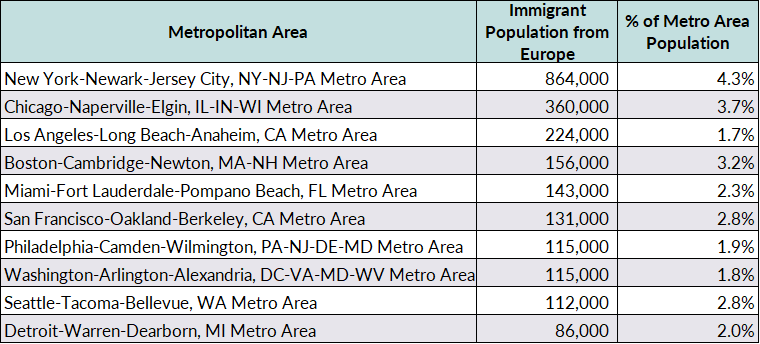
Source: MPI tabulation of data from the U.S. Census Bureau pooled 2017-21 ACS.
Europeans are much more likely to be proficient in English and speak English at home than the overall foreign-born population.
In 2022, approximately 25 percent of European immigrants ages 5 and over reported speaking English less than “very well,” compared to 46 percent of all foreign born in the United States. Immigrants from Eastern Europe were the most likely to have limited English proficiency (38 percent), followed by those from Southern Europe (33 percent) and Western Europe (9 percent), while Northern Europeans were the least likely (2 percent).
At the country level, immigrants from Ukraine were the most likely to have limited proficiency in English (49 percent), followed by those from Belarus and Albania (44 percent each). Meanwhile, less than 10 percent of immigrants from Germany, the Netherlands, Ireland, and the United Kingdom reported having limited proficiency in English. In many European countries, English is a lingua franca for business and education, or a native language.
Overall, European immigrants were twice as likely to speak only English at home compared to all immigrants (35 percent versus 17 percent, respectively).
Age, Education, and Employment
European immigrants tend to be significantly older than the overall foreign- and native-born populations. The median age of European immigrants in 2022 was approximately 54 years, compared to 47 for all immigrants and 37 for the U.S. born. European immigrants were much more likely to be seniors (ages 65 and over) than the foreign- and U.S.-born populations (see Figure 5).
Figure 5. Age Distribution of the U.S. Population by Origin, 2022
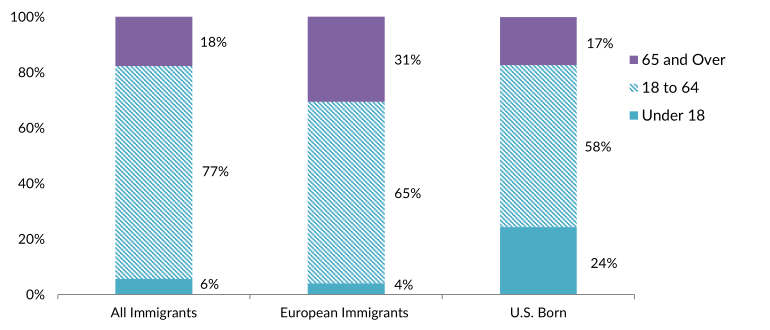
Source: MPI tabulation of data from the U.S. Census Bureau 2022 ACS.
However, age distribution varies considerably by origin country. Eastern European immigrants are overwhelmingly of working age (18 to 64 years old), particularly those from Bosnia and Herzegovina (87 percent), Bulgaria (83 percent), Albania (81 percent), and Belarus (77 percent). In contrast, a significant proportion of the foreign born from several countries were 65 or over, including those from Italy (54 percent), Greece (50 percent), Germany (46 percent), the Netherlands (42 percent), and Portugal (41 percent).
Europeans ages 25 and over have much higher educational attainment rates than the native- and overall foreign-born populations. In 2022, approximately 47 percent of European immigrant adults had a bachelor's degree or higher, compared to about 36 percent of the U.S. born and 35 percent of all immigrants (see Figure 6). Among Europeans who arrived between 2020 and 2022, 68 percent held at least a four-year college degree, a rate much higher than that of all immigrants arriving in that period (48 percent).
Click here for data on immigrants’ educational attainment by country of origin and overall.
Figure 6. Educational Attainment of the U.S. Population (ages 25 and older) by Origin, 2022
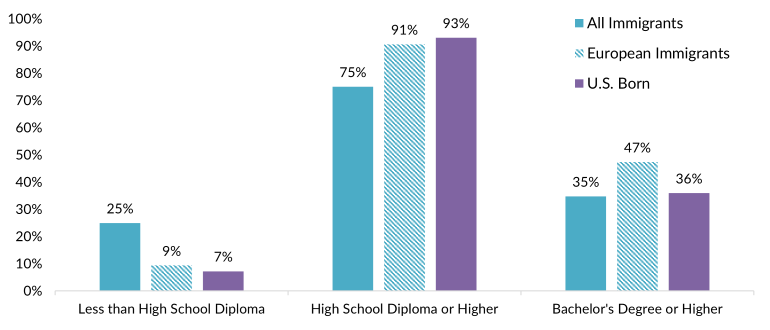
Source: MPI tabulation of data from the U.S. Census Bureau 2022 ACS.
The educational attainment of European immigrants can be explained by the high levels of education in origin countries as well as the channels through which they enter the United States. Many arrive as international college students or high-skilled temporary workers on H-1B visas, who later apply for a green card.
In the 2022-23 school year, approximately 90,000 international students from Europe studied in the United States, comprising about 9 percent of all 1.1 million international students. The top European origin countries were the United Kingdom (11,000), Germany (10,000), France and Spain (9,000 each), and Italy (6,000).
Several European countries were among the top 20 countries of origin for immigrants receiving coveted H-1B visas in FY 2022. The United Kingdom, France, Germany, and Italy jointly accounted for slightly more than 1 percent of the 442,000 petitions for initial and continuing employment that were approved by U.S. Citizenship and Immigration Services (USCIS). Most H-1B petitions (73 percent) went to Indian nationals.
Reflecting their older average age, European immigrants participate in the labor force at a lower rate than both the native- and overall foreign-born populations. In 2022, about 59 percent of Europeans ages 16 and over were in the civilian labor force, compared to 67 percent of all immigrants and 62 percent of the native born. More than half of all Europeans were employed in management, business, science, and arts occupations, a much higher share than the overall foreign- and native-born populations (see Figure 7).
Figure 7. Employed Workers in the Civilian Labor Force (ages 16 and older) by Occupation and Origin, 2022
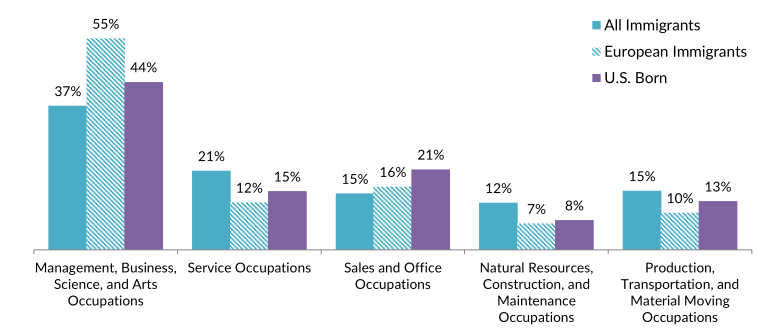
Source: MPI tabulation of data from the U.S. Census Bureau 2022 ACS.
Management, business, science, and art occupations were the primary occupational group for immigrants from all European countries for which data were available, although the share of workers in those occupations varied. Approximately 72 percent of immigrants born in France worked in those occupations, compared to 48 percent of Ukrainians and 36 percent of immigrants from Portugal and Bosnia and Herzegovina. The second most common set of occupations was sales and office for most European groups, although immigrants from Bosnia and Herzegovina were more likely to work in production, transportation, and material moving occupations, and those from Albania were more likely to work in service occupations.
European immigrants tend to have significantly higher incomes than the native born and immigrants overall. In 2022, households headed by a European immigrant had a median income of $86,000, compared to $75,000 for both all immigrant and U.S.-born households.
In 2022, 10 percent of Europeans were living in poverty, compared to 12 percent for the native born and 14 percent for immigrants overall. Poverty levels varied by country of origin; 14 percent of immigrants from Russia and Ukraine reported living in poverty, as did 7 percent of those from the United Kingdom, Ireland, and the Netherlands. (The U.S. Census Bureau defines poverty as having an income below $29,700 for a family of four in 2022.)
Immigration Pathways and Naturalization
European immigrants are more likely than the overall foreign-born population to be naturalized U.S. citizens. About 67 percent of European immigrants in the United States had acquired U.S. citizenship as of 2022, compared to 53 percent of all immigrants. Immigrants from Bosnia and Herzegovina (84 percent), Romania (80 percent), and Greece (77 percent) were the most likely to be naturalized citizens, while those from Spain (45 percent) and France (53 percent) were the least likely.
In general, Europeans have resided in the United States longer than other immigrants. The largest share, approximately 57 percent, arrived prior to 2000 (see Figure 8). However, a sizeable share of Spanish (47 percent), French (41 percent), and Albanian (39 percent) immigrants arrived since 2010, compared to 9 percent of those from Bosnia and Herzegovina.
Figure 8. Europeans and All Immigrants in the United States by Period of Arrival, 2022
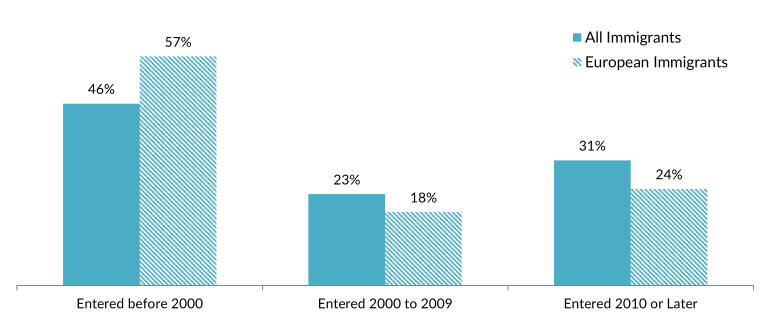
Source: MPI tabulation of data from the U.S. Census Bureau 2022 ACS.
Just like the overall immigrant population receiving a green card in FY 2022, most Europeans became permanent residents through family reunification channels. In FY 2022, 51 percent of the roughly 76,000 Europeans who became LPRs did so as immediate relatives of U.S. citizens or through other family-based pathways. Europeans were slightly more likely than the overall immigrant population to have obtained a green card through employment channels (30 percent versus 27 percent), and they were more likely to have received a green card as the result of the Diversity Visa lottery (12 percent versus 4 percent; see Figure 9).
Figure 9. Immigration Pathways of European and All Lawful Permanent Residents in the United States, 2022
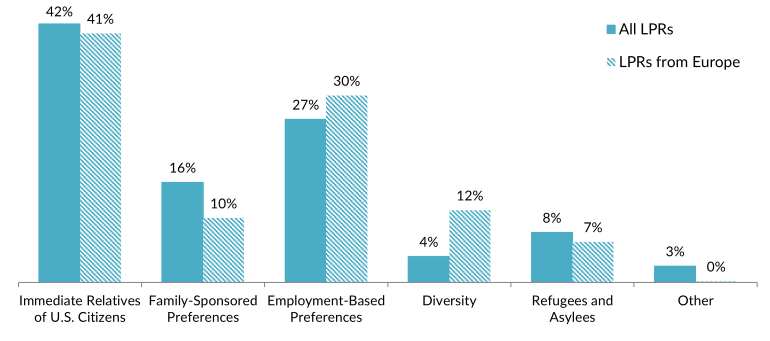
Notes: Immediate Relatives of U.S. Citizens: Includes spouses, minor children, and parents of U.S. citizens. Family-Sponsored Preferences: Includes adult children and siblings of U.S. citizens as well as spouses and children of green-card holders. The Diversity Visa lottery was established by the Immigration Act of 1990 to allow entry to immigrants from countries with low rates of immigration to the United States. The law states that 55,000 diversity visas in total are made available each fiscal year. Individuals born in every European country were eligible for the 2025 lottery. Percentages may not add up to 100 as they are rounded to the nearest whole number.
Source: MPI tabulation of data from Department of Homeland Security (DHS), “Table 10D: Persons Obtaining Lawful Permanent Resident Status by Broad Class of Admission and Region and Country of Birth: Fiscal Year 2022,” updated August 21, 2023, available online.
Pathways to permanent residency vary by country of origin. In FY 2022, a greater share of new green-card holders from France (57 percent) and Finland (52 percent) gained legal permanent residence via employment-based preferences than those from Albania (5 percent) and Montenegro (6 percent). At the same time, 22 percent of new LPRs from Moldova and 18 percent each from Kosovo and Ukraine obtained a green card by adjusting their status from refugee or asylee. A significant share of Eastern Europeans received a green card through the Diversity Visa lottery, including those from Belarus (38 percent), Kosovo (27 percent), and Moldova and Albania (24 percent each).
Unauthorized Immigrant Population
Although most European immigrants in the United States are legally present, approximately 599,000 were unauthorized in 2021, according to Migration Policy Institute (MPI) estimates, comprising 5 percent of the overall estimated 11.2 million unauthorized immigrants.
Click here for an overview of the 2021 unauthorized immigrant population in the United States.
About 3,300 unauthorized European immigrants were active recipients of the Deferred Action for Childhood Arrivals (DACA) program in September 2023, out of 544,700 overall DACA holders, according to USCIS. DACA offers protection from deportation and work authorization to unauthorized immigrants who arrived as children and meet other requirements. The European origins for the largest number of DACA recipients were Poland (890 recipients), the United Kingdom (350), Portugal (340), Italy (250), and Albania (200).
European immigrants are more likely to have health insurance coverage than the overall foreign-born population and have a similar uninsured rate as the native born (see Figure 10). Immigrants from Ukraine and Bulgaria (about 12 percent each) had much higher rates of uninsurance than those from Italy and the Netherlands (3 percent each) as of 2022.
Figure 10. Health Coverage for European Immigrants, All Immigrants, and the U.S. Born, 2022
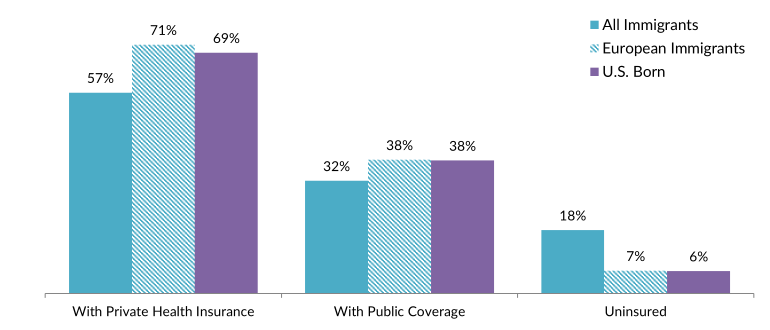
Note: The sum of shares by type of insurance is likely to be greater than 100 because people may have more than one type of insurance.
Source: MPI tabulation of data from the U.S. Census Bureau 2022 ACS
Many U.S. diaspora communities trace their lineage back to European countries. The German diaspora was the largest in the United States as of 2022, with nearly 42 million individuals who either reported German ancestry or were born in Germany. After the Mexican diaspora, the United Kingdom and Ireland were ancestral homes to the third and fourth largest diaspora groups (comprised of 38 million and 33 million individuals, respectively), and those with roots in Italy (16 million), Poland (8 million), and France (6 million) were also among the ten largest.
Click here to see estimates of the top 35 diasporas groups in the United States in 2022.
Of the 63.3 million global migrants from Europe, 70 percent resided elsewhere within Europe, followed by about 11 percent each in Asia and Northern America, 5 percent in Oceania, and 2 percent in Latin America and the Caribbean, according to United Nations Population Division estimates from mid-2020. Within Europe, the top destination country was Germany, home to 14 percent of all international migrants from Europe. Outside Europe, the United States was the leading destination for migrants from Europe (7 percent), followed by Kazakhstan (5 percent) and Australia (4 percent).
Click here to view an interactive map showing where migrants from countries from Europe and other regions have settled worldwide.
Remittances sent to Europe have grown rapidly since 2000. In 2022, global remittances sent via formal channels by European migrants and their descendants from all over the world equaled nearly U.S. $190.7 billion, down 4 percent from $198.7 billion in 2021 but nearly five times higher than 2000 ($38.7 billion).
For many European countries, remittances accounted for a tiny share of gross domestic product (GDP). However, remittance dependence was higher in Kosovo (17 percent of GDP), Moldova (14 percent), Bosnia and Herzegovina (10 percent), and Albania (9 percent).
Figure 11. Annual Remittance Flows to Europe, 2000-22
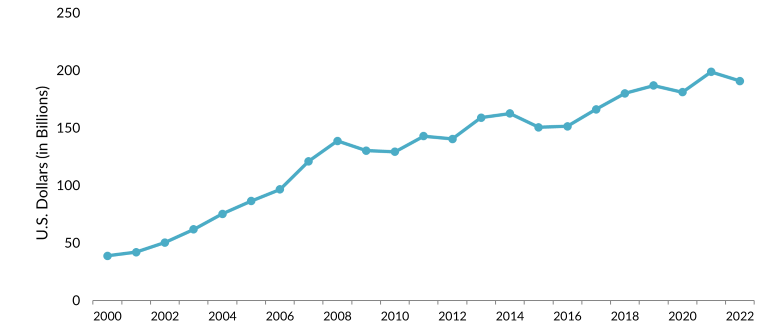
Source: MPI tabulations of data from the World Bank Global Knowledge Partnership on Migration and Development (KNOMAD), “Remittance Inflows,” June 2023 update, available online.
Click here to view an interactive chart showing annual remittances received and sent to various European countries.
Sources
Chishti, Muzaffar and Jessica Bolter. 2022. Welcoming Afghans and Ukrainians to the United States: A Case in Similarities and Contrasts. Migration Information Source, July 13, 2022. Available online.
Gibson, Campbell J. and Kay Jung. 2006. Historical Census Statistics on the Foreign-Born Population of the United States: 1850-2000. Working Paper no. 81, U.S. Census Bureau, Washington, DC, February 2006. Available online.
Institute of International Education (IIE). N.d. International Students: All Places of Origin. Accessed December 21, 2023. Available online.
Knowledge Partnership on Migration and Development (KNOMAD)/World Bank Group. 2023. Remittance Inflows. Updated June 2023. Available online.
Migration Policy Institute (MPI), Migration Data Hub. N.d. Countries of Birth for U.S. Immigrants, 1960-Present. Accessed December 21, 2023. Available online.
---. N.d. Top Diaspora Groups in the United States, 2022. Accessed January 5, 2024. Available online.
Szulecki, Kacper, Michał Kotnarowski, and Ben Stanley. 2023. Emigrant External Voting in Central-Eastern Europe after EU Enlargement. Electoral Studies (81): 102552. Available online.
U.S. Census Bureau. 2023. 2022 American Community Survey. Access from Steven Ruggles, Katie Genadek, Ronald Goeken, Josiah Grover, and Matthew Sobek. Integrated Public Use Microdata Series: Version 7.0 [dataset]. Minneapolis: University of Minnesota. Available online.
---. N.d. 2022 American Community Survey—Advanced Search: S0201 Selected Population Profile in the United States. Accessed December 5, 2023. Available online.
U.S. Citizenship and Immigration Services (USCIS). 2023. Characteristics of H-1B Specialty Occupation Workers: Fiscal Year 2022. Washington, DC: USCIS. Available online.
---. 2023. Count of Active DACA Recipients by Month of Current DACA Expiration as of September 30, 2023. Washington, DC: USCIS. Available online.
U.S. Department of Homeland Security (DHS), Office of Immigration Statistics. 2023. Yearbook of Immigration Statistics 2022. Updated December 8, 2023. Available online.
Wilson, Jill. 2023. Temporary Protected Status and Deferred Enforced Departure. Washington, DC: Congressional Research Service. Available online.