

European Immigrants in the United States
Formerly the largest U.S. immigrant group, European-born immigrants have seen their numbers decline in the United States over the past 50 years (notwithstanding a period of growth after the collapse of the Soviet Union). Though the number of these immigrants fell by only several million in numerical terms, the share of all European immigrants in the United States plummeted from nearly 75 percent in 1960 to 12 percent in 2010. At the same time, Eastern European immigrants have represented a larger share of that smaller pie during the past two decades.
Compared to the overall foreign-born population, European immigrants in the United States in 2010 were more likely as a group to be elderly, proficient in English, and naturalized U.S. citizens as well as having higher levels of education. They also tended to work in higher-skilled occupations and were less likely to live in poverty.
This Spotlight focuses on European immigrants residing in the United States, examining the population's size, geographic distribution, admission categories, and demographic and socioeconomic characteristics. Data are from the U.S. Census Bureau's 2010 American Community Survey (ACS), the 2000 Decennial Census (as well as earlier censuses), and the Department of Homeland Security's (DHS) Office of Immigration Statistics (OIS).
Click on the bullet points for more information:
- In 2010, more than 4.8 million European immigrants resided in the United States, representing 12 percent of all immigrants.
- About 44 percent of European immigrants were from Eastern Europe in 2010.
- The top countries of origin for European immigrants were the United Kingdom, Germany, Poland, Russia, and Italy.
- Over half of all European immigrants resided in five states: New York, California, Illinois, Florida, and New Jersey.
- About one-third of all European-born immigrants lived in three metropolitan areas: the greater New York, Chicago, and Los Angeles metro areas.
- In 2011, nearly 84,000 European-born immigrants were granted U.S. legal permanent residency.
- More than 78,000 European-born immigrants became U.S. citizens through naturalization in 2010.
- The share of European-born immigrants who have naturalized exceeded those of the overall foreign-born population by nearly 18 percentage points in 2010.
- European nationals accounted for 2 percent of refugee arrivals and 8 percent of persons granted asylum in 2011.
- European-born immigrants have resided in the United States for a longer period than the foreign born overall.
- The foreign born from Europe were more likely to be age 65 or older than either the U.S. born or foreign born overall.
- European immigrant women outnumbered men in 2010.
- Seven of ten European immigrants spoke only English or spoke English “very well.”
- European-born adults were more likely than the U.S. born to have a bachelor’s degree or higher.
- More than one-fifth of employed European-born men worked in management, business, and finance, while 18 percent of European women worked in service and personal care occupations.
- The European born were less likely to live in poverty in 2010 than any other group, regardless of nativity.
- About 1.4 million children under the age of 18 resided in a household with at least one immigrant parent born in Europe.
Size and Geographic Distribution
Note: The region designated as “Europe” has changed since 1960, mostly due to the disintegration of the Soviet Union, which was counted as Europe at the time but has since dissolved into numerous countries, some of which are not considered in Europe under this analysis.
In 2010, more than 4.8 million European immigrants resided in the United States, representing 12 percent of all immigrants.
The European born made up 4.8 million (12 percent) of the country’s 40 million immigrants in 2010. However, their numbers have fallen 34 percent since 1960 when an estimated 7.3 million European immigrants resided in the country.
Both the number and share of Europeans among the U.S. immigrant population has fallen significantly over the past 50 years. In 1960, Europeans represented 75 percent of all immigrants in the United States; declining to 60 percent in 1970, 37 percent in 1980, and 22 percent by 1990 (see Table 1). This is largely due to the increase in immigration from Latin America and Asia.
|
Table 1. The Total and European Foreign-Born Populations, 1960 to 2010
|
||||||||||||||||||||||||||||||||
|
||||||||||||||||||||||||||||||||
|
Regional Designations
|
||
|
About 44 percent of European immigrants were from Eastern Europe in 2010.
In 2010, 2.1 million European immigrants living in the United States were born in Eastern Europe (see box on regional designations).
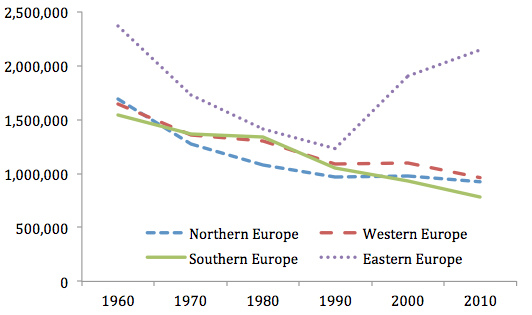
Eastern Europe was the leading region of birth for European immigrants, while the distribution between the other three regions was relatively even: Immigrants from Western Europe accounted for 20 percent (962,000), Northern Europe had 19 percent (924,000), and Southern Europe had 16 percent (779,000).
The shares of European immigrants born in Eastern Europe increased significantly between 1990 and 2000, and again between 2000 and 2010. This was the result of a sizeable increase from 1.2 million Eastern European immigrants in the United States in 1990 to 1.9 million in 2000. Following the dissolution of the Soviet Union, Yugoslavia, and Czechoslovakia, many immigrants from Eastern Europe came to the United States to reunify with family or seek refuge from ethnic violence. Their numbers continued to increase substantially from 2000 to 2010. Meanwhile, between 1990 and 2010, the numbers of Northern, Western, and Southern European immigrants in the United States continued to fall (see Figure 1).
Note: The increase in Eastern European immigrants from 1990 to 2010 is also noteworthy given the fact that after the collapse of the Soviet Union (classified as Eastern Europe through 1990), some former Soviet Republics such as Armenia and Kazakhstan were no longer classified as being in Europe.
|
|
||
|
The top countries of origin for European immigrants were the United Kingdom, Germany, Poland, Russia, and Italy.
In 2010, the top five countries of origin for the 4.8 million European immigrants in the United States were the United Kingdom (670,000, or 14 percent), Germany (605,000, 13 percent), Poland (476,000, 10 percent), Russia (383,000, 8 percent), and Italy (365,000, 8 percent).
To view other countries of birth for European immigrants, click here.
More than half of all European immigrants resided in five states: New York, California, Illinois, Florida, and New Jersey.
New York had the largest number of European immigrants in 2010, with 764,000 individuals, or 16 percent of the total European-born population, followed by California (666,000, or 14 percent), Illinois (389,000, 8 percent), Florida (388,000, 8 percent), and New Jersey (318,000, 7 percent).
Other states with European immigrant populations greater than 130,000 included Massachusetts (231,000, or 5 percent of overall European-born population), Texas (172,000, 4 percent), Pennsylvania (165,000, 3 percent), Washington (149,000, 3 percent), Connecticut (139,000, 3 percent), and Michigan (133,000, 3 percent).
About one-third of all European-born immigrants lived in three metropolitan areas: the greater New York, Chicago, and Los Angeles metro areas.
In 2010, the greater New York metropolitan area had the largest number of European immigrants, with about 911,000, or 19 percent, of the European born in the United States. The greater Chicago metropolitan area was second with 377,000 (8 percent), followed by the greater Los Angeles metropolitan area with 224,000 (5 percent).
Other metropolitan areas with European immigrant populations greater than 110,000 were the Boston-Cambridge-Quincy, MA-NH, metro area with 149,000 (3 percent), the San Francisco-Oakland-Fremont, CA, area (128,000, or 3 percent), the Miami-Fort Lauderdale-Pompano Beach, FL, area (123,000, 3 percent), the Philadelphia-Camden-Wilmington, PA-NJ-DE-MD, area (113,000, 2 percent), and the Washington-Arlington-Alexandria, DC-VA-MD-WV, area (112,000, 2 percent).
Of note, nearly half of all immigrants in the Cleveland-Elyria-Mentor, OH, metropolitan area were born in Europe, accounting for 46 percent (57,000) of the 123,000 immigrants in that region.
Modes of Entry and Legal Status
Note: DHS data, on which these statistics are based, refer to the U.S. government’s fiscal year, October 1 through September 30. Thus, “2011” refers to October 1, 2010 through September 30, 2011.
In 2011, nearly 84,000 European-born immigrants were granted U.S. legal permanent residency (LPR status, also known as getting a green card).
In 2011, 83,850 European immigrants obtained green cards, accounting for 8 percent of the 1.1 million immigrants granted legal permanent residence. The foreign born from Europe gained legal permanent residence through varying routes during the year: 62 percent obtained green cards through family relationships, 20 percent through employment, 11 percent through the U.S. diversity immigrant visa, 6 percent as refugees or asylees, and about 2 percent through other routes.
About 55 percent of all European immigrants granted LPR status in 2011 qualified as the immediate family member (spouse, unmarried child under 21, or parent) of a U.S. citizen, compared to 43 percent of all immigrants. Twenty percent of all European-born immigrants granted green cards did so via employment, compared to 13 percent of all immigrants.
More than 78,000 European-born immigrants became U.S. citizens through naturalization in 2010.
In 2010, 78,011 European-born immigrants were naturalized in the United States, representing 13 percent of the 619,913 new U.S. citizens. The European countries of birth with the most naturalizations were the United Kingdom (8,401), Poland (8,038), Russia (7,566), and the Ukraine (7,345).
The share of European-born immigrants who have naturalized exceeded those of the overall foreign-born population by nearly 18 percentage points in 2010.
As of 2010, about 62 percent of European immigrants were naturalized U.S. citizens. This was 18 percentage points greater than the share among all immigrants, which was about 44 percent.
About 84 percent of immigrants born in Czechoslovakia (see Box 1) were naturalized U.S. citizens, making them the most likely of all European immigrants to have naturalized. Immigrants from Greece (78 percent), Latvia (78 percent), Hungary (77 percent), and Italy (73 percent) were also more likely to be U.S. citizens than those from other European groups. The naturalized as a share of the total population were comparatively lower for Finland (40 percent), Sweden (40 percent), Norway (46 percent), Bulgaria (47 percent), and Denmark (47 percent).
European nationals accounted for 2 percent of refugee arrivals and 8 percent of persons granted asylum in 2011.
Fewer than 1,000 European nationals arrived in the United States as refugees in 2011, accounting for just 2 percent of the 56,384 refugees admitted overall. The number and share of European immigrants represented among refugee admissions in 2011 — the lowest in the decade — dropped significantly from 14,579 in 2002, which had accounted for 54 percent of all 26,788 refugees resettled in 2002). Close to 2,000 European nationals received asylum (8 percent) in 2011.
Between 2002 and 2011, refugees from Europe numbered 63,156 (or 12 percent of the 515,350 refugees resettled during the period). During this period, the leading countries of nationality for European refugee arrivals were Ukraine (23,241, or 37 percent of total European refugee arrivals), Russia (20,115, 32 percent), and Moldova (7,270, 12 percent).
During the same period, European nationals accounted for 8 percent (21,589) of the 260,951 total individuals granted asylum. The leading countries of origin for European nationals granted asylum were Russia (26 percent of total European asylum grants), Albania (25 percent), and Belarus (8 percent).
Demographic and Socioeconomic Overview
European-born immigrants have resided in the United States for a longer period than the foreign born overall.
As of 2010, 29 percent of the 4.8 million European immigrants in the United States entered before 1970, while 24 percent arrived between 1990 and 1999, and 24 percent entered after 2000. Before to the large increase in European immigration between 1990 and 1999, the prior two decades accounted for a relatively low percentage of the current population of European immigrants: 10 percent arrived between 1970 and 1979, and 12 percent between 1980 and 1989.
In 2010, European immigrants were substantially more likely than immigrants overall to have arrived prior to 1970: only 9 percent of the 39.9 million foreign born entered the United States prior to 1970, while 11 percent arrived between 1970 and 1979, 19 percent came between 1980 and 1989, 27 percent entered between 1990 and 1999, and 35 percent arrived after 2000.
Among the European born, some origin groups were far more established than others. For example, immigrants from Greece (84 percent), Portugal (83 percent), Czechoslovakia (83 percent), and Italy (83 percent) were most likely to have arrived before 1990, while immigrants from Bosnia (97 percent), Albania (93 percent), Moldova (92 percent), and Bulgaria (91 percent) were the most likely to have to have arrived since 1990.
The foreign born from Europe were more likely to be age 65 or older than all other groups.
Of the European- born residing in the United States in 2010, 29 percent were age 65 or older, compared with 13 percent of the native born and 12 percent of all immigrants. Among European-born immigrants, 67 percent were of working age (ages 16 through 64), a larger majority than the native-born population (63 percent), but much lower than that of the overall foreign-born population (82 percent).
The European-origin countries with the highest share of seniors in 2010 were Latvia (54 percent), Czechoslovakia (54 percent), Italy (47 percent), Hungary (45 percent), and Austria (45 percent). European countries with the highest share of youth included Russia (13 percent), Moldova (10 percent), Belgium (10 percent), Ukraine (8 percent), and Bulgaria (7 percent).
European immigrant women outnumbered men in 2010.
Of all European immigrants residing in the United States in 2010, 55 percent were women and 45 percent men. By contrast, the gender distributions were more balanced among the native born and overall foreign born (about 51 percent female and 49 percent male for each population).
The gender imbalance among European immigrants was more pronounced among those from certain countries. For example, the tilt toward women was more exaggerated for immigrants born in Germany (64 percent), Finland (62 percent), Lithuania (62 percent), Estonia (60 percent), and Sweden (59 percent), while only Albania (52 percent men) and Greece (51 percent men) had a higher percentage of men, if only by the slightest margins.
Seven of ten European immigrants have strong English-language skills.
In 2010, 33 percent of European immigrants ages 5 and older reported speaking only English, and 38 percent reported speaking English “very well.” In contrast, slightly more than 2 percent of all European immigrants reported not speaking English at all, 17 percent reported speaking English “well,” and 9 percent reported speaking English, but “not well.”
Overall, about 29 percent of European immigrants were Limited English Proficient (LEP), meaning that they reported speaking English less than “very well.” In contrast, 52 percent of all immigrants reported limited English proficiency in 2010.
Rates of English proficiency varied substantially by European country of origin, due in part to large differences in education systems and English language exposure across Europe. Among European immigrants, those from the Ukraine were most likely to be LEP individuals (56 percent), followed by those from Albania (54 percent), Belarus (53 percent), Portugal (52 percent), and Bosnia (52 percent). Among origin countries in which English is not the native language (i.e., excluding the United Kingdom and Ireland), the highest rates of English proficiency (speaking only English or speaking English “very well”) for European immigrants occurred among those from Denmark (94 percent), the Netherlands (94 percent), Sweden (93 percent), Austria (91 percent), and Germany (91 percent).
European-born adults were more likely than the U.S. born to have a bachelor’s degree or higher level of education.
In 2010, 36 percent of European-born adults ages 25 and older had a bachelor’s degree or higher, compared to 28 percent of native-born adults and 27 percent of all foreign-born adults.
Among those who did not obtain at least a high school diploma or equivalent credential, the European born more closely resemble the native born than the foreign born overall. In 2010, almost one-third (32 percent) of immigrants overall had not obtained this credential, compared to 15 percent of European-born adults and 11 percent of native-born adults. The share of the European born who reported their highest educational attainment as a high school diploma or some college (48 percent) was higher than that of the foreign born overall (41 percent), but lower than that of the native born (61 percent).
Levels of educational attainment, however, vary widely among European-origin countries. The top European-origin countries from which immigrants reported having a bachelor’s degree or higher were Russia (60 percent), Sweden (57 percent), France (57 percent), Belarus (56 percent), and Finland (55 percent). Yet nearly half of immigrants from Portugal (47 percent) lacked a high school diploma, as did more than one-third of immigrants from Italy and Greece (36 percent each).
More than one-fifth of employed European-born men worked in management, business, and finance, while 18 percent of European women worked in service and personal care occupations.
The top three occupations that employed European-born male workers ages 16 to 64 were management, business, and finance (21 percent of all 1.1 million European male workers); construction, extraction, and transportation (18 percent); and manufacturing, installation, and repair (12 percent). For more on the demographic profile of European immigrant professionals, see this MPI report.
Compared to male immigrants overall, European-born male workers were more likely to report working in management, business, and finance; information technology; other sciences and engineering; education, training, and media, and entertainment; and sales (see Table 2).
Among the 1 million European-born female workers ages 16 to 64, 18 percent reported working in service occupations; 16 percent in management, business, and finance; and 16 percent in administrative support occupations.
Compared to female immigrants overall, European-born female workers were more likely to report working in management, business, and finance; education, training, and media, and entertainment; and administrative support (see Table 2).
|
|
|||||||||||||||||||||||||||||||||||||||||||||||||||||||||||||||||||||||||||||||||||||||||||||||||
|
|||||||||||||||||||||||||||||||||||||||||||||||||||||||||||||||||||||||||||||||||||||||||||||||||
The European born were less likely to live in poverty in 2010 than the native or foreign born overall.
In 2010, a smaller share of European immigrants (10 percent) lived in households with an annual income below the official federal poverty line than the native born (15 percent) and immigrants overall (19 percent).
There were significant differences between origin countries with respect to the share living in poverty. For example, immigrants from Croatia (5 percent), the Netherlands (6 percent), and Estonia (6 percent) were less likely than European immigrants overall to live below the federal poverty line. In contrast, immigrants from some countries were significantly more likely to live below the poverty line: Ukraine (18 percent), Belarus (17 percent), and Albania (16 percent).
About 1.4 million children under the age of 18 resided in a household with at least one immigrant parent born in Europe.
The 1.4 million children with at least one European-born parent represented 8 percent of the 16.9 million children under 18 in immigrant families. Similar to the overall population of children with immigrant parents, the vast majority of children in European immigrant families were U.S. born (about 86 percent of each population).
Note: Includes children who reside with at least one parent and households where either the household head or spouse is an immigrant born in Europe.
Sources
U.S. Census Bureau, 2010 American Community Survey (ACS), Table B05006, "Place of Birth for the Foreign-Born Population" and Table C05006, "Place of Birth for the Foreign-Born Population."
U.S. Department of Homeland Security, Office of Immigration Statistics. 2010 and 2011 Yearbook of Immigration Statistics, various tables. Available Online.
Authors’ analysis of the U.S. Census Bureau’s 2010 ACS. Accessed from Steven Ruggles, J. Trent Alexander, Katie Genadek, Ronald Goeken, Matthew B. Schroeder, and Matthew Sobek. Integrated Public Use Microdata Series: Version 5 [Machine-readable database]. Minneapolis, MN: Minnesota Population Center [producer and distributor], 2010. Available online.