

Filipino Immigrants in the United States

Click here for a larger version of map.
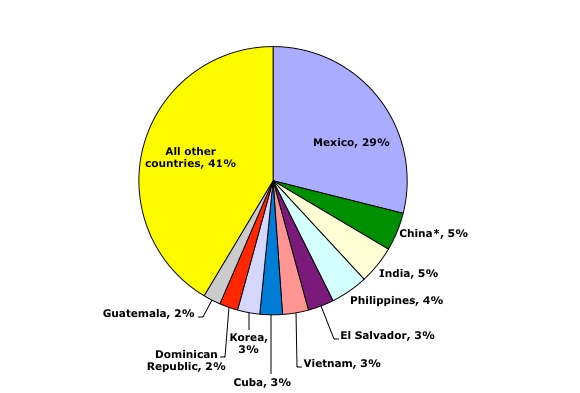
Over the past 50 years, the share of immigrants from the Philippines in the United States has grown modestly from just over 1 percent of the overall U.S. foreign-born population in 1960 to more than 4 percent in 2011. Filipinos now represent the fourth largest immigrant group in the United States by country of origin behind Mexico, China, and India.
|
Ten Source Countries with the Largest Populations in the United States as Percentages of the Total Foreign-Born Population: 2011
|
||
|
As a group, immigrants from the Philippines are better educated, more likely to have strong English language skills, more likely to be naturalized citizens, less likely to enter the United States as refugees or asylum seekers, and less likely to live below the federal poverty line than the overall foreign-born population. Working Filipino-born men and women are more likely to be employed in the healthcare sector than foreign-born workers overall. Yet despite some differences, Filipinos mirrored trends in the overall foreign-born population in terms of age and arrival period.
This article reports on a wide range of characteristics of Filipino immigrants residing in the United States, including the population's size, geographic distribution, admission categories, and demographic and socioeconomic characteristics. Data are from the U.S. Census Bureau's 2011 American Community Survey (ACS), the 2000 Decennial Census (as well as earlier censuses), and the Department of Homeland Security's (DHS) Office of Immigration Statistics (OIS).
Size and Geographic Distribution
- In 2011, over 1.8 million Filipino immigrants resided in the United States, representing more than 4 percent of all immigrants.
- Forty-five percent of all Filipino immigrants resided in California.
- One-third of all Filipino-born immigrants lived in three major metropolitan areas: greater Los Angeles, San Francisco, and New York.
Modes of Entry and Legal Status
- In 2011, more than 57,000 Filipino-born immigrants were granted U.S. legal permanent residency (LPR status, also known as obtaining a green card).
- Filipino nationals accounted for less than 1 percent of persons granted asylum in 2011.
- More than 42,500 Filipino-born immigrants became U.S. citizens through naturalization in 2011.
- The share of Filipino-born immigrants who have naturalized (65 percent) is significantly greater than the share of all U.S. immigrants (45 percent) who have naturalized.
- About 56 percent of Filipino-born green card holders in 2011 were eligible to naturalize.
- In early 2011, 2 percent of all unauthorized immigrants in the United States were from the Philippines.
|
Definitions
|
||
|
Demographic and Socioeconomic Overview
- Filipino immigrant women far outnumbered their male counterparts in 2011.
- The foreign born from the Philippines were more likely than the native born, but slightly less likely than the foreign born overall, to be of working age.
- Over two-thirds of all Filipino immigrants have strong English-language skills.
- As a group, Filipino-born adults were more likely to be university graduates compared to all immigrant and U.S.-born adults.
- Filipino-born immigrants have generally mirrored the arrival patterns of the foreign born overall.
- Nearly 17 percent of employed Filipino-born men worked in service and personal care occupations, while more than 18 percent of Filipina women worked as registered nurses.
- The Filipino born were less likely to live in poverty in 2011 than the native or foreign born overall.
- About 617,000 children under the age of 18 resided in a household with at least one immigrant parent born in the Philippines.
Size and Geographic Distribution
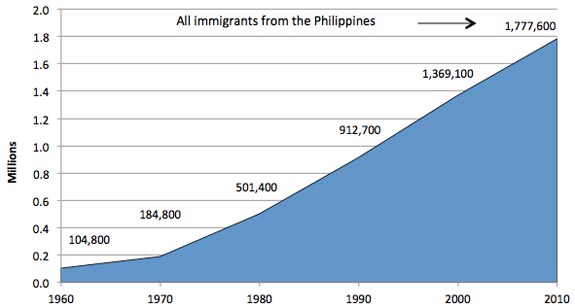
In 2011, over 1.8 million Filipino immigrants resided in the United States, representing more than 4 percent of the foreign-born population.
Filipino-born immigrants accounted for 4.5 percent (1.8 million) of the country's 40.4 million immigrants in 2011. This population has grown 17 times its size since 1960, when an estimated 104,800 Filipino immigrants resided in the United States, or just over 1 percent of all immigrants that year.
Although the Filipino-born share of all Asian immigrants in the United States has been declining since 1970, their overall number has been steadily increasing since 1960 (see Table 1). The Filipino-born share of the U.S. immigrant population has hovered around 4.5 percent since 1990.
|
|
|||||||||||||||||||||||||||||||||||||||||||||||||||||
|
|||||||||||||||||||||||||||||||||||||||||||||||||||||
|
|
||
|
Forty-five percent of all Filipino immigrants resided in California.
California had the largest number of Filipino immigrants in 2011 (811,900, or 45 percent of the nation's 1.8 million immigrants from the Philippines), followed by Hawaii (112,200, or 6 percent).
Other states with Filipino-born populations greater than 80,000 were New Jersey (86,600, or 5 percent); Texas (86,400, or 5 percent); Illinois (84,800, or 5 percent); and New York (84,400, or 5 percent).
Filipino-born immigrants are dispersed across the United States, but account for a significant share of the total immigrant population in certain states: Forty-six percent (112,000 out of 246,000) of all immigrants in Hawaii were born in the Philippines, as were 26 percent (13,500 out of 51,600) in Alaska.
One-third of all Filipino-born immigrants lived in three major metropolitan areas: greater Los Angeles, San Francisco, and New York.
In 2011, the greater Los Angeles metropolitan area had the largest number of Filipino immigrants, with about 288,400 (16 percent of Filipino born in the United States). The greater San Francisco area was second with 156,400 (9 percent). The greater New York area (which includes parts of New Jersey and Pensylvania) was third with 150,500 (8 percent).
Other greater metropolitan areas with Filipino-born populations greater than 60,000 were San Diego (96,000, or 5 percent); Honolulu (79,800, or 4 percent); Chicago (78,400, or 4 percent); and San Jose (61,400, or 3 percent).
In terms of share of total immigrant population, Filipinos made up 43 percent of all immigrants in Honolulu, HI (79,800 out of 186,300); over 32 percent in the Vallejo, CA area (26,700 out of 82,200); and 20 percent in the Virginia Beach, VA area (20,600 out of 102,200).
Modes of Entry and Legal Status
Note: This section is based on the data from DHS, unless stated otherwise. DHS data refer to the U.S. government's fiscal year, October 1 through September 30. Thus, "2011" refers to October 1, 2010 through September 30, 2011.
In 2011, more than 57,000 Filipino-born immigrants were granted U.S. legal permanent residency (LPR status, also known as obtaining a green card).
In 2011, 57,011 Filipino immigrants obtained green cards, accounting for 5 percent of the 1.1 million immigrants granted LPR status that year. The foreign born from the Philippines gained LPR status mostly through family reunification. About 87 percent obtained green cards through family relationships, 13 percent through employment, and less than 1 percent through other routes, including a small number of refugees or asylees.
About 51 percent of all Filipino immigrants granted LPR status in 2011 qualified as the immediate family member (spouse, unmarried child under 21, or parent) of a U.S. citizen, compared to 43 percent of all immigrants. Less than 0.1 percent of all Filipino-born immigrants entered as refugees or asylees, compared to 16 percent of all immigrants.
- Read more about immigrants who became LPRs in 2011 in Green Card Holders and Legal Immigration to the United States.
Filipino nationals accounted for less than 1 percent of persons granted asylum in 2011.
Only 10 Filipino nationals (0.04 percent of the total) received asylum in 2011. From 2002 through 2011, Filipino nationals accounted for 0.1 percent (314) of the 260,951 individuals granted asylum. No Filipino nationals arrived in the United States as refugees in 2011.
- Read more about Refugees and Asylees in the United States.
More than 42,500 Filipino-born immigrants became U.S. citizens through naturalization in 2011.
In 2011, 42,520 Filipino-bornimmigrants were naturalized in the United States, representing 6 percent of the 694,193 new U.S. citizens.
The share of Filipino-born immigrants who have naturalized (65 percent) is significantly greater than the share of all U.S. immigrants who have naturalized.
According to the 2011 ACS, about 65 percent of Filipino immigrants were naturalized U.S. citizens. This was significantly greater than the estimated share among all immigrants, which was about 45 percent.
About 56 percent of Filipino-born green card holders in 2011 were eligible to naturalize.
DHS' Office of Immigration Statistics (OIS) estimates that 330,000 Filipino-born LPRs, or about 56 percent of the total 590,000 Filipino-born LPRs, were eligible to naturalize as of 2011. The Filipino born accounted for about 4 percent of the total 8.5 million LPRs eligible to naturalize as of 2011.
- For more, see OIS' Estimates of the Legal Permanent Resident Population in 2011.
In early 2011, 2 percent of all unauthorized immigrants in the United States were from the Philippines.
OIS estimated that in January 2011, 270,000 (2 percent) of the approximately 11.5 million unauthorized migrants were born in the Philippines.
- For more, see OIS' Estimates of the Unauthorized Immigrant Population Residing in the United States: January 2011.
Demographic and Socioeconomic Overview
Note: This section is based on the authors' analysis the 2011 ACS data.
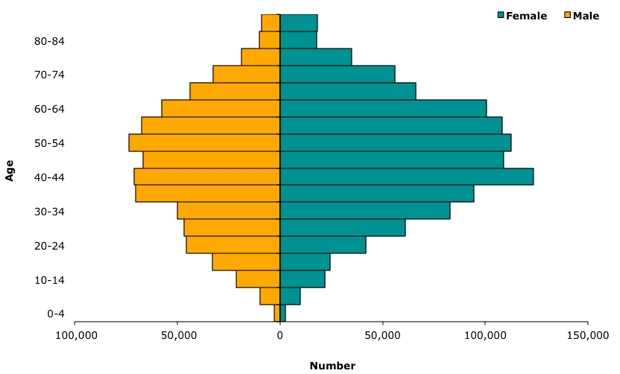
Filipino immigrant women far outnumbered their male counterparts in 2011.
Of all Filipino immigrants residing in the United States in 2011, 60 percent were women and 40 percent men. By contrast, gender distributions were more balanced among the native born and overall foreign born (about 51 percent female and 49 percent male for both groups).
|
Filipino-Born Population, by Age and Sex, for the United States: 2011
|
||
|
|
Native Population, by Age and Sex, for the United States: 2011
|
||
|
|
Native Population, by Age and Sex, for the United States: 2011
|
||
|
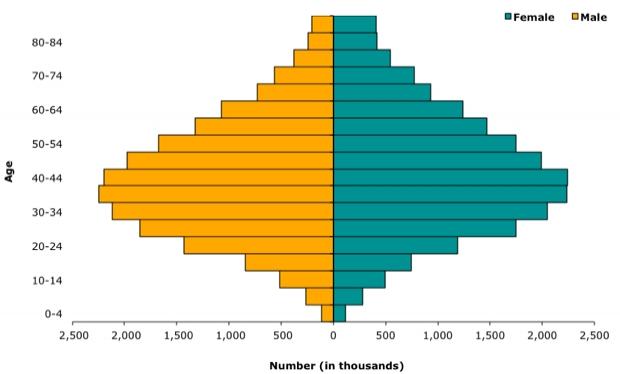
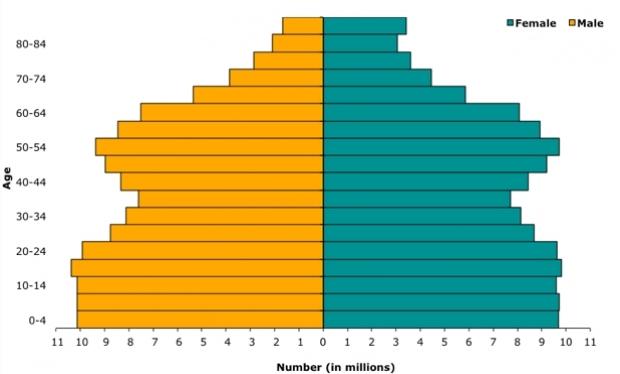
The foreign born from the Philippines were more likely than the native born, but slightly less likely than the foreign born overall, to be of working age.
Of the Filipino born residing in the United States in 2011, 79 percent were of working age (16-64 years old), compared with 63 percent of the native born and 82 percent of all immigrants. Among Filipino immigrants, 17 percent were older than 64, compared to 13 percent of the native- and foreign-born populations.
Over two-thirds of all Filipino immigrants have strong English-language skills.
In 2011, 14 percent of Filipino immigrants ages 5 and older reported speaking only English, and 55 percent reported speaking English "very well." In contrast, less than 1 percent of all Filipino immigrants reported not speaking English at all, 7 percent reported speaking English, but "not well," and 24 percent reported speaking English "well."
Compared to immigrants overall, Filipino immigrants were less likely to be Limited English Proficient (LEP), meaning that they reported speaking English less than "very well." In 2011, 31 percent of those born in the Philippines were LEP, versus 51 percent of all immigrants.
Note: In the American Community Survey, respondents who reported that they spoke a language other than English at home were asked to self-assess their English-speaking abilities with the options of "not at all," "not well," or "well," and "very well."
As a group, Filipino-born adults were more likely to be university graduates compared to all immigrant and U.S.-born adults.
In 2011, 48 percent of Filipino-born adults ages 25 and older had a bachelor's degree or higher, which is substantially greater than the 27 percent share of immigrant adults and the 29 percent share of all U.S.-born adults.
Only 8 percent of Filipino-born adults had no high school or GED diploma, compared to 31 percent of immigrants overall and 11 percent of native-born adults. The share of the Filipino born who reported their highest educational attainment as a high school diploma, some college credits, or an associate's degree (43 percent) was slightly higher than the foreign born overall (41 percent), but lower than that of the native born (61 percent).
Filipino-born immigrants have generally mirrored the arrival patterns of the foreign born overall.
In 2011, approximately 34 percent of the 1.8 million Filipino immigrants in the United States had entered after 2000; 24 percent arrived between 1990 and 1999; 22 percent entered between 1980 and 1989; and 21 percent entered prior to 1980.
This arrival pattern generally mirrored that of immigrants in the United States overall: 36 percent had arrived after 2000; 27 percent arrived between 1990 and 1999; 18 percent entered between 1980 and 1989; and 19 percent entered prior to 1980.
Nearly 17 percent of employed Filipino-born men worked in service and personal care occupations, while more than 18 percent of Filipina women worked as registered nurses.
The top three occupations that employed Filipino-born male workers ages 16 to 64 were service and personal care (17 percent of all 427,000 Filipino male workers); manufacturing, installation and repair (13 percent); and administrative support (12 percent).
Compared to working immigrant men overall, Filipino men were more likely to report working in the healthcare sector — specifically as registered nurses, other healthcare practicioners, and in healthcare support occupations — and in administrative support occupations. They were less likely to report working in farming, fishing, and forestry; and construction, extraction, and transportation occupations than immigrant men overall (see Table 2).
Among the 624,000 Filipino-born female workers ages 16 to 64, 18 percent reported working as registered nurses; 16 percent in administrative support; and 15 percent in service and personal care occupations.
Filipina women were more likely to report working in the healthcare sector as registered nurses, other healthcare practicioners, and in healthcare support operations than working immigrant women overall (see Table 2). They were less likely to report working in education, training, media, and entertainment occupations; service and personal care; and manufacturing, installation, and repair occupations.
|
|
|||||||||||||||||||||||||||||||||||||||||||||||||||||||||||||||||||||||||||||||||||||||||||||||||
|
|||||||||||||||||||||||||||||||||||||||||||||||||||||||||||||||||||||||||||||||||||||||||||||||||
The Filipino born were less likely to live in poverty in 2011 than the native or foreign born overall.
In 2011, a significantly smaller share of Filipino immigrants (6 percent) lived in households with an annual income below the official federal poverty line than the native born (15 percent) and immigrants overall (20 percent).
About 617,000 children under the age of 18 resided in a household with at least one immigrant parent born in the Philippines.
The 617,000 children with at least one Filipino-born parent represented close to 4 percent of the overall population of children from immigrant households (17.1 million children). Similar to the overall population of children from immigrant households, the vast majority of children in Filipino immigrant families were born in the United States (about 87 percent for the overall population, and 84 percent of those in Filipino immigrant families).
Note: Includes only children who reside with at least one parent who is foreign born. Excludes families with U.S.-born parents with foreign adopted children.
For more information about ACS data and methodology, click here.
Sources
U.S. Census Bureau. 2011. 2011 American Community Survey (ACS), Table B05006, Place of Birth for the Foreign-Born Population. Available online.
U.S. Department of Homeland Security, Office of Immigration Statistics. 2011. 2011 Yearbook of Immigration Statistics, various tables. Available online.
Authors' analysis of the U.S. Census Bureau's 2011 ACS. Accessed from Steven Ruggles, J. Trent Alexander, Katie Genadek, Ronald Goeken, Matthew B. Schroeder, and Matthew Sobek. Integrated Public Use Microdata Series: Version 5 [Machine-readable database]. Minneapolis, MN: Minnesota Population Center [producer and distributor], 2010. Available online.