

Filipino Immigrants in the United States

The Philippines was the fourth largest country of origin of immigrants in the United States in 2013. (Photo: Marianne Masculino)
Filipino immigrants constitute one of the largest foreign-born groups in the United States. Since 1990, the Philippines has been consistently among the top five countries of origin, and was the fourth largest in 2013, accounting for 4.5 percent of the 41.3 million total immigrant population in the United States.
Three major waves characterize the history of Filipino immigration to the United States. Following the U.S. annexation of the Philippines in 1899, the United States began sponsoring select Filipino students to study at U.S. colleges and universities. Over the next three decades, increasing numbers of Filipinos migrated to the western part of the country, largely California and Hawaii (then a U.S. territory), to fill agricultural labor shortages once occupied by Chinese and Japanese laborers. Filipino migration was made easier by their status as U.S. nationals, as they were not subject to the restrictions faced by other non-European groups in the early 20th century.
By 1934, Filipino migration to the United States slowed dramatically due to both the Great Depression and the passing of the Tydings-McDuffie Act. The act, which committed the U.S. to grant Philippine independence by 1945, also placed unprecedented quotas on immigration from the islands to only 50 per year. By 1945, many in the United States viewed Filipinos as loyal allies in World War II, and the quotas were doubled in 1946 (to 100 per year).
The second wave of Filipino immigration began in the aftermath of World War II. Many more than 100 Filipinos arrived annually outside the quota, primarily as “war brides” to U.S. servicemen and as recruits into the U.S. armed forces, particularly the U.S. Navy. In addition, an increasing number of Filipinos arrived in the United States to train as nurses and other health-care workers. While the postwar period saw a modest influx of Filipinos, particularly higher-educated professionals, their numbers grew considerably in the third major wave of immigration after 1965.
The Filipino immigrant community in the United States jumped from 105,000 in 1960 (1.1 percent of all immigrants) to 1,844,000 in 2013 (4.5 percent). Some of this increase is a direct result of the Immigration and Nationality Act’s removal of the national-origin system in 1965, but some is also related to long-established governmental and business relationships between the two countries, economic and educational opportunities in the United States, and a general culture of migration in the Philippines that encourages and helps facilitate both labor migration to and remittances from the United States and elsewhere. While the number of Filipino immigrants has risen alongside other Asian groups since 1965, their unique historical experience as former nationals, close historic ties to the U.S. military, and prevalence in health-care professions sets Filipino immigrants apart from the other top five immigrant groups: Mexicans, Indians, Chinese, and Vietnamese.
Figure 1. Filipino Immigrant Population, 1980-2013
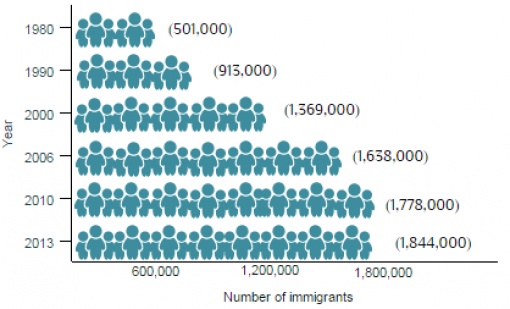
Source: Data from U.S. Census Bureau 2006, 2010, and 2013 American Community Survey (ACS), and Campbell J. Gibson and Emily Lennon, “Historical Census Statistics on the Foreign-born Population of the United States: 1850-2000” (Working Paper no. 29, U.S. Census Bureau, Washington, DC, February 1999), www.census.gov/population/www/documentation/twps0029/twps0029.html.
The Filipino immigrant population is the third largest foreign-born population from Asia, after India and China. Click here to view how the number of immigrants from the Philippines has changed over time.
Although most Filipino migrants settle in the United States, others reside in Saudi Arabia (1,029,000), the United Arab Emirates (477,000), Canada (364,000), and Japan (226,000). Click here to see where migrants from the Philippines have settled worldwide.
Today, most Filipino immigrants in the United States obtain lawful permanent residence (LPR)—also known as receiving a “green card”—through family reunification channels, either as immediate relatives of U.S. citizens or as other family-sponsored immigrants. Many also receive LPR status through employment-based channels.
Compared to the total foreign-born population in the United States, Filipino immigrants were more likely to have strong English-language skills and be college educated. They were also more likely to be naturalized U.S. citizens, have higher income and lower poverty rates, and were less likely to be uninsured.
Definitions
The U.S. Census Bureau defines the foreign born as individuals who had no U.S. citizenship at birth. The foreign-born population includes naturalized citizens, lawful permanent residents, refugees and asylees, legal nonimmigrants (including those on student, work, or other temporary visas), and persons residing in the country without authorization.
The terms foreign born and immigrant are used interchangeably and refer to those who were born in another country and later emigrated to the United States. Data collection constraints do not permit inclusion of those who gained Filipino citizenship via naturalization and later moved to the United States.
Using the most recent data from the U.S. Census Bureau’s American Community Survey (ACS), the Department of Homeland Security’s (DHS) Yearbook of Immigration Statistics, and the World Bank’s Annual Remittance Data, this Spotlight provides information on the Filipino immigrant population in the United States, focusing on the size, geographic distribution, and socioeconomic characteristics of the population.
- Distribution by State and Key Cities
- English Proficiency
- Age, Education, and Professional Attainment
- Income and Poverty
- Immigration Pathways and Naturalization
- Health Coverage
- Diaspora
- Remittances
Distribution by State and Key Cities
By far, most immigrants from the Philippines have settled in California (45 percent), followed at a distant second by Hawaii (6 percent). The remaining four most populous states (New York, New Jersey, Illinois, and Texas) each represent only 1 percent of the Filipino immigrant population. The top four counties with Filipino immigrants were Los Angeles and San Diego counties in California, Clark County in Nevada, and Honolulu County in Hawaii. Together the top four counties comprised 26 percent of the Filipino immigrant population in the United States.
Figure 2. Top Destination States for Filipino Immigrants in the United States, 2009-13
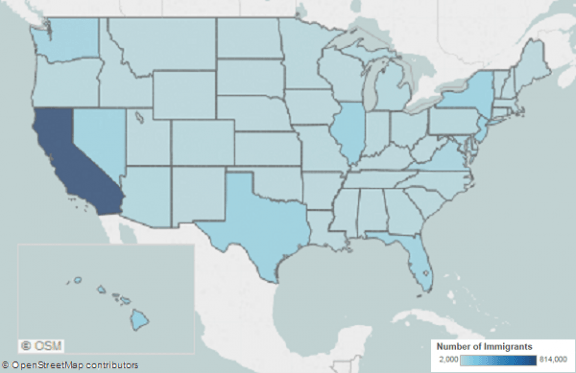
Note: Pooled 2009-13 ACS data were used to get statistically valid estimates at the state level for smaller population geographies.
Source: Migration Policy Institute (MPI) tabulation of data from U.S. Census Bureau pooled 2009-13 American Community Survey (ACS).
Click here for an interactive map showing the geographic distribution of immigrants by state and county. Select the Philippines from the dropdown menu to see which states and counties have the highest distributions of Filipinos.
In the 2009-13 period, the U.S. cities with the largest number of Filipino immigrants were the greater Los Angeles, San Francisco, and New York metropolitan areas. These three metropolitan areas accounted for about 33 percent of Filipino immigrants.
Figure 3. Top Metropolitan Destinations for Filipino Immigrants in the United States, 2009-13
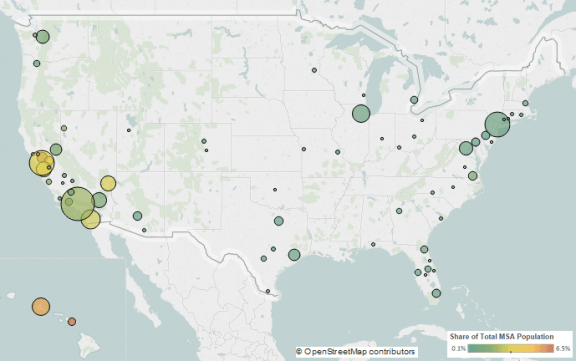
Note: Pooled 2009-13 ACS data were used to get statistically valid estimates at the metropolitan statistical-area level for smaller population geographies.
Source: MPI tabulation of data from U.S. Census Bureau pooled 2009-13 ACS.
Click here for an interactive map that highlights the metropolitan areas with the highest concentration of immigrants. Select the Philippines from the dropdown menu to see which metropolitan areas have the highest concentration of Filipinos.
Table 1. Top Concentrations by Metropolitan Area for the Foreign Born from the Philippines, 2009-13
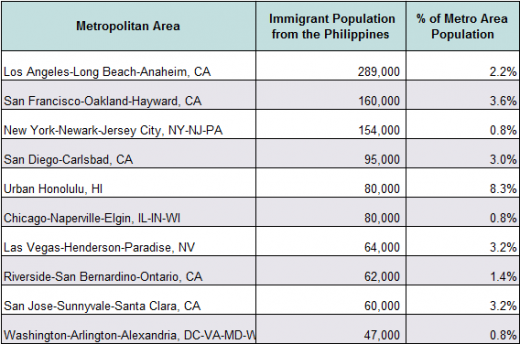
Source: MPI tabulation of data from U.S. Census Bureau pooled 2009-13 ACS.
In 2013, about 30 percent of Filipino immigrants (age 5 and over) reported limited English proficiency, compared with about 50 percent of the foreign born overall.
Note: Limited English proficient refers to those who indicated on the ACS questionnaire that they spoke English less than “very well.”
Age, Education, and Professional Attainment
Filipino immigrants (age 25 and older) had much higher education rates compared to both the native- and total foreign-born populations. In 2013, 48 percent of Filipino immigrants reported achieving at least a bachelor’s degree, compared with about 30 percent of native born and 28 percent of all immigrants. Moreover, the number of Filipinos reporting education at the bachelor’s degree level was significantly higher (40 percent) than both the number of U.S. born (19 percent) and all foreign born (16 percent).
Further, Filipino immigrants were much more likely to have completed at least a high school education than other immigrant groups: 8 percent of Filipino immigrants reported having less than a high school diploma, compared to 30 percent among all foreign-born adults.
Immigrants from the Philippines were slightly older than the overall foreign- and U.S.-born populations. The median age for Filipinos was 49 years, compared with 43 years for all immigrants and 36 years for native born. In 2013, 76 percent of Filipino immigrants were of working age (18 to 64), compared to 80 percent of all foreign born and 60 percent of the native-born population. The percentage of Filipino immigrants below working age was similar to other foreign-born populations and both were much lower than the native-born population (see Table 2). However, Filipino immigrants had a higher share of seniors than both the total immigrant and native-born populations.
Table 2. Age Distribution by Origin, 2013
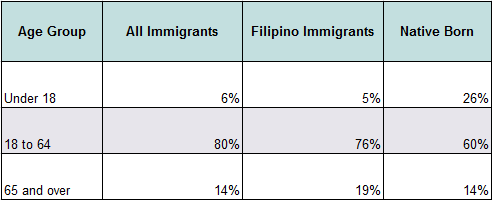
Source: MPI tabulation of data from U.S. Census Bureau 2013 ACS.
Filipino immigrants participated in the labor force at slightly higher rates than both the overall immigrant and U.S.-born populations. In 2013, about 69 percent of Filipino immigrants age 16 and over were in the civilian labor force, compared to 67 percent and 63 percent of all immigrants and native born, respectively. Individuals from the Philippines were more likely to be employed in management, business, science, and arts occupations (43 percent) than either all immigrants (30 percent) or U.S. born (38 percent), and were much less likely to be employed in natural resources, construction, and maintenance occupations (4 percent) than the other two groups. Notably, Filipino immigrant participation in the U.S. armed services parallels the native-born population (about 0.5 percent each), in comparison to the overall foreign-born population (about 0.1 percent). This could be due to a long tradition of Filipino participation in the U.S. Navy in the 20th century.
Figure 4. Employed Workers in the Civilian Labor Force (ages 16 and older) by Occupation and Origin, 2013
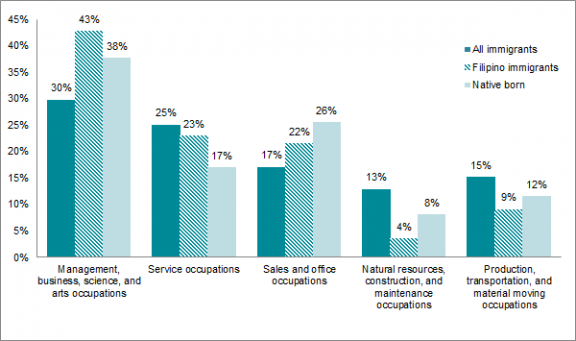
Source: MPI tabulation of data from U.S. Census Bureau 2013 ACS.
Filipino immigrants had much higher incomes compared to the overall foreign- and native-born groups. In 2013, the median income of households headed by a Filipino immigrant was $82,370, versus $48,100 and $53,000 for all immigrant and U.S.-born households, respectively.
Far fewer Filipino immigrants lived in poverty (7 percent) than either the overall foreign- (19 percent) or native-born (15 percent) populations.
Immigration Pathways and Naturalization
Immigrants from the Philippines were much more likely to be naturalized than immigrants overall. As of 2013, about 68 percent of the 1.8 million Filipino immigrants in the United States were naturalized citizens, in comparison to 47 percent of the total foreign-born population.
About 64 percent of all Filipino immigrants arrived before 2000, followed by about 28 percent between 2000 and 2009, and about 9 percent after 2010, which closely parallels the trend of immigrants overall.
Figure 5. Filipino and All Immigrants in the United States by Period of Arrival, 2000-13
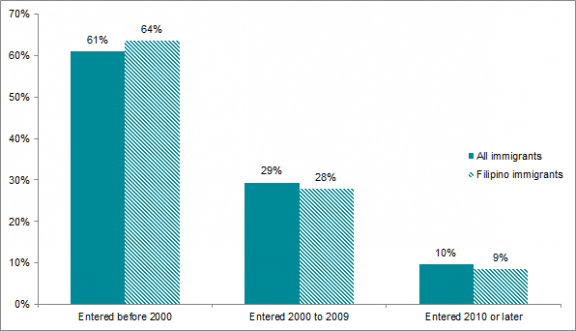
Source: MPI tabulation of data from U.S. Census Bureau 2013 ACS.
In 2013, Filipino immigrants were more likely to become lawful permanent residents (LPRs) through family-sponsored preferences (28 percent) than the overall LPR population (21 percent). They were also more likely to obtain LPR status via the other two most common categories—immediate relatives of U.S. citizens (53 percent vs. 44 percent), and employment-based preferences (19 percent vs. 16 percent) than the overall LPR population. In 2013, very few Filipinos obtained green cards via refugee or asylum status (less than 0.1 percent), compared to 12 percent of the total LPR population.
Figure 6. Immigration Pathways of Filipino Immigrants and All Immigrants in the United States, 2013
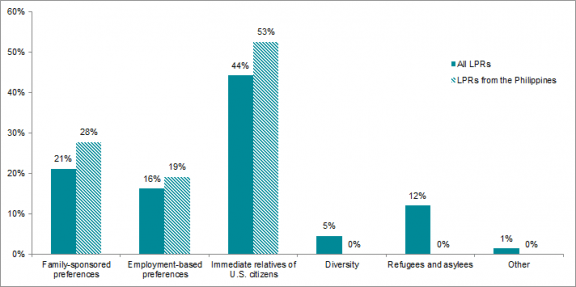
Notes: Family-sponsored: Includes adult children and siblings of U.S. citizens as well as spouses and children of green-card holders. Immediate relatives of U.S. citizens: Includes spouses, minor children, and parents of U.S. citizens. Diversity Visa Lottery: The Immigration Act of 1990 established the Diversity Visa Lottery to allow entry to immigrants from countries with low rates of immigration to the United States. The law states that 55,000 diversity visas are made available each fiscal year. Filipino nationals are ineligible to participate in the DV Lottery.
Source: MPI tabulation of data from U.S. Census Bureau 2013 ACS.MPI tabulation of data from Department of Homeland Security (DHS), 2013 Yearbook of Immigration Statistics (Washington, DC: DHS Office of Immigration Statistics, 2014), www.dhs.gov/publication/yearbook-2013.
Filipino immigrants were more likely to be insured through private health insurance coverage (73 percent) than the native born (67 percent) and far more likely than the overall immigrant population (50 percent). They were slightly more likely to be uninsured (13 percent) than U.S. born (12 percent) but much less likely than the total foreign-born population (32 percent).
Figure 7. Health Coverage for Filipino Immigrants, All Immigrants, and the Native Born, 2013
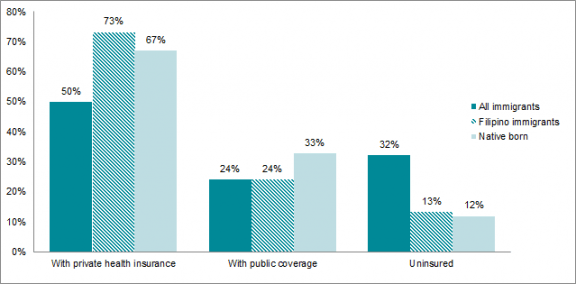
Note: The sum of shares by type of insurance is likely to be greater than 100 because people may have more than one type of insurance.
Source: MPI tabulation of data from the U.S. Census Bureau 2013 ACS.
The Filipino diaspora in the United States is comprised of approximately 3.7 million individuals who were born in the Philippines or reported Filipino ancestry or race, according to tabulations from the U.S. Census Bureau’s pooled 2009-13 ACS.
Global remittances to the Philippines via formal channels equaled USD $25.4 billion in 2013, representing 9 percent of the country’s gross domestic product (GDP), according to data from the World Bank. Remittances sent to the Philippines have seen a 75-fold increase since 1977.
Figure 8. Annual Remittance Flows to Philippines, 1977-2013
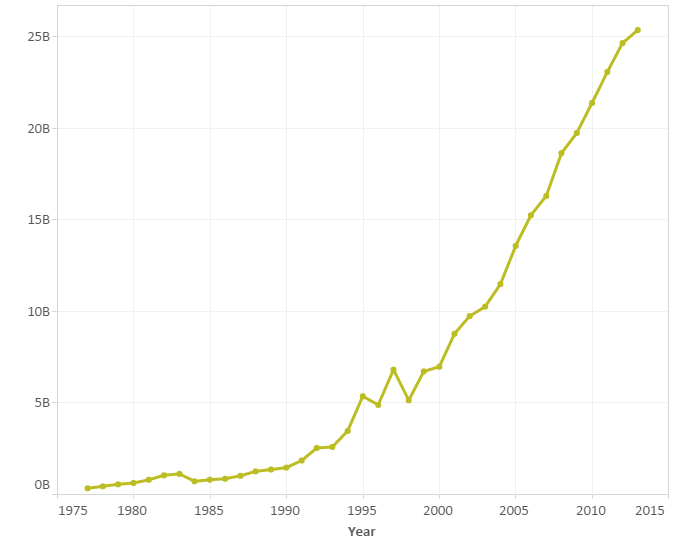
Source: MPI tabulations of data from the World Bank Prospects Group, “Annual Remittances Data,” April 2015 update.
Visit the Data Hub’s collection of interactive remittances tools, which track remittances by inflow and outflow, between countries, and over time.
Sources
Asis, Marjuna M.B. 2006. The Philippines Culture of Migration. Migration Information Source, January 1, 2006. Available Online.
Ceniza Choy, Catherine. 2003. Empire of Care: Nursing and Migration in Filipino American History. Durham, NC: Duke University Press.
Daniels, Roger. 2002. Coming to America: A History of Immigration and Ethnicity in American Life. New York, NY: Harper Collins.
Department of Homeland Security (DHS), Office of Immigration Statistics. 2014. 2013 Yearbook of Immigration Statistics. Washington, DC: DHS Office of Immigration Statistics. Available Online.
Gibson, Campbell J. and Emily Lennon. 1999. Historical Census Statistics on the Foreign-born Population of the United States: 1850-2000. Working Paper no. 29, U.S. Census Bureau, Washington, DC, February, 1999. Available Online.
Le Espiritu, Yen. 1995. Filipino American Lives. Philadelphia: Temple University Press.
O’Neil, Kevin. 2004. Labor Export as Government Policy: The Case of the Philippines. Migration Information Source, January 1, 2004. Available Online.
U.S. Census Bureau. 2013. 2013 American Community Survey. American Fact Finder. Available Online.
World Bank Prospects Group, 2015. Annual Remittances Data, April 2015 update. Available Online.
Yang, Dean. 2004. How Remittances Help Migrant Families. Migration Information Source, December 1, 2004. Available Online.