

Filipino Immigrants in the United States

Filipina women wave flags at the Pistahan Parade in San Francisco, which celebrates Filipino-American culture. (Photo: Romel Jacinto)
Migration from the Philippines to the United States began in the late 19th century and has ebbed and flowed since then, in response to evolving government and business relationships between the two countries and changing U.S. immigration policy. In 2016, more than 1.9 million Filipinos lived in the United States, accounting for roughly 4 percent of the country’s 44 million immigrants. Between 1980 and 2016, the Filipino population in the United States nearly quadrupled, rising from 501,000 to 1.9 million. The Philippines, which was the second-largest origin country for immigrants in 1990, was overtaken by India and China during the early 2000s and since 2010 has ranked fourth, after Mexico, India, and China.
After the U.S. annexation of the Philippines in 1899, large numbers of Filipinos migrated to the United States to study or to fill agricultural jobs, primarily in California and Hawaii. As U.S. nationals, Filipinos were not subject to the same restrictions imposed on other non-European groups. Arrivals slowed dramatically following the Great Depression and passage of the Tydings-McDuffie Act in 1934, which set the Philippines on a track to independence after ten years and imposed strict immigration quotas on the islands of just 50 immigrants per year. However, after World War II larger numbers began arriving, primarily as “war brides” of U.S. servicemen and as recruits into the armed forces, though some also came to train as health-care workers.
Starting in the 1960s, the Filipino immigrant population grew rapidly, in part a result of the 1965 Immigration Act’s removal of national-origin quotas. But this growth was also influenced by longstanding government, military, economic, and educational ties between the two countries, as well as Philippine policy that encourages and facilitates labor migration for development purposes. The unique historical experience of having once been U.S. nationals sets Filipinos apart from other immigrant groups that have arrived in large numbers since 1965.
Figure 1. Filipino Immigrant Population in the United States, 1980-2016
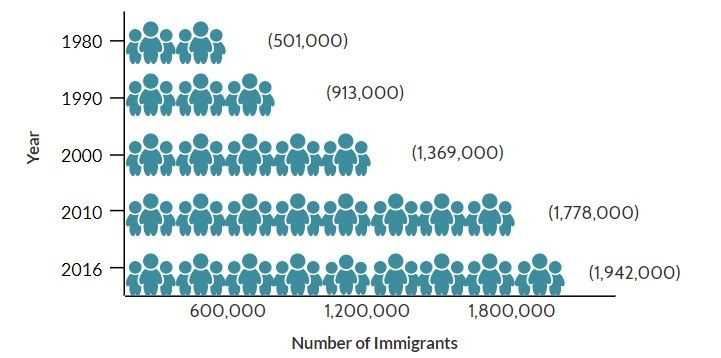
Sources: Data from U.S. Census Bureau 2010 and 2016 American Community Surveys (ACS), and Campbell J. Gibson and Kay Jung, "Historical Census Statistics on the Foreign-born Population of the United States: 1850-2000" (Working Paper no. 81, U.S. Census Bureau, Washington, DC, February 2006), available online.
The United States is home to by far the largest number of Filipinos abroad. Other top destinations include Saudi Arabia (584,000), the United Arab Emirates (539,000), Canada (528,000), Japan (239,000), and Australia (233,000), according to mid-2017 United Nations Population Division estimates.
Click here to view an interactive map showing where migrants from the Philippines and other countries have settled worldwide.
Today, most Filipinos in the United States who obtain lawful permanent residence (LPR status, also known as getting a green card) do so through family reunification channels, either as immediate relatives of U.S. citizens or through other family-sponsored channels. Many also get green cards through employment preferences. Meanwhile, Filipinos are more likely than other immigrants to have strong English skills, and have much higher college education rates than the overall foreign- and U.S.-born populations. They are also more likely to be naturalized U.S. citizens than other immigrant groups, have higher incomes and lower poverty rates, and are less likely to be uninsured.
Using data from the U.S. Census Bureau (the most recent 2016 American Community Survey [ACS] as well as pooled 2012-16 ACS data) and the Department of Homeland Security’s Yearbook of Immigration Statistics, this Spotlight provides information on the Filipino immigrant population, focusing on its size, geographic distribution, and socioeconomic characteristics.
Click on the bullet points below for more information:
- Distribution by State and Key Cities
- English Proficiency
- Age, Education, and Employment
- Income and Poverty
- Immigration Pathways and Naturalization
- Health Coverage
- Diaspora
- Remittances
Distribution by State and Key Cities
In the 2012-16 period, immigrants from the Philippines were highly concentrated in California (44 percent), followed distantly by Hawaii (6 percent). The next four most populous states—Texas, New York, Illinois, and New Jersey—were home to 19 percent of the Filipino population collectively. The top four counties by Filipino concentration were Los Angeles and San Diego counties in California, Honolulu County in Hawaii, and Clark County in Nevada. Together these counties accounted for 26 percent of Filipinos in the United States.
Figure 2. Top States of Residence for Filipinos in the United States, 2012-16
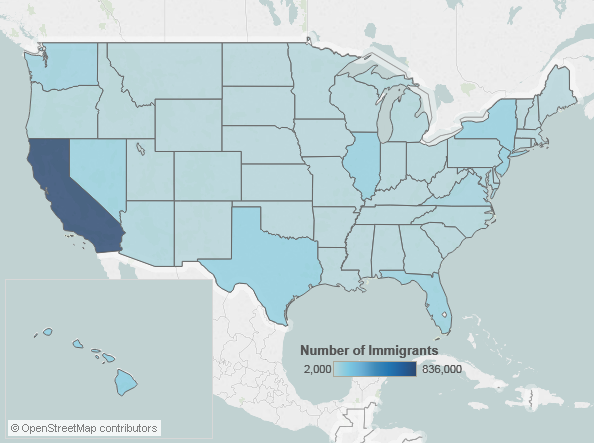
Note: Pooled 2012-16 ACS data were used to get statistically valid estimates at the state level for smaller-population geographies. Not shown is the population in Alaska, which is small in size; for details, visit the Migration Policy Institute (MPI) Data Hub for an interactive map showing geographic distribution of immigrants by state and county, available online.
Source: MPI tabulation of data from U.S. Census Bureau pooled 2012-16 ACS.
As of 2012-16, the U.S. cities with the largest number of Filipinos were the greater Los Angeles, San Francisco, and New York metropolitan areas. These three metro areas accounted for about 32 percent of Filipinos in the United States.
Figure 3. Top Metropolitan Areas of Residence for Filipinos in the United States, 2012-16
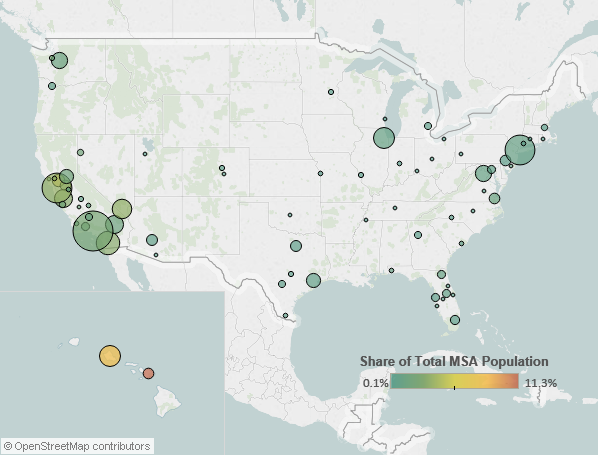
Note: Pooled 2012-16 ACS data were used to get statistically valid estimates at the metropolitan statistical-area level for smaller-population geographies.
Source: MPI tabulation of data from U.S. Census Bureau pooled 2012-16 ACS.
Table 1. Top Concentrations by Metropolitan Area for Filipinos, 2012-16
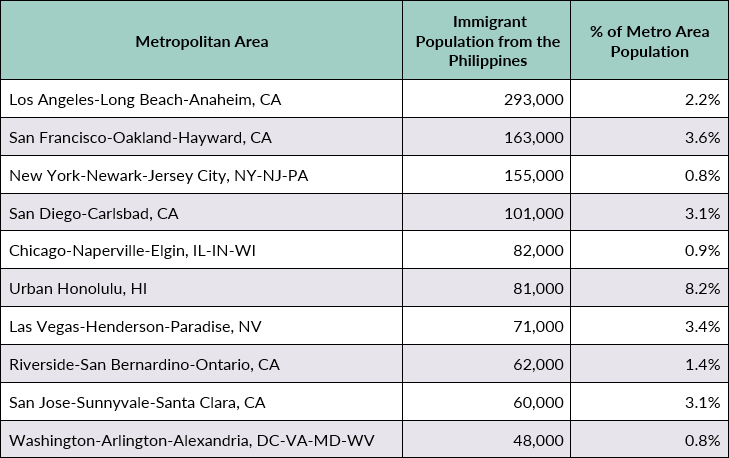
Source: MPI tabulation of data from the U.S. Census Bureau pooled 2012-16 ACS.
Click here for an interactive map that highlights the metropolitan areas with the highest concentrations of immigrants from the Philippines and other countries.
Filipino immigrants are much more likely to be proficient in English than the overall foreign-born population. In 2016, about 30 percent of Filipinos ages 5 and over reported limited English proficiency (LEP), compared to 49 percent of all immigrants. Approximately 15 percent of Filipinos spoke only English at home, versus 16 percent of the foreign born.
Note: Limited English proficient refers to those who indicated on the ACS questionnaire that they spoke English less than “very well.”
Age, Education, and Employment
In 2016, Filipinos were older than the overall foreign- and U.S.-born populations. The Filipino median age was 50 years, compared to 44 years for all immigrants and 36 years for native born. This is largely due to the disproportionately high number of Filipino seniors: 22 percent of Filipinos were 65 or older, versus 15 percent of both the overall foreign- and native-born populations. Meanwhile, Filipinos were more likely than the native born but somewhat less likely than the overall foreign born to be of working age (18 to 64; see Figure 4).
Figure 4. Age Distribution of the U.S. Population by Origin, 2016
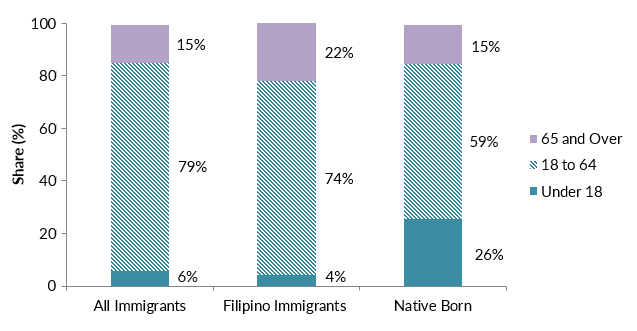
Note: Numbers may not add up to 100 as they are rounded to the nearest whole number.
Source: MPI tabulation of data from the U.S. Census Bureau 2016 ACS. Click here to view an interactive chart showing the age and sex distribution of the top immigrant groups, including Filipinos.
Filipinos ages 25 and over have much higher education rates compared to both the native- and overall foreign-born populations. Half of Filipino immigrants reported having at least a bachelor’s degree during the period surveyed, compared to about 32 percent of the U.S. born and 30 percent of all immigrants.
Filipinos participate in the labor force at a slightly higher rate than other groups. In 2016, about 67 percent of Filipinos ages 16 and over were in the civilian labor force, compared to 66 percent of all immigrants and 62 percent of the native born. Further, Filipinos were more likely to be employed in management, business, science, and arts occupations than both groups (see Figure 5).
Figure 5. Employed Workers in the Civilian Labor Force (ages 16 and older) by Occupation and Origin, 2016
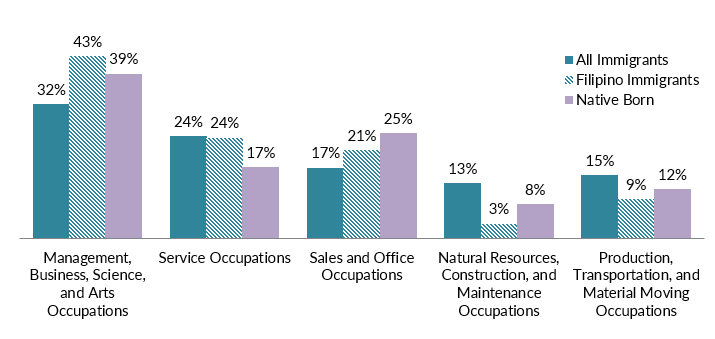
Source: MPI tabulation of data from the U.S. Census Bureau 2016 ACS.
Filipinos overall have significantly higher incomes compared to the total foreign- and native-born populations. In 2016, households headed by a Filipino immigrant had a median income of $87,000, compared to $54,000 and $58,000 for all immigrant and U.S.-born households, respectively.
Further, in 2016, just 5 percent of Filipino families were living in poverty, a much lower rate than the 9 percent for the U.S. born and 15 percent for immigrant families overall.
Immigration Pathways and Naturalization
Filipinos are much more likely to be naturalized U.S. citizens than immigrants overall. In 2016, 70 percent of Filipinos were naturalized citizens, compared to 49 percent of the total foreign-born population.
Compared to all immigrants, Filipinos are slightly more likely to have arrived before 2000. The largest share of Filipinos, approximately 59 percent, arrived prior to 2000, followed by 26 percent coming between 2000 and 2009, and 16 percent in 2010 or later (see Figure 6).
Figure 6. Filipinos and All Immigrants in the United States by Period of Arrival, 2016
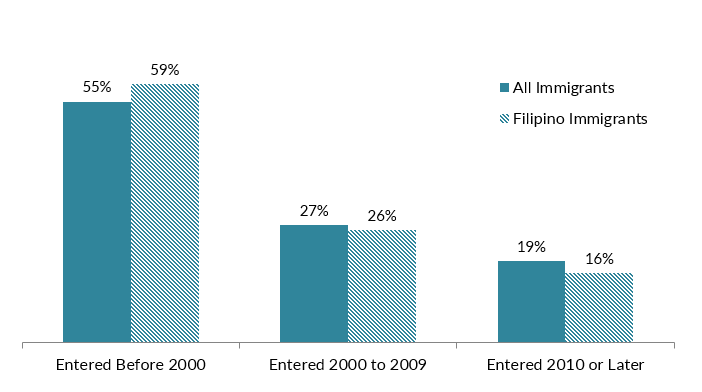
Note: Numbers may not add up to 100 as they are rounded to the nearest whole number.
Source: MPI tabulation of data from the U.S. Census Bureau 2016 ACS.
Most Filipinos who obtain green cards do so through family reunification channels. In fiscal year (FY) 2016, 85 percent of the roughly 53,300 Filipinos who received a green card did so as either immediate relatives of U.S. citizens or other family members, a much higher share compared to 68 percent of all new LPRs (see Figure 7).
Figure 7. Immigration Pathways of Filipinos and All Immigrants in the United States, 2016
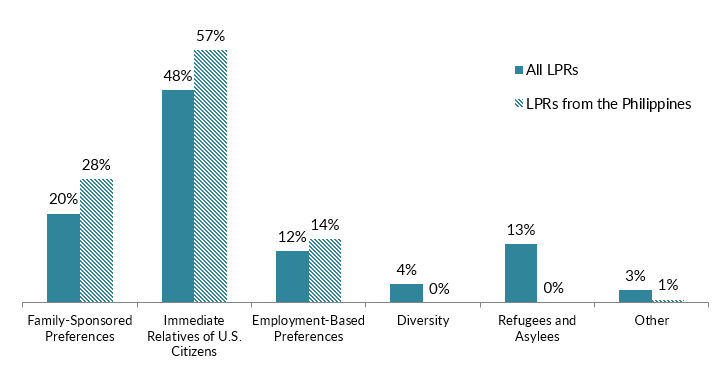
Notes: Family-sponsored: Includes adult children and siblings of U.S. citizens as well as spouses and children of green-card holders. Immediate relatives of U.S. citizens: Includes spouses, minor children, and parents of U.S. citizens. Diversity Visa lottery: The Immigration Act of 1990 established the Diversity Visa lottery program to allow entry to immigrants from countries with low rates of immigration to the United States. The law states that 55,000 diversity visas in total are made available each fiscal year. Individuals born in the Philippines are not eligible for the lottery.
Source: MPI tabulation of data from Department of Homeland Security (DHS), 2016 Yearbook of Immigration Statistics (Washington, DC: DHS Office of Immigration Statistics, 2017), available online.
Although the vast majority of Filipino immigrants in the United States are legally present, approximately 188,000 were unauthorized in the 2010-14 period, according to Migration Policy Institute (MPI) estimates, comprising less than 2 percent of the 11 million unauthorized population.
MPI also estimated that, in 2017, approximately 18,000 Filipino unauthorized immigrants were immediately eligible for the 2012 Deferred Action for Childhood Arrivals (DACA) program. However, as of January 31, 2018, just under 3,800 Filipinos were active participants, according to U.S. Citizenship and Immigration Services (USCIS) data. Overall, about 683,000 unauthorized youth were participating in the DACA program.
Filipinos have relatively high health insurance coverage rates compared to other groups. In 2016, 7 percent of Filipinos were uninsured, the same as for the native born, compared to 20 percent of all foreign born. Filipino immigrants were also more likely to be covered by private health insurance than the overall foreign- and U.S.-born populations (see Figure 8).
Figure 8. Health Coverage for Filipinos, All Immigrants, and the Native Born, 2016
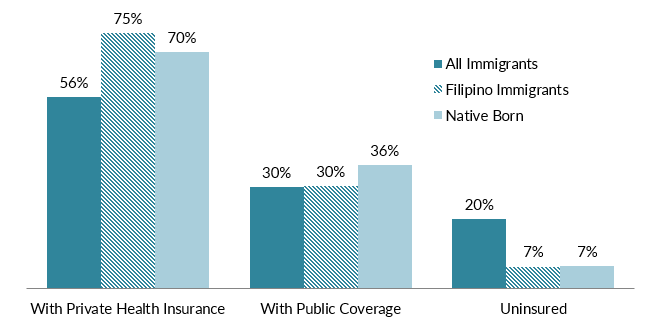
Note: The sum of shares by type of insurance is likely to be greater than 100 because people may have more than one type of insurance.
Source: MPI tabulation of data from the U.S. Census Bureau 2016 ACS.
The Filipino diaspora in the United States was comprised of nearly 4.1 million individuals who were either born in the Philippines or reported Filipino ancestry or race, according to tabulations from the U.S. Census Bureau 2016 ACS.
In 2017, Filipinos living abroad sent nearly $33 billion in remittances to the Philippines via formal channels, according to World Bank data. Remittances more than doubled in the past decade, and represented about 11 percent of the country’ gross domestic product (GDP) in 2016.
Figure 9. Annual Remittance Flows to the Philippines, 1977 to 2017
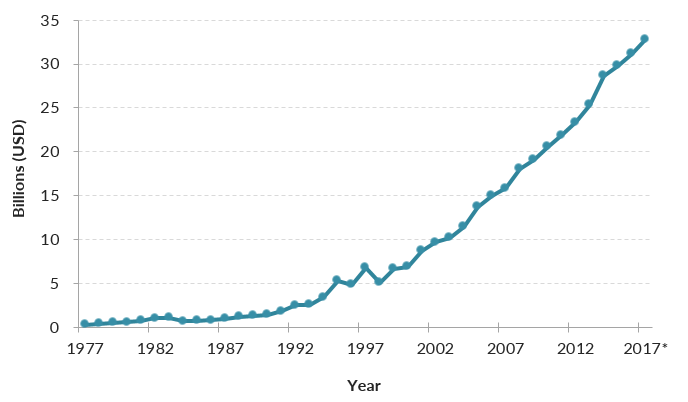
Note: The 2017 figure represents World Bank estimates.
Source: MPI tabulations of data from the World Bank Prospects Group, “Annual Remittances Data,” October 2017 update.
Sources
Gibson, Campbell J. and Kay Jung. 2006. Historical Census Statistics on the Foreign-born Population of the United States: 1850-2000. Working Paper no. 81, U.S. Census Bureau, Washington, DC, February 2006. Available online.
United Nations Population Division. N.d. International Migrant Stock by Destination and Origin. Accessed March 1, 2018. Available online.
U.S. Census Bureau. N.d. 2016 American Community Survey (ACS). American FactFinder. Accessed March 1, 2018. Available online.
---. 2017. 2016 American Community Survey. Access from Steven Ruggles, Katie Genadek, Ronald Goeken, Josiah Grover, and Matthew Sobek. Integrated Public Use Microdata Series: Version 7.0 [dataset]. Minneapolis: University of Minnesota, 2017. Available online.
U.S. Citizenship and Immigration Services (USCIS). 2018. DACA Population Data, January 31, 2018. Available online.
U.S. Department of Homeland Security (DHS) Office of Immigration Statistics. 2017. 2016 Yearbook of Immigration Statistics. Washington, DC: DHS Office of Immigration Statistics. Available online.
World Bank Prospects Group. 2017. Annual Remittances Data, October 2017 update. Available online.