

Frequently Requested Statistics on Immigrants and Immigration in the United States

Immigration has significant effects on many aspects of life in the United States. (Photo: Daniel Szwalkiewicz)
Source Spotlights are often updated as new data become available. Please click here to find the most recent version of this Spotlight.
Editor’s note: This article was updated April 27, 2016 to include newly released Department of Homeland Security (DHS) data on annual flows and naturalization trends, and on May 26, 2016 to include new DHS data on enforcement and temporary admissions.
Immigration to the United States is often the subject of significant public and political debate, with questions about the size of inflows, the role of immigrants in the labor market, enforcement and humanitarian admission policies, and benefits and costs. As such, it is important for the public to have access to accurate, unbiased current and historical information about immigration. This Spotlight article offers in one accessible resource the most current available data on the 42.4 million immigrants who lived in the United States in 2014. By compiling some of the most frequently requested facts and figures on U.S. immigration, this article answering questions such as: How many people immigrated to the country last year? Have the top source countries changed over time? How many immigrants enter the United States as refugees? How many unauthorized immigrants are there in the United States? How many immigrants are in the workforce and what jobs do they hold? And how many children live with immigrant parents?
The article draws upon resources from the Migration Policy Institute (MPI); the U.S. Census Bureau's 2014 American Community Survey (ACS), 2014 Current Population Survey (CPS), and 2000 decennial census; the U.S. Departments of Homeland Security (DHS) and State; Mexico's National Population Council (CONAPO) and National Institute of Statistics and Geography (INEGI); and the United Nations Department of Economic and Social Affairs (UNDESA).
Click on the bullet points for more information on each topic:
- Current and Historical Numbers and Shares
- Demographic, Educational, and Linguistic Characteristics
- Immigrant Population Change Over Time: Top States
- Mexican Immigrants
- Health Insurance Coverage
- Workforce Characteristics
- Children with Immigrant Parents
- Annual Flows
- Unauthorized Immigrants
- Naturalization Trends
- Visa Backlogs
Current and Historical Numbers and Shares
How many immigrants reside in the United States?
The U.S. immigrant population stood at more than 42.4 million, or 13.3 percent, of the total U.S. population of 318.9 million in 2014, according to ACS data. Between 2013 and 2014, the foreign-born population increased by 1 million, or 2.5 percent.
Immigrants in the United States and their U.S.-born children now number approximately 81 million people, or 26 percent of the overall U.S. population.
- Check out the Number and Share of Total U.S. Population, 1850-2014 in MPI’s Data Hub to see how the immigrant share of the overall population has fluctuated over time.
How many people immigrated to the United States last year?
In 2014, 1.3 million foreign-born individuals moved to the United States, an 11 percent increase from 1.2 million in 2013. India was the leading country of origin for new immigrants, with 147,500 arriving in 2014, followed by China with 131,800, Mexico with 130,000, Canada with 41,200, and the Philippines with 40,500.
Note: The Census Bureau defines recent immigrants here as foreign-born individuals who resided abroad one year prior, including lawful permanent residents, temporary nonimmigrants, and unauthorized immigrants.
What are the historical numbers and shares of immigrants in the United States?
Data on the nativity of the U.S. population were first collected in 1850. That year, there were 2.2 million immigrants in the United States, nearly 10 percent of the total population.
Between 1860 and 1920, the immigrant share of the total population fluctuated between 13 and nearly 15 percent, peaking at 14.8 percent in 1890, mainly due to high levels of European immigration.
Restrictive immigration legislation in 1921 and 1924, coupled with the Great Depression and World War II, led to a sharp drop in new arrivals. As a result, the foreign-born share steadily declined between the 1930s and 1970s, reaching a record low of approximately 5 percent in 1970 (9.6 million, see Table 1). Since 1970, the share and number of immigrants have increased rapidly, mainly as a result of large-scale immigration from Latin America and Asia made possible by Congress’ abolishment of national-origin admission quotas in 1965. Since 1970, the number of U.S. immigrants more than quadrupled, rising from 9.6 million in 1970 to 42.4 million in 2014.
Table 1: Numerical Size and Share of the Foreign-Born Population in the United States, 1970-2014
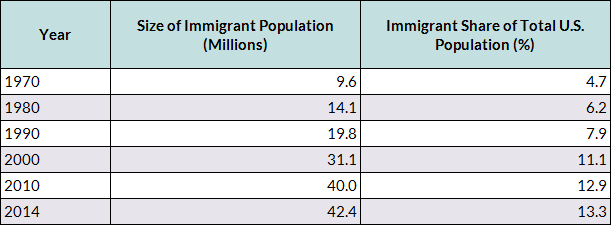
Source: Migration Policy Institute (MPI) tabulation of data from the U.S. Census Bureau's 2010 and 2014 American Community Surveys (ACS), and 1970-2000 decennial Census.
- Read about U.S. immigration trends and policies in Immigration in the United States: New Economic, Social, Political Landscapes with Legislative Reform on the Horizon.
- Read more about the end of national-origin quotas in The Geopolitical Origins of the U.S. Immigration Act of 1965.
How do today’s top source countries compare to those 50 years ago?
In 2014, Mexican immigrants accounted for approximately 28 percent of the 42.4 million foreign born in the United States, making them by far the largest immigrant group in the country. India, closely trailed by China (including Hong Kong but not Taiwan), and the Philippines were the next largest countries of origin, accounting for about 5 percent each. El Salvador, Vietnam, Cuba, and Korea (3 percent each), as well as the Dominican Republic and Guatemala (2 percent each), rounded out the top ten. Together, immigrants from these ten countries represented close to 60 percent of the U.S. immigrant population in 2014.
The predominance of Latin American and Asian immigration in the late 20th and early 21st centuries starkly contrasts with the trend seen in 1960 when immigrants largely originated from Europe. Italian-born immigrants made up 13 percent of the foreign born in 1960, followed by those born in Germany and Canada (about 10 percent each). In the 1960s no single country accounted for more than 15 percent of the total immigrant population.
- To view the top ten source countries by decade from 1960 to 2014, check out the Largest U.S. Immigrant Groups over Time, 1960-Present interactive tool.
- To see immigration trends from individual countries over time, use this MPI Data Hub tool.
- To learn more about specific immigrant populations, check out our Spotlight archive, which includes articles on Mexican, Indian, Chinese, South American, European, and Asian immigrants.
Find the immigrant group of interest on the map:
- Use these maps to find the U.S. states and metropolitan areas in which different immigrant groups reside.
Demographic, Educational, and Linguistic Characteristics
Note: In some cases percentages do not add up to 100 due to rounding.
What is the gender composition of the U.S. immigrant population?
In 2014, approximately 51 percent of immigrants were female. The share has fluctuated slightly during the past three decades; women accounted for 53 percent of immigrants in 1980, 51 percent in 1990, and 50 percent in 2000.
What is the age distribution of the immigrant population?
Overall, the immigrant population in 2014 was older than the U.S.-born population: The median age of immigrants was 43.5 years, compared to 35.9 years for the native born.
In 2014, fewer than 1 percent of the foreign born were under age 5 (compared to 7 percent for the native born), less than 6 percent were ages 5 to 17 (compared to 19 percent), 80 percent were ages 18 to 64 (compared to 60 percent), and 14 percent were age 65 and older (roughly the same as 15 percent of the U.S. born).
- See the age-sex pyramids of the native-born and immigrant populations from 1970 to now as well as for the eight largest immigrant-origin groups (with at least 1 million immigrants) in 2014.
How many immigrants have entered the United States since 2000?
Twelve percent of the 42.4 million foreign born in the United States in 2014 entered since 2010, 29 percent between 2000 and 2009, and the majority (59 percent) before 2000.
How many immigrants are naturalized U.S. citizens?
In 2014, around 47 percent of immigrants (20 million) were naturalized U.S. citizens. The remaining 53 percent (22.4 million) included lawful permanent residents, unauthorized immigrants, and legal residents on temporary visas (such as students and temporary workers).
Of the 20 million naturalized citizens, 18 percent naturalized since 2010, 34 percent between 2000 and 2009, and 47 percent prior to 2000.
What is the racial composition of the immigrant population?
Forty-eight percent of the foreign-born population in 2014 reported their race as white, 26 percent as Asian, 9 percent as black, and 15 percent as some other race; more than 2 percent reported having two or more races.
How many immigrants are of Hispanic origin?
In 2014, 46 percent of immigrants (19.4 million people) reported having Hispanic or Latino origins.
How many Hispanics in the United States are immigrants?
The majority of Hispanics in the United States are native born. Of the 55 million people in 2014 who identified themselves as of Hispanic or Latino origin, 35 percent (19.4 million) were immigrants.
- Use our State Immigration Data Profiles tool to learn more about the demographic characteristics of immigrants and the U.S. born (including race and ethnicity) in each of the 50 states and the District of Columbia, as well as nationally.
Which languages are most frequently spoken at home in U.S. households?
In 2014, approximately 79 percent (235.9 million) of the U.S. population* ages 5 and older reported speaking only English at home.
The remaining 21 percent (63.2 million) reported speaking a language other than English at home. Spanish was by far the most common language within this category (62 percent), followed by Chinese (including Mandarin and Cantonese, 5 percent), Tagalog (almost 3 percent), Vietnamese (2 percent), French (including Cajun and Patois, 2 percent), Korean, Arabic, and German (almost 2 percent each), and Russian (1 percent).
*Note: Refers to the 299.1 million people ages 5 and older who resided in the United States at the time of the survey.
What is the size of the Limited English Proficient population?
In 2014, there were 25.7 million Limited English Proficient (LEP) individuals ages 5 and older, accounting for 9 percent of the 299.1 million U.S. residents ages 5 and older. Spanish speakers accounted for 64 percent (16.4 million) of the LEP population. The next two languages most commonly spoken by LEP individuals were Chinese (including Mandarin and Cantonese, 1.8 million, or 7 percent) and Vietnamese (864,000, or 3 percent).
Note: The term "Limited English Proficient" refers to persons ages 5 and older who reported speaking English "not at all," "not well," or "well" on their survey questionnaire. Individuals who reported speaking “only English” or speaking English "very well" are considered proficient in English.
- Read more about the LEP population in this MPI fact sheet The Limited English Proficient Population in the United States.
- Click here for data on the total LEP population by state in 1990, 2000, 2010, and 2013.
- Check out this 2009-13 dataset for more information on the linguistic diversity of the LEP population by state and county.
What percentage of immigrants are LEP?
In 2014, approximately 50 percent (20.9 million) of the 42.1 million immigrants ages 5 and older were LEP.
What percentage of the adult foreign-born population is college educated?
In 2014, 29 percent (10.5 million) of the 36.7 million immigrants ages 25 and older had a bachelor's degree or higher, compared to 30 percent of native-born adults. Notably, the share of college-educated immigrants is much higher—44 percent—among those who entered the country since 2010. On the other end of the educational spectrum, 30 percent of immigrants lacked a high school diploma or General Educational Development (GED) certificate versus 10 percent of their native-born counterparts.
- Read more about the socioeconomic characteristics of college-educated immigrants in College-Educated Immigrants in the United States.
- Use our State Immigration Data Profiles tool for more information on the language and educational characteristics of immigrants and the U.S. born in each of the 50 states, the District of Columbia, and the country overall.
Immigrant Population Change over Time: Top States
What were the top five states in terms of the number of immigrants, share of immigrants in the total state population, absolute growth, and percent growth between 1990 and 2000 and between 2000 and 2014?
In 2014, the top five U.S. states by number of immigrants were California (10.5 million), Texas and New York (4.5 million each), Florida (4 million), and New Jersey (2 million).
When classified by the share of immigrants out of the total state population, the top five states in 2014 were California (27 percent), New York (23 percent), New Jersey (22 percent), Florida (20 percent), and Nevada (19 percent).
Between 1990 and 2000, the five states with the largest absolute growth of the immigrant population were California (2.4 million), Texas (1.4 million), New York (1 million), Florida (1 million), and Illinois (577,000).
Between 2000 and 2014, the five states with the largest absolute growth of the immigrant population were California and Texas (1.6 million each), Florida (1.3 million), New York (597,000), and New Jersey (484,000).
Between 1990 and 2000, the five states with the largest percent growth* of the immigrant population were North Carolina (274 percent), Georgia (233 percent), Nevada (202 percent), Arkansas (196 percent), and Utah (171 percent).
Between 2000 and 2014, the five states with the largest percent growth* of the immigrant population were Tennessee and Kentucky (102 percent each), Wyoming (101 percent), North Dakota (99 percent), and South Carolina (97 percent).
*Note: In some states, the initial foreign-born population was quite small. Thus, relatively small absolute increases in the immigrant population in these states have translated into high percent growth.
- For more information on the top states of residence for the foreign born, see State Immigration Trends: Number and Share of Total State Population, 1990-2014.
Mexican Immigrants
How many Mexican immigrants are in the United States?
More than 11.7 million immigrants from Mexico resided in the United States in 2014, according to the ACS, accounting for 28 percent of all U.S. immigrants.
In which U.S. states do the Mexican born live?
Mexican immigrants are primarily concentrated in the West and Southwest, and more than half live in California or Texas. In 2014, the top five states in which Mexican immigrants resided were California (37 percent of all Mexican immigrants), Texas (22 percent), Illinois (6 percent), Arizona (4 percent), and Florida (2 percent).
- Use this interactive map to learn the top states and counties where individual immigrant populations reside in the United States.
- Use this interactive map to learn the top metropolitan areas where individual immigrant populations reside in the United States.
In 2014, the foreign born from Mexico accounted for more than half of the immigrant population in New Mexico (72 percent), Arizona (57 percent), and Texas and Idaho (56 percent each). By contrast, the Mexican born accounted for 2 percent or less of the state immigrant population in Hawaii (1.8 percent), Vermont (1.5 percent), and Massachusetts (0.9 percent).
How many Mexican-born workers are in the U.S. labor force?
About 69 percent of the 11.3 million immigrants from Mexico ages 16 and older were in the civilian labor force in 2014. This rate is slightly higher than the labor force participation of the overall foreign-born population ages 16 and older (66 percent of 40.4 million immigrants) and the native-born population ages 16 and older (62 percent of 213.1 million U.S. born).
How has the emigration rate from Mexico changed over time?
According to Mexico's National Survey of Occupations and Employment (Encuesta Nacional de Ocupación y Empleo, or ENOE), the emigration rate from Mexico (refers to emigrants leaving Mexico regardless of their destination, although most head to the United States) has remained steadily low in recent years, after experiencing a drop following the 2007-09 U.S. recession and global financial crisis. From 2008 to 2012, the emigration rate dropped from 6.4 migrants per 1,000 residents to 3.3 migrants. It ticked up slightly in 2014 to 3.5 migrants per 1,000 residents.
The immigration rate to Mexico (i.e., the number of people who move to Mexico from abroad, who are overwhelmingly return migrants) has also dropped, from 4.4 migrants per 1,000 residents in 2008 to 1.4 per 1,000 in 2014.
Note: ENOE asks Mexican households to enumerate any members of the household who are living abroad at the time of the interview. Accordingly, it does not capture the emigration of entire families where no member of the household remains in Mexico.
Which areas/regions do most Mexican migrants come from?
According to the Survey of Migration on the Northern Border of Mexico* (Encuesta de Migración en la Frontera Norte de México, or EMIF), the number of immigrants moving from Mexico to the United States decreased steadily between 2007 and 2014 despite an uptick in 2013. EMIF estimated that 165,000 immigrants crossed the country's northern border to the United States in 2014—almost half of the 2013 estimate of 323,000 immigrants.
In 2014, traditional sending states such as Michoacán, Jalisco, and Durango accounted for the largest shares of the 165,000 migrants who headed toward the United States, collectively representing 26 percent of the northward flows. Between 2009 and 2014, traditional sending states in northern and central Mexico witnessed a decline in the total outflow, while other states in these regions experienced increased emigration. The most significant drop was recorded in the state of Guanajuato (central Mexico): between 2009 and 2014, migrants from Guanajuato declined from 13 percent to 7 percent of the total outflow from Mexico. Chihuahua (northern Mexico, bordering Texas) experienced a more than threefold growth in the share of total outflow (from 1 percent to 4 percent), and Sinaloa (western Mexico) more than doubled its share of the total outflow (from 3 percent to 7 percent).
- For an overall map of flows by Mexican state over time, visit MPI’s data tool, Origins of Mexican Migrants to the United States by Mexican State of Residence, Number, and Share, 2004-2014.
*Note: EMIF is an annual sample survey of migration flows along Mexico's northern border region conducted by the Ministry of Foreign Affairs (SRE), Secretariat of Labor and Social Welfare (STPS), National Migration Institute (INM), National Population Council (CONAPO), and College of the Northern Border (COLEF) in Tijuana. The survey excludes Mexicans entering the United States by air, migrants under the age of 15, and non-Mexican nationals crossing the U.S.-Mexico border. The category "migrants headed toward the United States" is restricted to those migrants who are traveling to the United States or a Mexican border city, are ages 15 and older, were not born in the United States, and do not have an immediate return itinerary.
- Read more about the characteristics of Mexicans migrating to the United States from the Instituto Nacional de Estadística y Geografía, INEGI (in Spanish).
- Read the ENOE survey (in Spanish).
- More information on Mexican migration is available at EMIF (in Spanish).
Health Insurance Coverage
How many immigrants in the United States have health insurance?
In 2014, approximately 53 percent of immigrants in the United States had private health insurance (compared to 68 percent of the native born) and 27 percent had public health insurance coverage (compared to 34 percent of the native born). Slightly more than one-quarter (27 percent) were uninsured, compared to 9 percent of the native born.
Note: Health insurance coverage is calculated only for the civilian, noninstitutionalized population. Since some people may simultaneously hold both private and public health insurance coverage, estimates of those with public health insurance and those with public coverage may overlap. Their sum therefore may be greater than the total number of people with health insurance.
How has coverage changed for immigrants in the United States since enactment of the Affordable Care Act (ACA)?
The ACA has increased health insurance coverage of immigrants—especially noncitizens—at a greater rate than the U.S.-born population. From 2013 to 2014, the immigrant uninsured rate fell from 32 percent to 27 percent, compared to the rate for the native born, which fell from 12 to 9 percent. The improvement in coverage for immigrants is a result of an increase in both private coverage (from 50 percent to 53 percent) and public coverage (from 24 percent to 27 percent). Among the foreign born, noncitizens witnessed a larger drop in the uninsured rate (from 46 percent to 40 percent) than naturalized citizens (from 16 percent to 11 percent).
Workforce Characteristics
What is the foreign-born share of the total U.S. civilian labor force?
Immigrants accounted for nearly 17 percent (26.7 million) of the 159.5 million workers in the civilian labor force in 2014. Between 1970 and 2014, the percentage of foreign-born workers in the civilian labor force more than tripled, from 5 percent to 17 percent. Over the same period, the foreign-born share of the total population grew from almost 5 percent to 13 percent.
- For more on the share of immigrants in the labor force since 1980, see Immigrant Share of the U.S. Population and Civilian Labor Force (Nationwide and by State).
What types of jobs do immigrants hold?
Of the 25 million employed foreign-born workers ages 16 and older in 2014, 30 percent worked in management, professional, and related occupations; 25 percent in service occupations; 17 percent in sales and office occupations; 13 percent in natural resources, construction, and maintenance occupations; and 15 percent in production, transportation, and material moving occupations (see Table 2).
Table 2. Share of Immigrant and U.S.-Born Workers by Select Occupation, 2014
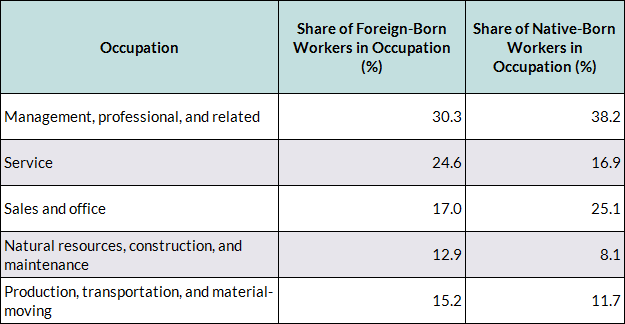
Note: The percentages may not add up to 100 due to rounding.
Source: MPI tabulation of data from the U.S. Census Bureau 2014 ACS.
- Check out our State Immigration Data Profiles for more information on the workforce characteristics of immigrants and the U.S. born in the United States, each of the 50 states, and the District of Columbia.
Children with Immigrant Parents
How many children in the United States live with immigrant parents?
In 2014, 17.5 million children ages 18 and younger lived with at least one immigrant parent. They accounted for 25 percent of the 69.9 million children under age 18 in the United States.
Second-generation children under age 18—those who were born in the United States to at least one foreign-born parent—accounted for 88 percent (15.4 million) of all children with immigrant parents. The remaining 12 percent (2.1 million) were children living in the United States in 2014 who were born outside the United States to foreign-born parents.
- For state-by-state information on children living with immigrant parents, including both first- and second-generation, see the Children in U.S. Immigrant Families tool.
- Read more about second-generation immigrant children in this Migration Information Source special issue.
How has the number of children ages 0-17 living with immigrant parents changed?
Between 1990 and 2000, the number of children ages 17 and under with immigrant parents grew 60 percent, from 8.2 million to 13.1 million. Between 2000 and 2014, the number grew 34 percent from 13.1 million to 17.5 million.
For first-generation immigrant children (those born outside the United States), population growth was sizeable between 1990 and 2000, increasing 43 percent (from 1.9 million to 2.7 million), but declined 22 percent between 2000 and 2014, from 2.7 million to 2.1 million.
The number of second-generation immigrant children (born in the United States to foreign-born parents) has grown steadily since 1990. Between 1990 and 2000, the number of second-generation immigrant children grew 65 percent (from 6.3 million to 10.4 million). Between 2000 and 2014, this population grew by 48 percent (from 10.4 million to 15.4 million).
In 1990, 13 percent of all children in the United States were living with immigrant parents. This share increased to 19 percent in 2000 and 25 percent in 2014. The share of second-generation children among all children with immigrant parents has grown from 77 percent in 1990 to 80 percent in 2000 and 88 percent in 2014.
How many children living with immigrant parents are in low-income families?
In 2014, there were 30.3 million children under age 18 living in poor families (i.e., with family incomes below 200 percent of the federal poverty threshold) in the United States. Of them, almost 9.5 million (or 31 percent) were children of immigrants.
- For state-level estimates, see the Demographics and Social Profiles in MPI Data Hub’s State Immigration Data Profiles.
What are the top five states in terms of the number of children living with immigrant parents?
In 2014, the top five states by the total number of children under age 18 living with immigrant parents were California (4.3 million), Texas (2.3 million), New York (1.5 million), Florida (1.3 million), and Illinois (754,000). These five states accounted for 58 percent of all children with immigrant parents residing in the United States.
What are the top five states by share of children living with immigrant parents in the state's total child population?
In terms of the share of children under age 18 living with immigrant parents, the top five states in 2014 were California (49 percent of all children in the state), Nevada (38 percent), New Jersey (37 percent), New York (36 percent), and Texas (35 percent).
What are the top five states in terms of the absolute growth of the number of children living with immigrant parents?
Between 1990 and 2000, the five states with the largest absolute growth of the total number of children with immigrant parents were California (1.3 million), Texas (643,000), Florida (384,000), New York (366,000), and Illinois (231,000).
Between 2000 and 2014, the five states with the largest absolute growth of the total number of children living with immigrant parents were Texas (796,000), Florida (336,000), Georgia (277,000), North Carolina (231,000), and New Jersey (181,000).
What are the top five states in terms of the percent growth of the number of children living with immigrant parents between 1990 and 2000 and between 2000 and 2014?
Between 1990 and 2000, the five states with the largest percent growth of the total population of children with immigrant parents were Nevada (233 percent), North Carolina (224 percent), Georgia (194 percent), Nebraska (174 percent), and Arkansas (170 percent).
Between 2000 and 2014, the five states with the largest percent growth of the total population of children living with immigrant parents were Tennessee (164 percent), Kentucky (142 percent), Arkansas, North Carolina, and South Carolina (138 percent each).
Annual Flows
How many immigrants obtain lawful permanent residence in the United States?
In 2014, 1,016,518 foreign nationals became lawful permanent residents (LPRs), also known as green-card holders, according to DHS data. Although the number of new LPRs in 2014 increased 3 percent from 2013 (990,553), it remained lower than the level reached in 2012 (1,031,631). New arrivals comprised approximately 47 percent (481,392) of those granted LPR status in 2014; the remainder (535,126) were status adjusters—persons already living in the United States, and whose green-card applications were approved that year.
Under which categories do permanent immigrants enter?
Of the more than 1 million new LPRs in 2014, 41 percent were immediate relatives of U.S. citizens, 23 percent entered through a family-sponsored preference, and 15 percent via an employment-based preference. Another 13 percent adjusted from refugee or asylee status, and 5 percent were diversity-lottery winners.
Which countries did permanent immigrants come from?
The top five countries of birth for new LPRs in 2014 were Mexico (13 percent), India and China (8 percent each), and the Philippines and Cuba (5 percent each). Approximately 385,000 new LPRs were from one of these top five countries of birth, accounting for about 38 percent of all persons who received LPR status in 2014.
Individuals born in the next five countries—the Dominican Republic (4 percent), Vietnam (3 percent), and South Korea, El Salvador, and Iraq (2 percent each)—contributed another 13 percent of all LPRs. The top ten countries of origin accounted for 51 percent of all LPRs gaining green cards in 2014.
How many people apply for permanent immigration through the green-card lottery?
The Immigration Act of 1990 established the Diversity Visa Lottery (also known as the DV lottery or the green-card lottery) to allow entry to immigrants from countries with low rates of immigration to the United States. The law states that 55,000 diversity visas are made available each fiscal year (FY), of which 5,000 must be used for applicants under the Nicaraguan and Central America Relief Act of 1997. In 2014, 53,490 people received green cards as diversity immigrants, representing close to 5 percent of the 1 million new LPRs.
Before receiving permission to immigrate to the United States, lottery winners must provide proof of a high school education or its equivalent or show two years of work experience within the past five years in an occupation that requires at least two years of training or experience. They also must pass a medical exam and a background check.
Interest in the lottery is significantly higher than there are available visas; close to 11.4 million qualified applications were registered for the DV-2016 program, a 21 percent increase from the 9.4 million the prior year. (The application number varies each year depending on which countries are eligible.)
- Read the State Department’s June 2015 Visa Bulletin for more on the DV-2016 lottery results.
What is the total number of temporary admissions to the United States?
There were approximately 181 million total nonimmigrant (temporary) admissions* for 2014, primarily tourists, business travelers, and international students. That figure includes an estimated 106 million admissions of travelers who are exempt from completing the I-94 arrival/departure form at the port of entry. (Canadians who travel to the United States for business or pleasure, and Mexicans who possess a nonresident Border Crossing Card [i.e., laser visa] are exempt from completing this form).
Total temporary admissions of I-94 nonimmigrants increased 23 percent, from 61.1 million in 2013 to 74.9 million in 2014.
*Note: Nonimmigrant admissions represent the number of arrivals, not the number of individuals admitted to the United States. DHS only reports characteristics of nonimmigrants who have to complete an I-94 arrival/departure form.
How do nonimmigrant admissions break down by visa category?
Temporary visitors (tourists and business travelers) account for an overwhelming majority of all nonimmigrant admissions. In 2014, they represented 90 percent (67.5 million) of all I-94 admissions to the United States. Of those, 59.8 million were tourist admissions and 7.7 million were business-traveler admissions.
Temporary workers and trainees, as well as their spouses and children, accounted for 3.4 million admissions (about 5 percent of total I-94 admissions). This group includes H-1B "specialty occupation" workers, registered nurses, temporary agricultural workers, North American Free Trade Agreement (NAFTA) professional workers, treaty traders, and intracompany transferees.
Students who entered the United States to study at academic or vocational institutes made up about 2 percent (close to 1.8 million) of arrivals. This figure includes their family members and excludes exchange visitors.
According to the most recently available DHS estimates, as of January 1, 2012, about 1.9 million foreign nationals on various temporary visas* resided in the United States. Of those, 45 percent were temporary workers and their families, followed by foreign students and their families (38 percent). Fifty-two percent of the 1.9 million temporary visa holders were from Asia. Another quarter came from Europe and North America. The top five countries of origin—India, China, South Korea, Canada, and Mexico—accounted for 54 percent of all residents on temporary visas.
*Note: this estimate excludes tourists and other short-term visitors.
- Read about the size of nonimmigrant population in Estimates of the Size and Characteristics of the Resident Nonimmigrant Population in the United States.
How many visas does the Department of State issue?
The Department of State (DOS) reports the number of visas issued to foreign nationals who wish to enter the United States for the purpose of travel, conducting business, work, study, or other reasons.
In FY 2015, DOS issued 10,891,745 nonimmigrant visas—a 10 percent increase from the 9,932,480 issued in 2014.
The vast majority (78 percent) of the 11 million nonimmigrant visas issued in 2015 were temporary business and tourist visas (B-1, B-2, and BCC visas). The next largest visa class (F-1, F-2, and F-3) was for academic students and exchange visitors and their family members, who comprised 6 percent of all nonimmigrant visas issued, followed by H visa categories for temporary workers and trainees and their family members (4 percent).
Looking at the distribution of the temporary visas issued in 2015 by region of origin, the largest shares were issued to nationals from Asia (46 percent), South America (20 percent), and North America (19 percent, including Central America and the Caribbean), followed by Europe (10 percent), Africa (5 percent), and Oceania (0.6 percent).
Note: The number of visas issued does not necessarily match the number of foreign nationals who entered the United States in the same year because some nonimmigrant visas may not be used.
- For more information, see the State Department puplication Report of the Visa Office 2015.
How many immigrants enter the United States as refugees, and where are they from?
According to DOS Worldwide Refugee Admissions Processing System (WRAPS) data, 69,933 refugees were admitted to the United States in FY 2015, close to the 69,987 admitted in 2014 and 69,926 in 2013. Burma (also known as Myanmar), Iraq, and Somalia were the primary countries of nationality, accounting for 57 percent (39,920) of all refugees admitted in 2015. Rounding out the top ten origin countries for resettlement in 2015 were the Democratic Republic of Congo (DRC), Bhutan, Iran, Syria, Eritrea, Sudan, and Cuba. Together, nationals of these ten countries totaled 90 percent (63,063) of all refugee arrivals in 2015.
Every year, the president and Congress set the annual refugee admissions ceiling and allocations by region of origin. In response to the growing humanitarian crisis in the Middle East, the Obama administration increased the refugee admissions ceiling for FY 2016 to 85,000, up 15,000 from the 70,000 in 2015, with 10,000 specifically designated for Syrians. The Near East and South Asia region received 40 percent (34,000) of the regional allocation in response to refugee crises in Iraq and Burma.
- For more information on U.S. refugee resettlement system, read the MPI fact sheet Ten Facts About U.S. Refugee Resettlement.
- Read the White House press release on raising the refugee admissions ceiling.
How many foreign born received asylum status in the United States, and where are they from?
In 2014, 23,533 principal applicants and their spouses and/or unmarried children under age 21 were granted asylum after seeking protection upon arriving or after arrival in the United States (a 6 percent drop from the 25,100 persons in 2013). An additional 8,235 individuals outside of the United States were approved for asylum status as immediate family members of principal applicants. (Note that this number reflects travel documents issued to these family members, not their arrival to the United States.)
China was the top country of origin, with 7,880 Chinese receiving asylum status in 2014. Despite a significant decrease in the number of asylum recipients since 2012 (down from 9,761 in 2012 and 8,581 in 2013), China still led in asylum grants (34 percent). The next four largest origin groups were from Egypt (2,879), Syria (932), Ethiopia (830), and Iran (636). Together, nationals of these five countries made up 56 percent of those receiving asylum status in 2014.
- For more information, see Refugees and Asylees in the United States.
- Read the DHS report Refugees and Asylees: 2014 for recent figures and trends.
Unauthorized Immigrants
How many unauthorized immigrants are in the United States?
According to DHS’ Office of Immigration Statistics (OIS), an estimated 11.4 million unauthorized immigrants resided in the United States as of January 2012 compared to 11.5 million in January 2011. These results suggest little to no change in the unauthorized immigrant population from 2011 to 2012.
MPI estimated 11 million unauthorized immigrants resided in the United States in 2013. More than half (54 percent) of the 11 million unauthorized immigrants resided in four states: California (28 percent), Texas (13 percent), New York (8 percent), and Florida (5 percent). Three-quarters of unauthorized immigrants resided in 117 counties with the largest unauthorized population, of which the top five counties—Los Angeles County, CA; Harris County, TX; Cook County, IL; Orange County, CA; and Dallas County, TX—accounted for 21 percent of all unauthorized immigrants.
- See Unauthorized Immigrant Population Profiles for detailed sociodemographic information, as well as estimates of those potentially eligible for deferred action, for the United States, 41 states and the District of Columbia, and 117 counties as of 2009-13.
Note: The research community (including MPI, OIS, the Pew Research Center, and the Center for Migration Studies of New York) generate a number of estimates of the unauthorized population, and it is important to acknowledge that the estimates are based on different data sources and methodologies. Hence the estimates are not fully comparable, and we urge readers to be mindful of this.
Where are unauthorized immigrants from?
According to MPI estimates, about 7.8 million unauthorized immigrants present in the United States in the 2009-13 period (71 percent of the total unauthorized population) were born in Mexico and other Central America countries. About 1.5 million (14 percent) were from Asia; 690,000 (6 percent) from South America; 423,000 (4 percent) from Europe, Canada, or Oceania; 342,000 (3 percent) from Africa; and 260,000 (2 percent) from the Caribbean.
The top five countries of birth for unauthorized immigrants were Mexico (56 percent), Guatemala (6 percent), El Salvador (4 percent), and Honduras and China (3 percent each).
- See An Analysis of Unauthorized Immigrants in the United States by Country and Region of Birth for a detailed profile by country and region of origin.
How many unauthorized immigrants reside with U.S. children under age 18?
Between 2009 and 2013, about 4 million unauthorized immigrants (39 percent of the overall unauthorized population ages 15 and older) resided with children under age 18, MPI estimates. Of this group, about 84 percent (3.3 million) resided with at least one U.S.-citizen child under age 18, and 16 percent (619,000) resided with non-U.S.-citizen children.
How many children under age 18 lived with at least one unauthorized immigrant parent?
In the 2009-13 period, approximately 5.1 million children under age 18 lived with an unauthorized immigrant parent, representing 7 percent of the U.S. child population. About 79 percent (4.1 million) of these children were U.S. citizens, another 19 percent (959,000) were themselves unauthorized, and 2 percent (113,000) were legally present, including legal permanent residents (LPRs) and those with temporary visas.
- See A Profile of U.S. Children with Unauthorized Immigrant Parents for the number, characteristics, and socioeconomic status of the children under age 18 living with an unauthorized immigrant parent.
How many people are eligible for the Deferred Action for Childhood Arrivals (DACA) program and how many applications have been received since its launch in 2012?
The initial DACA program was announced on June 15, 2012, and granted two-year deportation relief and work authorization to eligible youth. Prospective beneficiaries for DACA must meet a series of requirements, including:
- be at least 15 years old;
- have entered the United States before the age of 16;
- have continuously resided in the United States since June 15, 2007;
- be enrolled in school, have earned a high school diploma or its equivalent, or be honorably discharged veterans; and
- have not been convicted of a felony, significant misdemeanor, or three or more misdemeanors; or otherwise pose a threat to public safety or national security.
MPI estimates that approximately 2 million people could be eligible for the original DACA program, including nearly 1.2 million who were immediately eligible.
Between August 15, 2012, when U.S. Citizenship and Immigration Services (USCIS) began accepting applications, and December 31, 2015, 804,129 initial applications were accepted for consideration by the agency. Thus, as of December 2015 (the most recent data offered by USCIS at the time of this article’s publication), about 69 percent of the immediately eligible population had applied.
The top states of residence for DACA initial applicants (refers to accepted applications) are California (28 percent), Texas (16 percent), Illinois and New York (5 percent each), and Florida (4 percent). The top countries of origin are Mexico (77 percent), El Salvador (4 percent), Guatemala and Honduras (3 percent each), and Peru and South Korea (1 percent each).
By the end of December 2015, 713,266 (89 percent) of the accepted 804,129 initial applications had been approved, and 54,674 (7 percent) were denied. The remainder were pending.
On June 5, 2014, USCIS began accepting DACA renewal applications, and as of December 2015 had accepted 509,203 renewal applications.
The top states of residence for DACA renewal applicants (refers to accepted applications) are California (29 percent), Texas (16 percent), Illinois (6 percent), New York (5 percent), and Florida (4 percent). The top countries of origin are Mexico (77 percent), El Salvador (4 percent), Guatemala and Honduras (2 percent each), and South Korea and Peru (1 percent each).
By the end of December 2015, 95 percent (485,339) of the accepted 509,203 renewal applications had been approved.
- For the most up-to-date DACA application and approval estimates, click here.
- Read more about the DACA-eligible population in the MPI report DACA at the Two-Year Mark: A National and State Profile of Youth Eligible and Applying for Deferred Action.
- For more information from USCIS on the DACA program, click here.
How many people would potentially be eligible for the expanded DACA program and new Deferred Action for Parents of Americans and Lawful Permanent Residents (DAPA) program?
On November 20, 2014, President Obama announced an expansion of the DACA program for youth who came to the United States as children and a new program—Deferred Action for Parents of Americans and Lawful Permanent Residents (DAPA)—that would provide eligible parents of U.S. citizens and lawful permanent residents temporary relief from deportation and employment authorization for three years. The implementation of DAPA and expansion of the DACA program were challenged in federal court by Texas and 25 other states, and a lower court granted an injunction blocking implementation. The administration’s appeal of the lower court rulings will be heard by the Supreme Court on April 18, 2016, with a decision expected in June 2016.
The expanded DACA program loosened the 2012 DACA program’s age and length of U.S. residence requirements. MPI estimates that the DACA expansion could make an additional 275,000 unauthorized youths and young adults eligible to apply.
Prospective DAPA beneficiaries would have to meet a series of requirements, including:
- have lived in the United States continuously since January 1, 2010;
- had, on November 20, 2014, a son or daughter who is a U.S. citizen or lawful permanent resident; and
- are not an enforcement priority for removal from the United States under guidelines announced by DHS in November 2014.
MPI estimates that about 3.61 million (33 percent) of all unauthorized immigrants could potentially apply for the DAPA program. In total, MPI estimates as many as 5 million people—nearly half (46 percent) of the 11 million unauthorized immigrants living in the United States could receive DAPA or DACA status.
MPI has also developed estimates of the populations potentially eligible for the anticipated deferred action program for key states and counties. The top five counties with the largest populations potentially eligible for relief from deportation through DACA or DAPA—Los Angeles County, CA; Harris County, TX; Cook County, IL; Orange County, CA; and Dallas County, TX—accounted for 1.1 million people, or 22 percent of the total potentially eligible population nationwide.
- See detailed state and county-level estimates on the DACA- and DAPA-eligible populations.
- See Deferred Action for Unauthorized Immigrant Parents: Analysis of DAPA's Potential Effects on Families and Children for the demographic profile of the DAPA-eligible population and potential economic benefits of granting work authorization.
How many unaccompanied children (UACs) and families were apprehended at the border?
Between October 2015 and February 2016, the most recent period for which data are available, the U.S. Border Patrol apprehended 23,553 unaccompanied children (UACs) and 27,664 family units (defined as a parent, typically a mother, traveling with children) along the Southwest border, primarily from Mexico, El Salvador, Guatemala, or Honduras. By comparison, 39,970 unaccompanied children and 39,838 family units were apprehended in all of FY 2015 (from October 2014 to September 2015).
- For the most up-to-date DHS UAC and family unit apprehensions data for FY 2016, click here.
- Read more about the surge of child and family migration from Central America in the MPI fact sheet Trends in Unaccompanied Child and Family Migration from Central America and the Source article Increased Central American Migration to the United States May Prove an Enduring Phenomenon.
- Read about U.S. and regional policy responses to rising Central American migration in the MPI report Unaccompanied Child Migration to the United States: The Tension between Protection and Prevention.
- Read about how unaccompanied minors are faring in immigration courts and school systems in the MPI brief Unaccompanied Child Migrants in U.S. Communities, Immigration Court, and Schools.
How many apprehensions of unauthorized immigrants are there per year?
There were 679,996 apprehensions in 2014 by U.S. Customs and Border Protection (CBP) and U.S. Immigration and Customs Enforcement (ICE), the two agencies within DHS responsible for the identification and removal of inadmissible noncitizens. The Border Patrol reported 486,651 apprehensions (72 percent of all apprehensions) in 2014, a 16 percent increase from 420,789 in 2013. About 99 percent of Border Patrol apprehensions (479,371) occurred along the Southwest border.
Additionally, ICE Enforcement and Removal Operations made 181,719 administrative arrests (27 percent of total apprehensions in 2014) and ICE Homeland Security Investigations made 11,626 administrative arrests (2 percent).
The leading countries of nationality of those apprehended in 2014 were Mexico, Honduras, Guatemala, and El Salvador. Nationals from these four countries composed 93 percent of all apprehensions. The internal and border apprehensions of Honduran, Guatemalan, and Salvadoran nationals in 2014 increased 92 percent, 275 percent, and 85 percent respectively. Although Mexican nationals constituted more than half (51 percent) of such apprehensions in 2014, their numbers and shares dropped to the lowest level in the past decade, amounting to less than a third of the 1.1 million apprehensions in 2005. Even more strikingly, in 2015 the number of apprehensions of Mexican nationals at U.S. borders reached a 50-year low.
Note: Apprehensions are events, not individuals. In other words, the same individual can be apprehended more than once with each apprehension counted separately.
- Read more about the 50-year low in Mexican migrant border apprehensions in this Pew Research Center study.
How many people are deported per year?
Both removals and returns* result in the confirmed movement of inadmissible or deportable aliens out of the United States. There were 577,295 removals and returns in 2014, a 6 percent drop from 2013 (614,204 removals and returns).
In 2014, returns accounted for 28 percent (162,814) and removals for 72 percent (414,481) of this total. The latter figure represents an all-time high for removals, which have generally increased since 1990 when there were 30,039 removals. At the same time, the number of returns has declined, from 1.02 million in 1990 to 162,814 in 2014 (the lowest since 1968), as the government has prioritized using the more formal removal process, which carries greater consequences if re-entry is attempted.
*Notes: Removals (deportations) are the compulsory and confirmed movement of an inadmissible or deportable unauthorized immigrant out of the United States based on an order of removal. An unauthorized immigrant who is removed has administrative or criminal consequences placed on subsequent re-entry owing to the fact of the removal. Returns are the confirmed movement of an inadmissible or deportable unauthorized immigrant out of the United States not based on an order of removal. Most voluntary departures (returns) are of Mexican nationals who have been apprehended by the Border Patrol and are returned to Mexico.
The government fiscal year runs from October 1 to September 30. All figures for immigration control and enforcement given here are for the government fiscal year.
- For more information, see DHS’ Yearbook of Immigration Statistics: Enforcement Actions (2014).
Naturalization Trends
How many foreign born are naturalized citizens?
In 2014, 20 million immigrants were naturalized U.S. citizens, accounting for 47 percent of the total foreign-born population (42.4 million) and 6 percent of the U.S. population (318.9 million), according to ACS estimates.
How many immigrants naturalize?
USCIS naturalized 653,416 LPRs in 2014, DHS reports. The total number of immigrants naturalized decreased by 16 percent between 2013 and 2014. Although the number of naturalization applications remained relatively stable from 2013 to 2014, the number of pending cases increased substantially.
From a historical perspective, naturalizations have increased dramatically in recent decades. On average, fewer than 120,000 LPRs became citizens each year between 1950 and 1969, 210,000 in the 1980s, 500,000 in the 1990s, and 680,000 during the 2000s. Since 2010, the average annual number of naturalizations has increased to 701,000.
Naturalizations reached an all-time high in 2008, increasing 59 percent from 660,477 in 2007 to 1,046,539 in 2008. This came as a result of impending application fee increases and the promotion of naturalization in advance of the 2008 presidential elections. Naturalizations fell by almost 29 percent in 2009.
- For more information on naturalization trends, see Naturalization Trends in the United States.
How many foreign nationals become U.S. citizens through military naturalization?
In 2014, 7,468 foreign-born military personnel naturalized as U.S. citizens—12 percent higher than in 2013 when 6,652 military personnel became Americans.
- For more historical data on naturalization, see Number of Immigrants Who Became U.S. Citizens, 1910 to 2014.
Between fiscal year (FY) 2002 and 2015, 98,252 foreign-born military personnel have naturalized on U.S. soil. Another 11,069 have become citizens overseas or aboard Navy ships.
- Read USCIS’ Naturalization through Military Service: Fact Sheet.
What are the countries of origin of newly naturalized citizens?
Of those who naturalized in 2014, 15 percent were born in Mexico (94,889), roughly 6 percent in India (37,854), and 5 percent in the Philippines (34,591). Immigrants from these three countries, together with those from China (30,284), Cuba (24,092), Dominican Republic (23,775), Vietnam (18,837), Colombia (16,478), El Salvador (15,598), and Haiti (13,676), comprised the top ten countries of birth for newly naturalized citizens in 2014 and accounted for nearly half (47 percent) of the 653,416 new U.S. citizens that year.
Where do newly naturalized citizens live in the United States?
In 2014, 54 percent of the newly naturalized lived in one of four states. California had the largest number of newly naturalized citizens, with 22 percent (140,234), followed by 12 percent each in Florida and New York (79,637 and 77,717 respectively), and 8 percent in Texas (52,879).
Approximately 15 percent of those who naturalized in 2014 lived in the greater New York metropolitan area (100,250), another 9 percent in the greater Los Angeles metropolitan area (57,674), and 8 percent in the greater Miami metro area (52,544). These areas, together with the greater Washington, DC and Chicago metro areas (4 percent each), and the greater San Francisco, Houston, and Boston areas (about 3 percent each) were home to around half (48 percent) of new U.S. citizens in 2014.
How many green-card holders are eligible to naturalize?
According to the latest available USCIS estimates, 13.3 million LPRs resided in the United States on January 1, 2012. Of them, about 8.8 million were eligible to naturalize.
How long does it take on average for green-card holders to naturalize?
To be naturalized, LPRs must meet a number of criteria, including being at least 18 years of age, having resided in the United States with LPR status continuously for at least five years, and passing English and civic exams.
According to USCIS estimates, immigrants who naturalized in 2014 spent a median of seven years in LPR status before becoming U.S. citizens. The time varied by country of origin: African- and Asian-born immigrants spent about 6 years in LPR status before naturalization, followed by those born in South America (7 years), Europe (8 years), Oceania (9 years), and North America (including Central America, 10 years).
Visa Backlogs
How many visa applications for permanent immigration (green cards) are backlogged?
Two types of backlogs impact the issuance of green cards. The first is due to visa availability. The government caps employment-based, permanent visas for foreign workers and their families at 140,000 per year worldwide. Family-sponsored preferences are limited to 226,000 visas per year. Also, no country can receive more than 7 percent of the total annual number of family-sponsored and employment-based visas (approximately 25,600 visas).
The second type of backlog is due to processing delays of applicants' documents, which is related to government processing capacity as well as increased background and criminal checks.
In April 2016, the U.S. government was still processing some family-sponsored visa applications dating to September 1992, and was still processing some employment-related visa applications from August 2004.
For example, an application filed 21 years ago by a U.S. citizen to sponsor an unmarried adult child from Mexico is potentially just now being approved in April 2016. Similarly, an application filed 24 years ago by a U.S. citizen sponsoring a sibling from the Philippines is potentially only now being approved by USCIS. However, recent years have witnessed dramatic reductions in the backlogs for certain categories of immigrants, particularly the immediate family members (spouses and children) of permanent residents.
Another useful indicator to understand the waiting times is the number of people whose documents are on hold because there are no immigrant visas available for a given family/employment preference or a given country of origin. According to data on the petitions submitted to the Department of State (DOS), there were about 4.6 million applicants (including spouses and minor children) who were on the waiting list as of November 1, 2015. The overwhelming majority were family-sponsored applicants (4.5 million, which includes the principal applicant and their immediate family members). About 101,000 were employment-sponsored applicants and their families. Of the overall 4.6 million applicants, 1.3 million were citizens of Mexico, followed by those from the Philippines (418,000) and India (344,000). What these DOS data do not show is the number of family- and employment-based prospective immigrants who are waiting to adjust their status to legal permanent resident from within the United States. To MPI’s knowledge, the number of people awaiting green cards from within the United States has not been published by USCIS. In other words, the overall number of people waiting for a green card—within and outside of the United States—is larger than the 4.6 million reported by DOS.
- For more details about wait times by immigration category and country of origin, see the State Department’s Visa Bulletin.
- For more on the green-card backlog, read the MPI brief, Going to the Back of the Line: A Primer on Lines, Visa Categories, and Wait Times.
- Read the National Visa Center annual report on immigrant visa applicants.