

Frequently Requested Statistics on Immigrants and Immigration in the United States

A young girl wrapped in the U.S. flag in Memphis, Tennessee. (Photo: Sean Davis)
The United States has been the top destination for international migrants since at least 1960, with one-fifth of the world's migrants living there as of 2017. Despite its long history of immigration, the United States has oscillated between perceiving immigration as a valuable resource and as a major challenge. The 2016 election and significant actions on immigration taken by the Trump administration have further raised the issue in political and public debates. Even more than before, immigration is closely tied to discussions about the U.S. economy and global competitiveness, national security, and the country’s role in humanitarian protection at a time of record global displacement.
Amid these conversations, informed public discussion and evidence-based policymaking require authoritative, unbiased, and timely information. This Spotlight offers in one accessible resource the most current data available about the nearly 44 million immigrants living in the United States in 2016. By compiling some of the most frequently requested facts and figures, this article provides answers to questions such as: How many people have immigrated to the United States, and through which channels? How many entered as refugees, and from which countries? Is Mexico still the top country of origin? Has the number of unauthorized immigrants changed in recent years? What jobs do immigrants tend to hold in the U.S. labor market? And how many U.S. residents are either immigrants or children of immigrants?
The article draws on resources from the Migration Policy Institute (MPI); the U.S. Census Bureau's 2016 American Community Survey (ACS), 2017 Current Population Survey (CPS), and 2000 decennial census; the most recent data from the U.S. Departments of Homeland Security (DHS) and State; and Mexico's National Population Council (CONAPO) and National Institute of Statistics and Geography (INEGI).
Click on the bullet points for more information on each topic:
- Current and Historical Numbers and Shares
- Demographic, Educational, and Linguistic Characteristics
- Immigrant Population Change Over Time: Top States
- Mexican Immigrants
- Health Insurance Coverage
- Workforce Characteristics
- Children with Immigrant Parents
- Permanent Immigration
- Temporary Visas
- Refugees and Asylum Seekers
- Unauthorized Immigrants
- Immigration Enforcement
- Naturalization Trends
- Visa Backlogs
Current and Historical Numbers and Shares
How many immigrants reside in the United States?
More than 43.7 million immigrants resided in the United States in 2016, accounting for 13.5 percent of the total U.S. population of 323.1 million, according to American Community Survey (ACS) data. Between 2015 and 2016, the foreign-born population increased by about 449,000, or 1 percent, a rate slower than the 2.1 percent growth experienced between 2014 and 2015.
Immigrants and their U.S.-born children now number approximately 86.4 million people, or 27 percent of the overall U.S. population, according to the 2017 Current Population Survey (CPS).
- Check out the U.S. Immigrant Population and Share over Time, 1850-Present tool in MPI’s Data Hub to see fluctuations over time.
How many immigrants moved to the United States in 2016?
In 2016, 1.49 million foreign-born individuals moved to the United States, a 7 percent increase from the 1.38 million coming in 2015. India was the leading country of origin, with 175,100 arriving in 2016, followed by 160,200 from China/Hong Kong, 150,400 from Mexico, 54,700 from Cuba, and 46,600 from the Philippines. India and China surpassed Mexico in 2013 as the top origin countries for recent arrivals. Among the top countries of recent immigrants, many more Cuban born arrived in 2016 (54,700) compared to 2015 (31,500)—an increase of 74 percent. In contrast, Canadian arrivals dropped 19 percent: 38,400 in 2016, versus 47,300 in 2015.
While most of these arrivals are new to the United States, some may have previously resided in the country. Newly arrived immigrants are defined here as foreign-born individuals (ages 1 and older) who resided abroad one year prior to the survey, including naturalized citizens, lawful permanent residents, and others who might have lived in the United States for some time prior to 2016; as well as temporary nonimmigrants and unauthorized immigrants.
- Read about changing trends in new arrivals in this article, In Historic Shift, New Migration Flows from Mexico Fall Below Those from China and India.
How have the number and share of immigrants in the United States changed over time?
Data on the nativity of the U.S. population were first collected in 1850. That year, there were 2.2 million immigrants, representing nearly 10 percent of the U.S. population.
Between 1860 and 1920, the immigrant share of the overall population fluctuated between 13 percent and almost 15 percent, peaking at 14.8 percent in 1890, mainly due to high levels of immigration from Europe.
Restrictive immigration laws in 1921 and 1924, coupled with the Great Depression and World War II, led to a sharp drop in new arrivals. As a result, the foreign-born share steadily declined, hitting a record low of approximately 5 percent in 1970 (9.6 million; see Table 1). Since then, the share and number of immigrants have increased rapidly, mainly because of large-scale immigration from Latin America and Asia made possible by the Immigration Act of 1965, which abolished national-origin admission quotas. The immigrant population more than quadrupled in the decades since, reaching 43.7 million in 2016.
Table 1. Size and Share of the Foreign-Born Population in the United States, 1970-2016
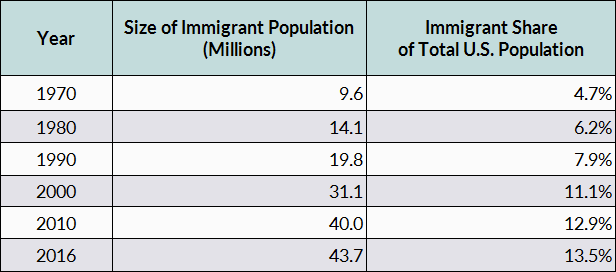
Source: Migration Policy Institute (MPI) tabulation of data from the U.S. Census Bureau 2010 and 2016 American Community Surveys (ACS), and 1970-2000 decennial Census data.
- Read about U.S. immigration trends and policies in Immigration in the United States: New Economic, Social, Political Landscapes with Legislative Reform on the Horizon.
- Read more about the impact of the 1965 Immigration and Nationality Act in Fifty Years On, the 1965 Immigration and Nationality Act Continues to Reshape the United States.
- Read more about the end of national-origin quotas in The Geopolitical Origins of the U.S. Immigration Act of 1965.
How do today’s top source countries compare to those 50 years ago?
In 2016, Mexicans accounted for approximately 26 percent of immigrants in the United States, making them by far the largest foreign-born group in the country. Indians were next, comprising close to 6 percent, followed by Chinese (including immigrants from Hong Kong but not Taiwan) with 5 percent, and Filipinos at 4 percent. Immigrants from El Salvador, Vietnam, and Cuba (about 3 percent each), and those from the Dominican Republic, South Korea, and Guatemala (2-2.5 percent each), rounded out the top ten. Together, these groups represented 58 percent of the U.S. immigrant population in 2016.
The predominance of Latin American and Asian immigration in the late 20th and early 21st centuries starkly contrasts with the trend in the mid-1900s, when immigrants were largely European. In the 1960s no single country accounted for more than 15 percent of the total immigrant population. Italians were the top origin group, making up 13 percent of the foreign born in 1960, followed by Germans and Canadians (about 10 percent each).
To learn more about key immigrant populations, check out our Spotlight archive, which includes data-rich articles on Mexican, Indian, Chinese, Vietnamese, Korean, South American, European, African, Asian, and other immigrant groups.
- For an interactive tool showing the top ten source countries by decade, check out Largest U.S. Immigrant Groups over Time, 1960-Present.
- To see immigration trends from individual countries over time, use this MPI Data Hub tool.
- See where immigrants live by country or region of origin, using interactive maps at U.S. state and county and metropolitan-area levels.
Demographic, Educational, and Linguistic Characteristics
Note: In some cases, percentages do not add up to 100 due to rounding.
What is the gender composition of the U.S. immigrant population?
In 2016, approximately 52 percent of immigrants were female. The share has fluctuated slightly over the past three decades; women accounted for 53 percent of immigrants in 1980, 51 percent in 1990, and 50 percent in 2000.
What is the immigrant age distribution?
Overall, the immigrant population in 2016 was older than the U.S.-born population. The median age of immigrants was 44.4 years, compared to 36.1 years for the native born. The latter are younger largely because most children of immigrants are born in the United States and a significant share are under age 18. In 2017, of all U.S. born with at least one immigrant parent, 44 percent were children ages 0 to 17, compared to 23 percent of those with U.S.-born parents.
In 2016, fewer than 1 percent of immigrants were under age 5 (compared to 7 percent for the native born), approximately 5 percent were ages 5 to 17 (versus 19 percent), 79 percent were ages 18 to 64 (compared to 59 percent), and 15 percent were ages 65 and older (the same as the U.S. born).
- View interactive tools for the Age-Sex Pyramids of U.S. Immigrant and Native-Born Populations, 1970-Present as well as for the nine largest immigrant-origin groups in 2016.
How many immigrants have entered the United States since 2010?
Almost 19 percent of the 43.7 million immigrants in the United States in 2016 entered since 2010, 27 percent between 2000 and 2009, and the majority (55 percent) before 2000.
How many immigrants are naturalized U.S. citizens?
In 2016, about 49 percent of immigrants (21.2 million) were naturalized citizens. The remaining 22.5 million included lawful permanent residents, unauthorized immigrants, and legal residents on temporary visas (such as students and temporary workers).
Of the 21.2 million naturalized citizens, more than 25 percent were naturalized between 2010 and 2016, 32 percent between 2000 and 2009, and 44 percent prior to 2000.
What is the racial composition of the immigrant population?
Forty-six percent of immigrants in 2016 reported their race as White, 27 percent as Asian, 9 percent as Black, and 15 percent as some other race; slightly more than 2 percent reported having two or more races.
How many immigrants are of Hispanic origin?
In 2016, almost 45 percent of immigrants (19.6 million people) reported having Hispanic or Latino origins.
Note: The U.S. Census Bureau classifies Hispanic and Latino as ethnic categories, separate from the racial categories listed above (see Definitions box for more information).
How many Hispanics in the United States are immigrants?
The majority of U.S. Hispanics are native born. Of the 57.4 million people in 2016 who self-identified as Hispanic or Latino, 34 percent (19.6 million) were immigrants.
- Use our State Immigration Data Profiles tool to learn more about the demographic characteristics of immigrants and the U.S. born (including race and ethnicity) in each of the 50 states and the District of Columbia, as well as nationally.
Which languages are most frequently spoken at home?
In 2016, approximately 78 percent (237.8 million) of the 303.3 million people ages 5 and older in the United States reported speaking only English at home.
The remaining 22 percent (65.5 million) reported speaking a language other than English at home. Of the top languages, Spanish was by far the most common (62 percent), followed by Chinese (5 percent, including Mandarin and Cantonese), Tagalog (almost 3 percent), and Vietnamese, Arabic, French (including Cajun), and Korean (about 2 percent each). The remaining nine out of the top 15 languages each accounted for approximately 1 percent: Russian, German, Haitian Creole, Hindi, Portuguese, Italian, Polish, and Amharic/Somali/other Afro-Asiatic languages.
How many people are Limited English Proficient?
In 2016, there were 26.1 million Limited English Proficient (LEP) individuals ages 5 and older, representing less than 9 percent of the 303.3 million U.S. residents ages 5 and older. Spanish speakers accounted for 64 percent (16.6 million) of the LEP population. The next two languages most commonly spoken by LEP individuals were Chinese (1.9 million, or 7 percent, including Mandarin and Cantonese) and Vietnamese (875,700, or 3 percent).
Note: The term "Limited English Proficient" refers to persons ages 5 and older who reported speaking English "not at all," "not well," or "well" on their survey questionnaire. Individuals who reported speaking “only English” or speaking English "very well" are considered proficient in English.
- Read more about the LEP population in Language Diversity and English Proficiency in the United States.
- Click here for data on the total number and share of the LEP population by state in 1990, 2000, 2010, and 2016.
What percentage of immigrants are Limited English Proficient?
In 2016, approximately 49 percent (21.3 million) of the 43.4 million immigrants ages 5 and older were LEP.
What share of the adult foreign-born population is college educated?
In 2016, 30 percent (11.5 million) of the 38.2 million immigrants ages 25 and older had a bachelor's degree or higher, compared to 32 percent of U.S.-born adults. Notably, the share of college-educated immigrants was much higher—47 percent—among those who entered the country in the previous five years (between 2012 and 2016). At the other end of the educational spectrum, 29 percent of all immigrant adults lacked a high school diploma or General Educational Development (GED) certificate, compared to 9 percent of their U.S.-born counterparts.
Educational attainment varied by country of origin. For example, immigrants from several countries were extremely educated: 78 percent from India and 74 percent from Taiwan had at least a bachelor’s degree. (By comparison, just under 32 percent of the U.S. born had a bachelor’s degree or higher.)
- Click here for data on the educational attainment among U.S.-born adults and all immigrant adults by country of birth in 2016.
- Read more about the socioeconomic characteristics of highly skilled immigrants in College-Educated Immigrants in the United States.
- Use our State Immigration Data Profiles tool for information on the language and educational characteristics of immigrants and the U.S. born in each of the 50 states, the District of Columbia, and the country overall.
Immigrant Population Change over Time: Top States
What were the top five states in terms of the number of immigrants, share of immigrants in the total state population, absolute growth, and percent growth between 1990 and 2000 and between 2000 and 2016?
In 2016, the top five U.S. states by number of immigrants were California (10.7 million), Texas (4.7 million), New York (4.5 million), Florida (4.2 million), and New Jersey (2 million).
When classified by the share of immigrants out of the total state population, the top five states in 2016 were California (27 percent), New York (23 percent), New Jersey (23 percent), Florida (21 percent), and Nevada (20 percent).
While traditional immigrant destinations comprised the top states by absolute number of new immigrants, other states saw much larger relative growth in their immigrant populations (see Table 2).
Table 2. Top Five States by Absolute and Percent Growth in Immigrant Population, 1990-2000 and 2000-16
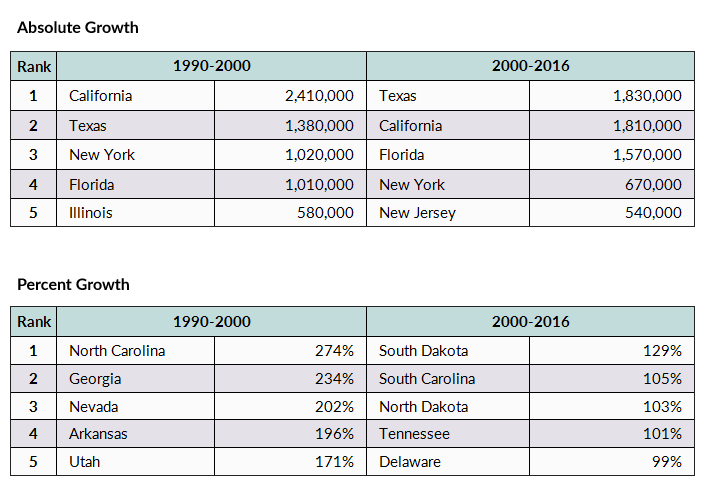
Note: In some states, the initial foreign-born population was quite small. Thus, relatively small absolute increases in the immigrant population in these states have translated into high percent growth.
Source: MPI tabulation of data from the U.S. Census Bureau 2016 ACS and 1990 and 2000 Decennial Census.
- For more information on the top states of residence for the foreign born, see the interactive tool, Immigrant Population by State, 1990-Present.
Mexican Immigrants
How many Mexican immigrants are in the United States?
Approximately 11.6 million Mexican immigrants resided in the United States in 2016, according to the ACS. Mexicans accounted for 26 percent of all U.S. immigrants, down from the peak of 30 percent in 2000.
In which U.S. states do Mexican immigrants live?
Mexican immigrants are primarily concentrated in the West and Southwest, and more than half live in California or Texas. In 2016, the top five states of residence for Mexican immigrants were California (37 percent of all Mexican immigrants), Texas (22 percent), Illinois (6 percent), Arizona (4 percent), and Florida (2 percent).
- Use this interactive map to learn the top states and counties where individual immigrant populations reside.
- Use this interactive map to learn the top metropolitan areas where individual immigrant populations reside.
In 2016, Mexicans accounted for more than half of the foreign-born population in New Mexico (69 percent), Texas and Arizona (55 percent each), and Idaho (51 percent). By contrast, Mexicans accounted for 2 percent or less of all immigrants in Hawaii (2 percent), Massachusetts (1.4 percent), and Maine (0.7 percent).
How many Mexican-born workers are in the U.S. labor force?
About 69 percent of the 11.2 million immigrants from Mexico ages 16 and older were in the civilian labor force in 2016. This represents a higher labor force participation than for the overall foreign-born population ages 16 and older (66 percent of 41.8 million) and the native-born population ages 16 and older (62 percent of 216.2 million).
How has the emigration rate from Mexico changed over time?
According to Mexico's National Survey of Occupations and Employment (Encuesta Nacional de Ocupación y Empleo, or ENOE), the emigration rate from Mexico has remained steadily low in recent years, after a drop following the 2007-09 U.S. recession. From 2008 to 2012, the emigration rate fell from 6.4 migrants per 1,000 residents to 3.3 migrants. It ticked up slightly in 2015 to 3.6 migrants per 1,000 residents. The emigration rate refers to emigrants leaving Mexico regardless of their destination, although most head to the United States.
The immigration rate to Mexico (overwhelmingly comprised of return migrants) has also dropped, from 4.4 migrants per 1,000 residents in 2008 to 1.4 per 1,000 in 2015.
Note: ENOE asks Mexican households to tally any members of the household who are living abroad at the time of the interview. Accordingly, it does not capture the emigration of entire families where no member of the household remains in Mexico.
Which areas/regions do most Mexican migrants come from?
According to the Survey of Migration on the Northern Border of Mexico (Encuesta de Migración en la Frontera Norte de México, or EMIF), the number of Mexicans moving to the United States decreased steadily between 2007 and 2015, despite an uptick in 2013. EMIF estimated that 96,000 immigrants crossed the country's northern border in 2015—roughly 30 percent of the 323,000 recorded in 2013.
In 2015, traditional sending states such as Guanajuato, Chiapas, and Michoacán accounted for the largest shares of the 96,000 migrants who headed toward the United States, collectively representing 27 percent of northward flows. Between 2009 and 2015, some states in northern and central Mexico witnessed a decline in total outflows, while others experienced increased emigration. The most significant drop was recorded in the state of Coahuila (northern Mexico, bordering Texas): Between 2009 and 2015, migrants from Coahuila declined from 8 percent to 2 percent of the total outflow from Mexico. During the same period, migrants from Chihuahua (northern Mexico, bordering Texas) grew in share by twelvefold, from 0.5 percent to 6 percent of the total outflow, and Chiapas (western Mexico) more than quadrupled its share (from 2 percent to 9 percent).
- For a map of flows by Mexican state over time, visit MPI’s data tool, Origins of Mexican Migrants to the United States by Mexican State of Residence, Number, and Share, 2004-2015.
Note: EMIF is an annual sample survey of migration flows along Mexico's northern border region conducted by the Ministry of Foreign Affairs (SRE), Secretariat of Labor and Social Welfare (STPS), National Migration Institute (INM), National Population Council (CONAPO), and College of the Northern Border (COLEF) in Tijuana. The survey excludes Mexicans entering the United States by air, migrants under the age of 15, and non-Mexican nationals crossing the U.S.-Mexico border. The category "migrants headed toward the United States" is restricted to those migrants who are traveling to the United States or a Mexican border city, are ages 15 and older, were not born in the United States, and do not have an immediate return itinerary. The 2015 data are preliminary.
- Read more about the characteristics of Mexicans migrating to the United States from the Instituto Nacional de Estadística y Geografía, INEGI (in Spanish).
- Read the ENOE survey (in Spanish).
- More information on Mexican migration is available at EMIF (in Spanish).
Health Insurance Coverage
What share of immigrants have health insurance?
In 2016, approximately 56 percent of immigrants in the United States had private health insurance (compared to 70 percent of the U.S. born), and 30 percent had public health insurance coverage (compared to 36 percent of the native born). About 20 percent were uninsured, compared to 7 percent of the U.S. born.
Note: Health insurance coverage is calculated only for the civilian, noninstitutionalized population. Since some people may simultaneously hold both private and public health insurance coverage, estimates of those with public health insurance and those with public coverage may overlap. Their sum therefore may be greater than the total number of people with health insurance.
How has coverage changed for immigrants in the United States since enactment of the Affordable Care Act (ACA)?
Since ACA implementation in 2014, health insurance coverage has improved for both the U.S. born and immigrants. From 2013 to 2016, the immigrant uninsured rate fell from 32 percent to 20 percent, and the rate for the native born fell from 12 percent to 7 percent. The improvement in coverage is related to increases in both private coverage (from 50 percent to 56 percent of immigrants) and public coverage (from 24 percent to 30 percent of immigrants). Among the foreign born, noncitizens experienced a greater drop in the uninsured rate (from 46 percent to 32 percent) than naturalized citizens (from 16 percent to 8 percent).
Workforce Characteristics
What is the immigrant share of the total U.S. civilian labor force?
Immigrants accounted for 17 percent (27.6 million) of the 161.8 million persons in the civilian labor force in 2016. Between 1970 and 2016, the percentage of the foreign born in the labor force more than tripled, from 5 percent to 17 percent. Over the same period, the foreign-born share of the total population grew more slowly: from less than 5 percent to 13.5 percent.
- For more on the share of immigrants in the labor force nationwide and by state since 1980, see Immigrant Share of the U.S. Population and Civilian Labor Force, 1980-Present.
What types of jobs do immigrants hold?
Of the 26.2 million employed foreign-born workers ages 16 and older in 2016, the largest share, at almost 32 percent, worked in management, professional, and related occupations. See Table 3 for other occupations.
Table 3. Employed Workers in the Civilian Labor Force (ages 16 and older) by Nativity and Occupation, 2016
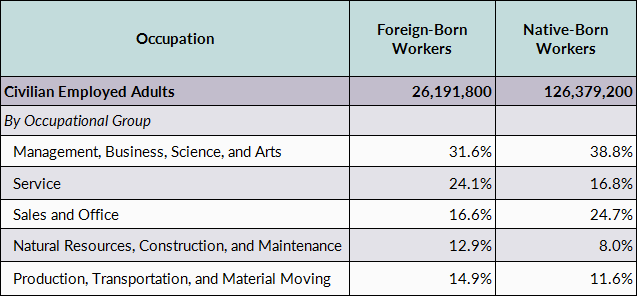
Note: Numbers may not add up to 100 as they are rounded to the nearest whole number.
Source: MPI tabulation of data from the U.S. Census Bureau 2016 ACS.
- Check out our State Immigration Data Profiles for more information on the workforce characteristics of immigrants and the U.S. born in the United States, each of the 50 states, and the District of Columbia.
Children with Immigrant Parents
How many U.S. children live with immigrant parents?
In 2016, approximately 18 million children under age 18 lived with at least one immigrant parent. They accounted for 26 percent of the 70 million children under age 18 in the United States.
Second-generation children—born in the United States to at least one foreign-born parent—accounted for 88 percent (15.9 million) of all children under age 18 with immigrant parents. The remaining 12 percent (2.1 million) were born outside the United States.
- For state-by-state and age group information on children living with immigrant parents, including both first- and second-generation, see the Children in U.S. Immigrant Families tool.
How has the number of children ages 0-17 living with immigrant parents changed?
Between 1990 and 2000, the number of children ages 17 and under with immigrant parents grew 60 percent, from 8.2 million to 13.1 million. Between 2000 and 2016, the number grew 38 percent, from 13.1 million to almost 18 million.
The population of foreign-born children grew significantly between 1990 and 2000, increasing 43 percent (from 1.9 million to 2.7 million), but declined 21 percent between 2000 and 2016, from 2.7 million to 2.1 million.
Meanwhile, the number of second-generation immigrant children has grown steadily since 1990. Between 1990 and 2000, the number increased by 65 percent (from 6.3 million to 10.4 million). Between 2000 and 2016, this population grew 53 percent (from 10.4 million to 15.9 million).
In 1990, 13 percent of all children in the United States lived with immigrant parents. This share increased to 19 percent in 2000 and 26 percent in 2016. A rising share of all children in immigrant households are born in the United States, growing from 77 percent in 1990 to 80 percent in 2000 and 88 percent in 2016.
How many children living with immigrant parents are in low-income families?
In 2016, there were 28.4 million children under age 18 living in poor families (i.e., with family incomes below 200 percent of the federal poverty threshold). Of these, more than 9.1 million (or 32 percent) were children of immigrants.
- For state-level estimates, see the Demographics and Social Profiles in the State Immigration Data Profiles tool.
What are the top five states in terms of the number of children living with immigrant parents?
In 2016, the top five states by the total number of children under age 18 living with immigrant parents were California (4.3 million), Texas (2.4 million), New York (1.5 million), Florida (1.3 million), and New Jersey (747,000). These five states accounted for 57 percent of all children with immigrant parents residing in the United States.
What are the top five states by share of children living with immigrant parents in the total child population?
In terms of the share of children under age 18 living with immigrant parents, the top five states in 2016 were California (49 percent of all children in the state), Nevada and New Jersey (39 percent each), New York (38 percent), and Texas (35 percent).
While traditional immigrant destinations experienced the most absolute growth in the children of immigrants population, other states saw much larger relative growth (see Table 4).
Table 4. Top Five States by Absolute and Percent Growth in Children of Immigrants, 1990-2000 and 2000-16
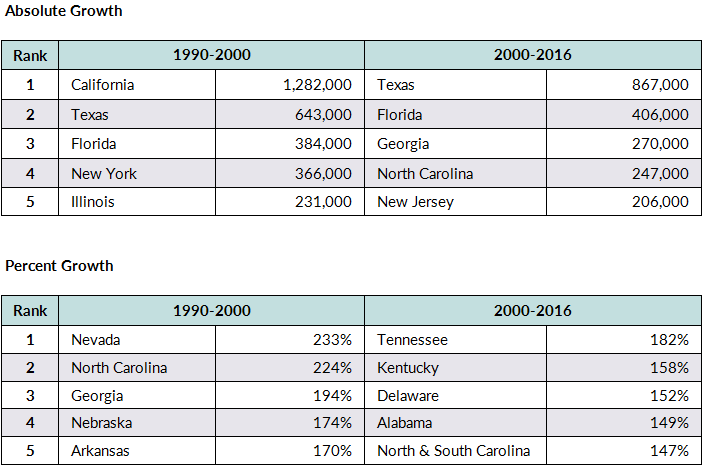
Source: MPI tabulation of data from the U.S. Census Bureau 2016 ACS and 1990 and 2000 Decennial Census.
Permanent Immigration
How many immigrants obtained lawful permanent residence (aka getting a green card) in the United States in 2016?
In fiscal year (FY) 2016, 1,183,505 people became lawful permanent residents (LPRs), also known as green-card holders, according to Department of Homeland Security (DHS) data. Although the number of new LPRs in 2016 increased almost 13 percent from 2015 (1,051,031), it remained lower than the level reached in 2006 (1,266,129), the highest in the past decade.
New arrivals comprised approximately 52 percent (618,078) of those granted LPR status in 2016; the remaining 565,427were status adjusters—persons already in the country whose green-card applications were approved that year. The share of new arrivals rose steadily in the past decade from 35 percent in 2006, to 41-42 percent in 2007-09, and 47-48 percent in 2012-15, surpassing 50 percent in 2016.
- See the chart Legal Immigration to the United States, 1820-Present.
Under which categories are permanent immigrants admitted?
Of the more than 1 million new green-card holders in 2016, 48 percent were immediate relatives of U.S. citizens, 20 percent entered through a family-based preference, and 12 percent via an employment-based preference. Another 13 percent adjusted from refugee or asylee status, and 4 percent were diversity lottery winners.
Which countries did permanent immigrants come from?
The top five countries of birth for new LPRs in 2016 were Mexico (15 percent), China (7 percent), Cuba (6 percent), and India and the Dominican Republic (5 percent each). These five countries represented about 38 percent of all persons who received green cards in 2016.
Individuals born in the next five countries—the Philippines (5 percent), Vietnam (4 percent), and Haiti, El Salvador, and Jamaica (2 percent each)—accounted for another 14 percent of all LPRs.
How many people apply for the green-card lottery?
The Immigration Act of 1990 established the Diversity Visa Program (also known as the DV lottery or the green-card lottery) to allow entry to immigrants from countries with low rates of immigration to the United States. From the very beginning, the program has been controversial. There were several attempts to either revise it or eliminate it in favor of other streams of immigrants. At the time of this writing, the DV lottery faced its most significant challenge yet as the Trump administration and many Republicans in Congress push for its elimination.
The law states that 55,000 diversity visas be made available each fiscal year, of which 5,000 must be used for applicants under the Nicaraguan and Central America Relief Act of 1997. Interest in the lottery is significantly higher than there are available visas: About 12.4 million qualified applications were registered for both the DV-2017 and the DV-2016 programs. For the DV-2018 program, 14.7 million qualified applications were registered (23.1 million people including spouses and children), a 19 percent increase from the previous year. (The application number varies each year depending on which countries are eligible.)
In FY 2016, 49,865 people received green cards as diversity immigrants, representing close to 4 percent of the 1 million new LPRs.
Before receiving permission to immigrate to the United States, lottery winners must provide proof of a high school education or its equivalent or show two years of work experience within the past five years in an occupation that requires at least two years of training or experience. They also must pass a medical exam and a background check.
- Read the State Department’s Visa Bulletin for July 2017 for more on the DV-2018 lottery results.
Temporary Visas
How many people entered the United States on nonimmigrant visas? How many times did they enter?
In 2016, 42.7 million individuals entered the United States as I-94 nonimmigrants, on various temporary visas. This is the first time the Department of Homeland Security (DHS) Office of Immigration Statistics (OIS) estimated the number of unique individuals who came temporarily, as opposed to the number of nonimmigrant admissions or entries.
Most of these nonimmigrants, 34.2 million, entered as tourists, followed by 3.7 million business visitors. Of these, 15 million tourists and 1.7 million business travelers were from Visa Waiver countries. Further, 1 million international students entered on F-1 visas. OIS estimated that additionally about 290,300 individuals were admitted on highly skilled worker H-1B visas (mostly from India, China, Canada, the United Kingdom, and Mexico) and 81,600 on nonagricultural temporary or seasonal worker H-2B visas (mostly from Mexico, Jamaica, Guatemala, South Africa, and Canada).
In total these individuals recorded 76.8 million I-94 entries in 2016, each making an average of 1.8 trips to the United States that year. Total temporary admissions of I-94 nonimmigrants increased only slightly, from 76.6 million in 2015. In 2016, tourists and business travelers represented 90 percent (69.1 million) of all I-94 admissions. Of those, 60.8 million were tourist admissions and 8.3 million were business-traveler admissions.
Temporary workers and trainees, as well as their spouses and children, accounted for 3.9 million admissions (about 5 percent of total I-94 admissions). This group includes H-1B "specialty occupation" workers, registered nurses, temporary agricultural and nonagricultural workers, North American Free Trade Agreement (NAFTA) professional workers, treaty traders, and intracompany transferees.
Students who entered to study at academic or vocational institutes made up close to 2 million admissions or about 3 percent of arrivals (this figure includes their family members). Exchange visitors on J-1 visas and their families accounted for another 1 percent of nonimmigrant admissions (or about 574,600).
In addition to the I-94 entries, there were an estimated 101.9 million admissions of travelers exempt from completing the I-94 arrival/departure form at the port of entry. Canadians traveling for business or pleasure, and Mexicans who possess a nonresident Border Crossing Card (i.e., laser visa) are exempt. These two groups of tourists and business travelers made up the majority of the total 178.7 million nonimmigrant admissions.
Note: Nonimmigrant admissions represent the number of arrivals, not the number of individuals admitted to the United States. OIS only reports characteristics of nonimmigrants who must complete an I-94 arrival/departure form.
How many nonimmigrant visas does the State Department issue?
In FY 2016, the State Department issued 10.4 million nonimmigrant visas—a 5 percent decrease from the 10.9 million issued a year earlier.
The vast majority (78 percent) of the 10.4 million nonimmigrant visas issued in FY 2016 were temporary business and tourist visas (B-1, B-2, and BCC visas). The next largest visa class was H visa categories for temporary workers and trainees and their family members (more than 5 percent), followed by F visa categories (F-1, F-2, and F-3) for academic students and exchange visitors and their family members, who comprised under 5 percent of all nonimmigrant visas issued.
Looking at the distribution of the temporary visas issued in 2016 by region of origin, the largest shares were issued to nationals from Asia (45 percent), North America (20 percent, including Mexico, Central America, and the Caribbean), and South America (17 percent), followed by Europe (11 percent), Africa (5 percent), and Oceania (0.7 percent).
Note: The number of visas issued does not necessarily match the number of foreign nationals who entered the United States in the same year because some nonimmigrant visas may not be used.
- For more information, see State Department publication Report of the Visa Office 2016.
How many foreign nationals on temporary visas resided in the United States?
According to the most recently available DHS estimates, 2 million foreign nationals on various temporary visas resided in the United States during 2015, up from about 1.8 million a year earlier. About 45 percent (930,000) were temporary workers and their families, followed by 770,000 foreign students and their families (38 percent). Fifty-four percent were from Asia. Nationals of countries in Europe and North America accounted for 14 percent and 15 percent, respectively. The top five countries of origin—India, China, Mexico, Canada, and South Korea—accounted for 56 percent of all residents on temporary visas.
Note: This estimate includes temporary workers, students, exchange visitors, diplomats, and representatives of foreign governments and international organizations. It excludes tourists and other short-term visitors. North America includes Canada, Bermuda, Mexico, other Central America, and the Caribbean.
- Read about the size of the nonimmigrant population in the DHS publication, Estimates of the Size and Characteristics of the Resident Nonimmigrant Population in the United States.
Refugees and Asylum Seekers
How many refugees entered the United States, and where were they from?
Every year, the president in consultation with Congress sets the annual refugee admissions ceiling and allocations by region of origin. In a series of executive orders, President Trump halved the Obama administration’s FY 2017 admissions ceiling from 110,000 to 50,000, suspended all refugee admissions for 120 days, and limited admissions of refugees from Chad, Iran, Libya, North Korea, Somalia, Syria, Venezuela, and Yemen. The administration also set the refugee ceiling at 45,000 for FY 2018, the lowest level since the program began in 1980.
According to State Department Worldwide Refugee Admissions Processing System (WRAPS) data, 53,716 refugees were resettled in FY 2017, a 37 percent drop compared to the 84,994 resettled in 2016. The Democratic Republic of the Congo (DRC), Iraq, Syria, Somalia, and Myanmar (also known as Burma) were the primary countries of nationality, accounting for 63 percent (34,028) of all refugees resettled in 2017. Rounding out the top ten were Ukraine, Bhutan, Iran, Eritrea, and Afghanistan. Together, nationals of these ten countries comprised 89 percent (47,647) of all refugee arrivals in 2017.
- For more information on the U.S. refugee resettlement system, read the MPI fact sheet Ten Facts About U.S. Refugee Resettlement.
- For more data on refugees in the United States, including top resettlement states, read Refugees and Asylees in the United States.
- For more information on resettled Syrian refugees, read Syrian Refugees in the United States.
How many asylum applications were filed in the United States, and where are asylum seekers from?
In FY 2016, an estimated 115,399 affirmative asylum applications were filed with U.S. Citizenship and Immigration Services (USCIS)—39 percent more than in FY 2015 and the highest level since 1995. This represented the seventh consecutive annual increase in application volume. Applicants for affirmative asylum must be present in the United States or arriving at a port of entry, and do not include those seeking asylum through the defensive asylum process while in removal proceedings.
China remained the top country of origin for affirmative asylum applications, with 16,490 in FY 2016; followed by 14,773 from Venezuela and 14,663 from Mexico. Affirmative asylum applications from the Northern Triangle countries of Central America (El Salvador, Guatemala, and Honduras) have also risen dramatically in the past three years, from 7,723 to 25,801.
Meanwhile, 65,218 defensive asylum applications were filed with the Department of Justice's Executive Office for Immigration Review (EOIR) in FY 2016, a 42 percent increase from 45,779 applications a year earlier. Northern Triangle countries accounted for 61 percent (39,881) of total applications, followed by Mexico (20 percent or 12,831) and a much smaller share from China (3 percent or 1,840 cases).
How many people received asylum status, and where are they from?
In FY 2016, 20,455 individuals, including principal applicants and their spouses and/or unmarried children under age 21, were granted asylum after seeking protection upon or after arrival in the United States—a 22 percent drop from 26,124 a year earlier. An additional 5,490 individuals outside the United States were approved for asylum as immediate family members of principal applicants. (Note that this number reflects travel documents issued to these family members, not their arrival in the United States.) The big drop in asylum grants and the follow-to-join cases are mainly due to the mounting backlog in the USCIS Asylum Division, as a growing number of USCIS asylum officers have been diverted from the affirmative interview process to conduct credible and reasonable fear screening interviews with adults and families apprehended or found inadmissible at the U.S. border who express an intention to seek asylum.
China was the top country of origin for those receiving asylum, with 4,484 persons (or 22 percent of total asylum grants). The next four largest countries of origin were El Salvador (2,157), Guatemala (1,949), Honduras (1,505), and Mexico (919). Together, nationals of these five countries made up 32 percent of those receiving asylum in FY 2016.
- For more information, see the Source article Refugees and Asylees in the United States.
- Read the DHS report Refugees and Asylees: 2016 for recent figures and trends.
Unauthorized Immigrants
How many unauthorized immigrants are in the United States?
An estimated 11.4 million unauthorized immigrants resided in the United States as of January 2012 compared to 11.5 million in January 2011, according to the most recent estimates issued by the DHS Office of Immigration Statistics. These results suggest little to no change in the unauthorized immigrant population from 2011 to 2012.
The Migration Policy Institute estimated 11 million unauthorized immigrants resided in the United States in 2014. More than half (54 percent) resided in four states: California (27 percent), Texas (13 percent), New York (8 percent), and Florida (6 percent). The vast majority (81 percent) lived in 171 counties with 10,000 or more unauthorized immigrants each, of which the top five—Los Angeles County, CA; Harris County, TX; Cook County, IL; Orange County, CA; and Queens County, NY—accounted for 21 percent of all unauthorized immigrants.
- See Unauthorized Immigrant Population Profiles for detailed sociodemographic information for the United States, 41 states and the District of Columbia, and 121 counties.
Note: MPI is among a small number of organizations generating estimates of the unauthorized population because the U.S. Census Bureau does not. It is important to acknowledge that the estimates issued by MPI and others (including the DHS Office of Immigration Statistics, Pew Research Center, and Center for Migration Studies of New York) are based on different methodologies and data sources. Hence the estimates are not fully comparable.
Where are unauthorized immigrants from?
Mexico and Central America accounted for most unauthorized immigrants in the United States as of 2010-14, with MPI estimating about 7.9 million people in total (71 percent of the overall unauthorized population). About 1.5 million (13 percent) were from Asia; 673,000 (6 percent) from South America; 432,000 (4 percent) from Europe, Canada, or Oceania; 353,000 (3 percent) from Africa; and 232,000 (2 percent) from the Caribbean.
The top five countries of birth for unauthorized immigrants were Mexico (56 percent), Guatemala (7 percent), El Salvador (4 percent), Honduras (3 percent), and China (2 percent).
- See Unauthorized Immigrant Populations by Country and Region, Top States and Counties of Residence, 2010-14 for top concentrations of unauthorized immigrants by country or region of origin.
- See An Analysis of Unauthorized Immigrants in the United States by Country and Region of Birth for a detailed profile by country and region of origin.
How many unauthorized immigrants lived with children under age 18?
As of 2010-14, about 4 million unauthorized immigrants (39 percent of the overall unauthorized population ages 15 and older) lived with children under age 18, MPI estimates. Of this group, about 85 percent (3.4 million) resided with at least one U.S.-citizen child under age 18, and 15 percent (573,000) lived with only non-U.S.-citizen children.
How many children under age 18 lived with at least one unauthorized immigrant parent?
Approximately 5.1 million children under age 18 lived with an unauthorized immigrant parent during the 2009-13 period, representing 7 percent of the U.S. child population. About 79 percent (4.1 million) of these children were U.S. citizens, another 19 percent (959,000) were themselves unauthorized, and 2 percent (113,000) were legally present, including LPRs and those with temporary visas.
- See A Profile of U.S. Children with Unauthorized Immigrant Parents for the number, characteristics, and socioeconomic status of children under age 18 living with an unauthorized immigrant parent.
How many people were eligible for the Deferred Action for Childhood Arrivals (DACA) program and how many applications have been received since its launch in 2012?
The DACA program, announced on June 15, 2012, offered a two-year grant of deportation relief and work authorization to eligible young unauthorized immigrants. Requirements for eligibility included:
- being at least 15 years old;
- having entered the United States before the age of 16;
- having continuously resided in the United States since June 15, 2007;
- being enrolled in school, having earned a high school diploma or its equivalent, or being an honorably discharged veteran; and
- having not been convicted of a felony, significant misdemeanor, or three or more misdemeanors; or otherwise posing a threat to public safety or national security.
MPI estimates that as of 2017 approximately 1.3 million people met all criteria to apply, 408,000 met all criteria except for education, and 120,000 would be eligible upon turning 15 provided they remain in school.
Between August 15, 2012, when USCIS began accepting applications, and September 30, 2017, 906,693 initial applications were accepted for consideration. Thus, as of September 30, 2017 (the most recent data made public by USCIS at the time of this writing), about 68 percent of the immediately eligible population had applied. USCIS approved 798,980 (or 88 percent) of these initial applications as of September 30, 2017; 71,680 (8 percent) were denied and the remainder were pending.
The top states of residence for accepted initial applications were California (27 percent), Texas (16 percent), New York (6 percent), and Illinois and Florida (5 percent each). The top countries of origin were Mexico (78 percent), El Salvador (4 percent), Guatemala (3 percent), Honduras (2 percent), and Peru and Brazil (1 percent each).
On June 5, 2014, USCIS began accepting DACA renewal applications, and as of September 2017 had accepted 1,094,684 such applications (with some DACA holders renewing for the second or third time). By the end of September 2017, 92 percent (1,002,810) of the renewal applications had been approved, with 8 percent (82,612) pending, and less than 1 percent (9,262) denied.
- For the most up-to-date DACA application and approval data from USCIS, click here.
- To read more about the education and work profiles of the DACA population in the MPI report, click here.
On September 5, 2017, the Trump administration announced the rescission of DACA with a six-month wind-down. How many unauthorized immigrants at the time were participants of the program?
As of September 4, 2017, accordingly to data from USCIS, 689,800 individuals were current DACA recipients. MPI estimates that 52 percent of the immediately eligible population as of 2017 were participating the program.
The top states of residence for DACA recipients were California (29 percent), Texas (16 percent), Illinois and New York (about 5 percent each), and Florida, Arizona, and North Carolina (about 4 percent each).
The top countries of origin were Mexico (79 percent), El Salvador (4 percent), Guatemala (3 percent), Honduras (2 percent), and Peru and South Korea (1 percent each).
Since the Trump administration’s announcement, several DREAM Act-type bills have been introduced in Congress to provide a pathway to some form of legal status for DACA recipients and the broader population of unauthorized immigrants brought to the United States as children (known as DREAMers). At this writing, the fate of DREAMers remained unresolved. MPI has provided estimates of those who might benefit for conditional or legal permanent residence under various legislative scenarios.
- Click here for detailed USCIS data on countries of birth, state and metro areas of residence, sex, age, and marital status of DACA recipients as of September 4, 2017.
- View MPI estimates of DACA program participation rates and the immediately eligible at the national and state level, as well as for top countries of origin.
- View MPI estimates of potential beneficiaries under different DREAM Act-type bills.
- Learn about the detailed MPI methodology used to estimate the DREAM eligible population.
How many unaccompanied children (UACs) and families were apprehended at the U.S.-Mexico border?
Since President Trump took office, apprehensions at the Southwest border have been lower than in previous years. Between October 2017 and January 2018, the most recent period for which data are available, the U.S. Border Patrol apprehended 14,444 unaccompanied children (UACs) and 25,628 family units (defined as a parent, typically a mother, traveling with children) along the Southwest border. For comparison, this represented approximately 35 percent of unaccompanied children (41,435) and 34 percent of family units (75,622) apprehended in all of FY 2017, the previous fiscal year. In FY 2018, these children and families were primarily from Guatemala, Honduras, El Salvador, or Mexico.
- View the most up-to-date DHS data on apprehensions of unaccompanied children and family units in FY 2018.
- View more DHS data on FY 2017 apprehensions.
- For more data and analysis on child migration to the United States, check out this MPI resource page.
Immigration Enforcement
How many apprehensions of unauthorized immigrants occur annually?
Note: The government fiscal year runs from October 1 to September 30. All figures for immigration control and enforcement given here are for the fiscal year.
The number of total apprehensions increased by 15 percent from 2015 to 2016, but was still lower than in the earlier years of the Obama administration. There were 530,250 apprehensions in 2016 and 462,388 in 2015 by U.S. Customs and Border Protection (CBP) and U.S. Immigration and Customs Enforcement (ICE), the two agencies within DHS responsible for the identification and removal of inadmissible noncitizens. By comparison, 796,587 apprehensions occurred in 2010 and 678,606 in 2011.
The Border Patrol reported 415,816 apprehensions in 2016 (78 percent of all apprehensions), a significant increase from 337,117 in 2015. Ninety-eight percent of Border Patrol apprehensions in 2016 occurred along the Southwest border.
Additionally, ICE made 114,434 administrative arrests in 2016 (22 percent of total apprehensions), marking the sixth continuous annual drop in interior apprehensions since 2010.
The leading countries of nationality of those apprehended in 2016 were Mexico, Guatemala, El Salvador, and Honduras. Nationals from these four countries comprised almost 93 percent of all apprehensions. Although Mexican nationals still constituted 50 percent of apprehensions in 2016, their number and share of total apprehension dropped to the lowest level in the past decade, amounting to roughly one-quarter of the 1.1 million Mexican apprehensions in 2005. In FY 2016, apprehensions of Salvadorans, Hondurans, and Guatemalans increased 54 percent, 44 percent, and 26 percent respectively compared to the previous year. The highest number of apprehensions for these three countries was recorded in FY 2014.
Note: Apprehensions are events, not individuals. In other words, the same individual can be apprehended more than once, with each apprehension counted separately.
- Read more about the near 50-year low in Mexican immigrant border apprehensions in this Pew Research Center study.
How many people are deported per year?
Both removals and returns result in the confirmed movement of inadmissible or deportable aliens out of the United States. There were an estimated 445,000 removals and returns in 2016, a decline of roughly 10,000 from 456,000 in 2015. The modest drop in repatriations in the context of increased apprehension during the same period reflects a lag between apprehension and repatriation for nationals of Northern Triangle countries, compared to Mexicans. The former group often have to go through the lengthy immigration court procedure associated with their asylum claims.
In 2016, removals represented 76 percent (340,056) and returns 24 percent (106,167) of the total. The former figure represents an increase from 2015 (326,962), reflecting the first year of increase since 2013, when deportation slowly dropped in part due to the shifted interior enforcement priority under later years of the Obama administration. At the same time, the number of returns has further declined, from roughly 1 million in 2006 to 106,167 in 2015 (the lowest since 1965), as the government has prioritized using the more formal removal process, which carries greater consequences if re-entry is attempted.
Notes: Removals (deportations) are the compulsory and confirmed movement of an inadmissible or deportable unauthorized immigrant out of the United States based on an order of removal. An unauthorized immigrant who is removed has administrative or criminal consequences placed on subsequent re-entry owing to the fact of the removal. Returns are the confirmed movement of an inadmissible or deportable unauthorized immigrant out of the United States not based on an order of removal. Most voluntary departures (returns) are of Mexican nationals who have been apprehended by the Border Patrol and are returned to Mexico.
- For more information, see the DHS report, Immigration Enforcement Actions: 2016.
- For an examination of the 3.7 million removals carried out between 2003 and 2013, read the MPI report, Deportation and Discretion: Reviewing the Record and Options for Change.
- For a look at how the Trump executive order on immigration enforcement in the U.S. interior compares to earlier policy, see the MPI brief, Trump Executive Order and DHS Guidance on Interior Enforcement: A Brief Review.
Naturalization Trends
Note: The government fiscal year runs from October 1 to September 30. All figures on naturalization given here are for the fiscal year.
How many immigrants are naturalized citizens?
In 2016, 21.2 million immigrants were naturalized U.S. citizens, accounting for 49 percent of the total foreign-born population (43.7 million) and almost 7 percent of the U.S. population (323.1 million), according to ACS estimates.
How many immigrants become U.S. citizens?
USCIS naturalized 753,060 LPRs in 2016. The total number of immigrants receiving U.S. citizenship increased by 3 percent between 2015 and 2016 after a rapid increase of 12 percent between 2014 and 2015.
From a historical perspective, naturalizations have increased dramatically in recent decades. On average, fewer than 120,000 LPRs became citizens each year between 1950 and 1969, 210,000 in the 1980s, 500,000 in the 1990s, and 680,000 during the 2000s. Between 2010 and 2016, the average annual number of naturalizations was about 713,000.
Naturalizations reached an all-time high in 2008, increasing 59 percent from 660,477 in 2007 to 1,046,539 in 2008. This came as a result of impending application fee increases and the promotion of U.S. citizenship in advance of the 2008 presidential elections. For more information on naturalization trends, see the Source article Naturalization Trends in the United States.
How many foreign nationals become U.S. citizens through military naturalization?
In 2016, 8,885 foreign-born military personnel naturalized as U.S. citizens—23 percent higher than in 2015 when 7,234 military personnel became Americans.
- For more historical data on naturalization, see the MPI tool Naturalization in the United States, 1910-Present.
Between 2002 and 2017, 114,080 foreign-born military personnel naturalized on U.S. soil. Another 11,372 became citizens overseas or aboard Navy ships.
- Read the USCIS fact sheet Naturalization through Military Service and Military Naturalization Statistics.
Where are newly naturalized citizens from?
Of those who naturalized in 2016, 14 percent were born in Mexico (103,550), roughly 6 percent in India (46,188), and 5 percent each in the Philippines (41,285) and China (35,794). Immigrants from these four countries, together with those from Cuba (32,101), the Dominican Republic (31,320), Vietnam (24,848), Colombia (18,601), El Salvador (17,213), and Jamaica (16,772), comprised the top ten countries of birth for newly naturalized citizens in 2016. These ten countries accounted for 49 percent of the 753,060 new U.S. citizens that year.
Where do newly naturalized citizens live in the United States?
In 2016, 53 percent of the newly naturalized lived in one of four states. California had the largest number of newly naturalized citizens, with 20 percent (151,830), followed by 12 percent each in New York (93,376) and Florida (88,764), and 8 percent in Texas (63,945).
Approximately 16 percent of those who naturalized in 2016 lived in the greater New York metropolitan area (122,156), followed by 8 percent each in the greater Los Angeles metropolitan area (61,950) and the greater Miami metro area (59,227). These areas, together with the greater Washington, DC (4 percent), and the greater Chicago, Houston, San Francisco, and Boston areas (about 3 percent each) were home to close to half (48 percent) of new U.S. citizens in 2016.
How many green-card holders are eligible to naturalize?
According to the latest available USCIS estimates, about 8.9 million of the 13.2 million green-card holders residing in the United States on January 1, 2014 were eligible to naturalize.
How long does it take on average for green-card holders to naturalize?
Immigrants who naturalized in 2016 spent a median of seven years in LPR status before becoming U.S. citizens, according to USCIS estimates. The time varied by country of origin: African- and Asian-born immigrants spent about six years in LPR status before naturalization, followed by those born in South America (seven years), Europe (nine years), North America (including Central America, 10 years), and Oceania (10 years).
To be naturalized, LPRs must meet several criteria, including being at least 18 years of age, passing English and civic exams, and for most, residing in the United States with LPR status continuously for at least five years (three years for those married to a U.S. citizen).
Visa Backlogs
How many visa applications for permanent immigration (green cards) are backlogged?
Two types of backlogs impact the issuance of green cards. The first is due to visa availability. The government caps employment-based permanent visas for foreign workers and their families at 140,000 per year worldwide (a cap that has remained unchanged since 1990). Family-sponsored preferences are limited to 226,000 visas per year. Also, no country can receive more than 7 percent of the total annual number of family-sponsored and employment-based visas (approximately 25,600 visas).
The second type of backlog is due to processing delays of applicants' documents, which is related to government processing capacity as well as increased background and criminal checks.
In February 2018, the U.S. government was still processing some family-sponsored visa applications dating to October 1994, and some employment-related visa applications from December 2006.
For example, an application filed 22 years ago by a U.S. citizen to sponsor an unmarried adult child from Mexico is potentially just now being processed in February 2018. Similarly, an application filed 24 years ago by a U.S. citizen sponsoring a sibling from the Philippines is possibly only now being processed. However, recent years have witnessed dramatic reductions in the backlogs for certain categories of immigrants, particularly the immediate family members (spouses and children) of permanent residents.
Another useful indicator to understand the waiting times is the number of people whose documents are on hold because there are no immigrant visas available for a given family/employment preference or a given country of origin. According to data on the petitions submitted to the State Department, there were about 4.1 million applicants (including spouses and minor children) who were on the waiting list as of November 1, 2017. The overwhelming majority were family-sponsored applicants (3.9 million, which includes the principal applicant and their immediate family members). About 112,000 were employment-sponsored applicants and their families.
Of the overall 4.1 million applicants, 1.3 million were citizens of Mexico, followed by those from the Philippines (356,000) and India (316,000). What these data do not show is the number of family- and employment-based prospective immigrants who are waiting to adjust their status to lawful permanent resident from within the United States. To MPI’s knowledge, the number of people awaiting green cards from within the United States has not been published by USCIS. In other words, the overall number of people waiting for a green card—within and outside of the United States—is larger than the 4.1 million reported by the State Department.
- For more details about wait times by immigration category and country of origin, see the State Department Visa Bulletin.
- For more on the green-card backlog, read the MPI brief, Going to the Back of the Line: A Primer on Lines, Visa Categories, and Wait Times.
- Read the National Visa Center annual report on immigrant visa applicants.
For much more data on immigrants and immigration in the United States and worldwide, including interactive maps, check out MPI's Migration Data Hub.
To receive the latest immigration analysis right in your inbox, sign up for the bimonthly Source newsletter.