

Frequently Requested Statistics on Immigrants and Immigration in the United States

The Statue of Liberty in New York Harbor. (Photo: Thomas Dwyer)
Editor’s note: This article was updated on July 10, 2019 to include newly released Department of Homeland Security data on refugee resettlement, asylum grants, and deportations.
Immigration seems to be ever present in current political and public debate in the United States, with the topic central in the 2016 presidential campaign and since then, amid ongoing policy conversations about border wall construction, refugee resettlement cuts, family separation, and much more. Yet even as positions taken by political parties and individuals seem hardened, immigration flows and the makeup of the U.S. immigrant population have been changing in significant, though not always fully appreciated, ways.
Among the changes: The overall immigrant population continues to grow, but at a slower rate than before the 2007-09 recession. Recent immigrants are more likely to be from Asia than from Mexico, and are also more likely to have a college degree. The size of the unauthorized population appears to be on the decline. Deportations from within the United States are rising. And the United States in 2018 resettled the smallest number of refugees since formal creation of the refugee resettlement program in 1980.
To help inform discussions around immigration, this Spotlight offers in one accessible resource the most authoritative, unbiased, and current data available about the 44.5 million immigrants resident in the United States as of 2017. By compiling some of the most frequently requested facts and figures, this article provides answers to questions such as: What are the trends shaping immigration to our country? How many people have immigrated to the United States, and via what channels? How many arrived as refugees, and from which countries? Has the number of unauthorized immigrants changed in recent years? What jobs do immigrants fill? And how many U.S. residents are either immigrants or the children of immigrants?
The article draws on the most recent resources and data from the Migration Policy Institute (MPI); the U.S. Census Bureau (using its 2017 American Community Survey [ACS], 2018 Current Population Survey [CPS], and 2000 decennial census); and the U.S. Departments of Homeland Security (DHS) and State. (Note: DHS and State Department data refer to fiscal years that begin on October 1 and end on September 30; ACS and CPS data refer to calendar years). For more detailed information on U.S. and global immigration data sources and one-click access to these datasets, see the MPI report Immigration Data Matters.
Click on the bullet points for more information on each topic:
- Immigrants Now and Historically
- Demographic, Educational, and Linguistic Characteristics
- Immigrant Destinations
- Immigrants in the Labor Force
- Health Insurance Coverage
- Children of Immigrants
- Permanent Immigration
- Temporary Visas
- Refugees and Asylum Seekers
- Unauthorized Immigrants
- Immigration Enforcement
- Naturalization Trends
- Visa Backlogs
Immigrants Now and Historically
How many immigrants reside in the United States?
More than 44.5 million immigrants resided in the United States in 2017, the historical high since census records have been kept. One in seven U.S. residents is foreign born, according to 2017 American Community Survey (ACS) data. While immigrants’ current share—13.7 percent—of the overall U.S. population (325.7 million people) has been increasing since the record low marked in 1970, it remains below the historical record of 14.8 percent hit in 1890.
Between 2016 and 2017, the foreign-born population increased by about 787,000, or almost 2 percent—a rate higher than the 1 percent growth experienced between 2015 and 2016, but lower than the 3 percent increase between 2013 and 2014.
How have the number and share of immigrants changed over time?
Data on the nativity of the U.S. population was first collected in the 1850 census. That year, there were 2.2 million immigrants, representing nearly 10 percent of the overall population.
Between 1860 and 1920, the immigrant share fluctuated between 13 percent and almost 15 percent of the overall population, peaking at 14.8 percent in 1890, largely due to high levels of immigration from Europe.
Restrictive immigration laws in 1921 and 1924—which kept the channels to permanent immigration open almost exclusively to northern and western European immigrants—coupled with the Great Depression and World War II, led to a sharp drop in new arrivals from the Eastern Hemisphere. The foreign-born share steadily declined, hitting a record low of 4.7 percent in 1970 (9.6 million; see Figure 1).
- How has immigration to the United States fluctuated over time? Check out the U.S. Immigrant Population and Share over Time, 1850-Present data tool.
Since then, the share and number of immigrants have increased rapidly, mainly because of large-scale immigration from Latin America and Asia, with the foreign-born population standing at 44.5 million as of 2017. Important shifts in U.S. immigration law (including the Immigration Act of 1965 that abolished national-origin admission quotas, the Refugee Act of 1980, and preferential treatment of Cuban immigrants); the United States’ growing economic and military presence in Asia and Latin America; economic ties, powerful immigrant networks, and deep migration history between the United States and its southern neighbors; and major economic transformations and political instability in countries around the world all have helped usher in the vast diversification of immigration flows.
Figure 1. Size and Share of the Foreign-Born Population in the United States, 1850-2017
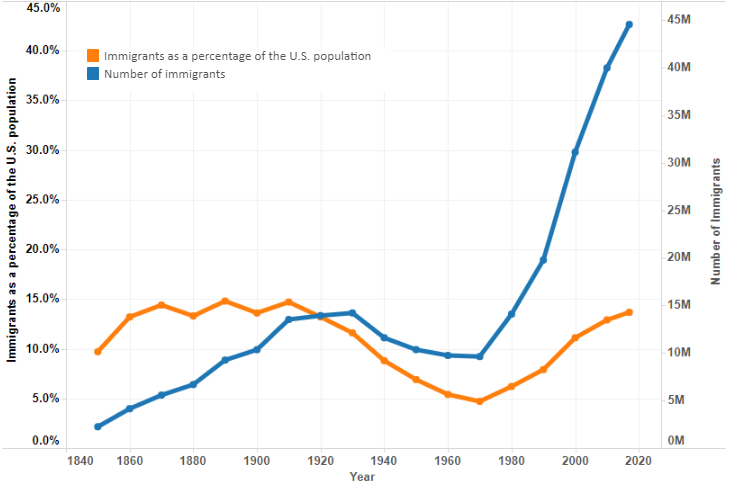
Source: Migration Policy Institute (MPI) tabulation of data from U.S. Census Bureau, 2010-17 American Community Surveys (ACS), and 1970, 1990, and 2000 Decennial Census. All other data are from Campbell J. Gibson and Emily Lennon, "Historical Census Statistics on the Foreign-Born Population of the United States: 1850 to 1990" (Working Paper no. 29., U.S. Census Bureau, Washington, DC, 1999).
- Read about historical U.S. immigration trends and policies in Immigration in the United States: New Economic, Social, Political Landscapes with Legislative Reform on the Horizon.
- Learn about the impact of the 1965 law in Fifty Years On, the 1965 Immigration and Nationality Act Continues to Reshape the United States.
- Read more about the end of national-origin quotas in The Geopolitical Origins of the U.S. Immigration Act of 1965.
How do today’s top countries of origin compare to those 50 years ago?
In 2017, Mexicans accounted for approximately 25 percent of immigrants in the United States, making them by far the largest foreign-born group. Indians and Chinese (including immigrants from Hong Kong but not Taiwan) were the next two largest groups, each comprising close to 6 percent, followed by Filipinos at 5 percent. Rounding out the top ten were El Salvador, Vietnam, Cuba, and the Dominican Republic (about 3 percent each); and South Korea and Guatemala (approximately 2 percent). Together, these countries were the origin for 57 percent of the U.S. immigrant population in 2017.
The predominance of Latin American and Asian immigration in the late 20th and early 21st centuries starkly contrasts with the trend in the mid-1900s, when immigrants were largely European. In the 1960s no single country accounted for more than 15 percent of the total immigrant population. Italians were the top origin group, making up 13 percent of the foreign born in 1960, followed by Germans and Canadians (about 10 percent each).
- To see immigration trends from individual countries over time, use the Countries of Birth for U.S. Immigrants, 1960-Present data tool.
How many immigrants have entered the United States since 2010, and what are the leading sending countries?
Twenty-one percent of the 44.5 million immigrants in the United States in 2017 entered in 2010 or later, 26 percent arrived between 2000 and 2009, 22 percent between 1990 and 1999, and 31 percent before 1990.
While immigrants from Mexico dominated the flows post-1970, the makeup of newcomers has changed since the 2007-09 recession. Recently arrived immigrants are more likely to come from Asia, with India and China leading the way. Countries such as the Dominican Republic, the Philippines, Cuba, El Salvador, and Venezuela have also seen sizeable emigration to the United States. By contrast, there were fewer Mexican immigrants in the United States in 2017 than in 2010, representing the biggest decline of all immigrant groups.
- Read more on immigrants from New Origin Countries in the United States.
- Check out Largest U.S. Immigrant Groups over Time, 1960-Present, an interactive tool showing the top ten source countries by decade.
- To learn more about key immigrant populations, check out the Migration Information Source’s Spotlights archive, which includes data-rich articles on individual immigrant groups in the United States, including Mexicans, Indians, Chinese, Vietnamese, Koreans, South Americans, Europeans, sub-Saharan Africans, and those from the Middle East-North Africa region.
How many U.S. residents are of recent immigrant origin?
Immigrants and their U.S.-born children now number approximately 89.4 million people, or 28 percent of the overall U.S. population, according to the 2018 Current Population Survey (CPS). Pew Research Center projects that the immigrant-origin share will rise to about 36 percent by 2065.
Demographic, Educational, and Linguistic Characteristics
What is the median age for immigrants?
Overall, the immigrant population in 2017 was older than the U.S.-born population, with a median age of 44.8 years as compared to 36.2 years for the native born. The latter are younger largely because most children of immigrants are born in the United States and a significant share are under age 18.
In 2017, fewer than 1 percent of immigrants were under age 5 (compared to 7 percent for the native born), approximately 5 percent were ages 5 to 17 (versus 18 percent), 79 percent were ages 18 to 64 (compared to 59 percent), and 16 percent were ages 65 and older (the same as the U.S. born).
What is the female share of the immigrant population?
In 2017, approximately 52 percent of immigrants were female. The share has fluctuated slightly over the past four decades; women accounted for 53 percent of immigrants in 1980, 51 percent in 1990, 50 percent in 2000, and 51 percent in 2010.
What is the racial makeup of immigrants?
Forty-six percent of immigrants in 2017 reported their race as single-race White, 27 percent as Asian, 9 percent as Black, and 16 percent as some other race. About 2 percent reported having two or more races.
How many immigrants are Hispanic or Latino?
In 2017, 44 percent of U.S. immigrants (19.7 million people) reported having Hispanic or Latino origins.
Note: The Census Bureau classifies Hispanic and Latino as ethnic categories, separate from the racial categories listed above (see Definitions box for more information).
How many Hispanics in the United States are immigrants?
The majority of U.S. Hispanics are native born. Of the 58.8 million people in 2017 who self-identified as Hispanic or Latino, 34 percent (19.7 million) were immigrants and 66 percent (39.1 million) were native-born.
- Use the MPI Data Hub State Immigration Data Profiles tool to learn more about the demographic characteristics of immigrants and the U.S. born (including race and ethnicity) in each of the 50 states and the District of Columbia, as well as nationally.
Which languages are most frequently spoken at home?
In 2017, approximately 78 percent (239.3 million) of the 306 million people ages 5 and older in the United States reported speaking only English at home.
The remaining 22 percent (66.5 million) reported speaking a language other than English at home. Of the top languages, Spanish was by far the most common (62 percent), followed by Chinese (5 percent, including Mandarin and Cantonese), Tagalog (almost 3 percent), and Vietnamese, Arabic, French (including Cajun), and Korean (about 2 percent each). The remaining languages in the top 15 each accounted for approximately 1 percent: Russian, German, Haitian Creole, Hindi, Portuguese, Italian, Polish, and Urdu.
What percentage of immigrants are Limited English Proficient?
In 2017, approximately 48 percent (21.2 million) of 44.2 million immigrants ages 5 and older were Limited English Proficient (LEP).
Immigrants account for 82 percent of all LEP individuals over age 5, while native-born individuals account for 18 percent.
Note: The term "Limited English Proficient" refers to persons ages 5 and older who reported speaking English "not at all," "not well," or "well" on their survey questionnaire. Individuals who reported speaking “only English” or speaking English "very well" are considered proficient in English.
- Read more about the LEP population in Language Diversity and English Proficiency in the United States.
What share of the immigrant population has a college education?
In 2017, 31 percent (12 million) of the 39 million immigrants ages 25 and older had a bachelor's degree or higher, compared to 32 percent of U.S.-born adults (see Figure 2). Notably, the share of college-educated immigrants was much higher—47 percent—among those who entered the country in the previous five years (between 2012 and 2017).
Figure 2. Educational Attainment of U.S.-Born, Immigrant, and Recently Arrived Immigrant Residents, 2017
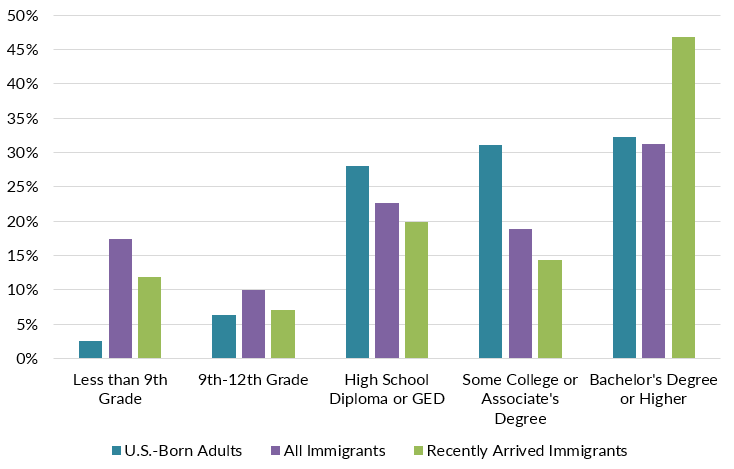
Source: MPI tabulation of data from the U.S. Census Bureau 2017 ACS.
Educational attainment varies by country of origin. In 2017, the top five countries of origin for immigrants with a bachelor’s degree or more were India (79 percent), Taiwan (72 percent), Egypt (68 percent), Latvia (67 percent), and Kuwait (65 percent).
- Educational Attainment Among U.S.-Born Adults and All Immigrant Adults by Country of Birth in 2017.
- Read more about the socioeconomic characteristics of highly skilled immigrants in College-Educated Immigrants in the United States.
Immigrant Destinations
Which states have the largest number of immigrants and which ones have experienced the fastest growth of their immigrant populations?
In 2017, the top five U.S. states by number of immigrants were California (10.7 million), Texas (4.9 million), New York (4.5 million), Florida (4.4 million), and New Jersey (2.1 million).
When classified by the share of immigrants out of the total state population, the top five states in 2017 were California (27 percent), New York (23 percent), New Jersey (23 percent), Florida (21 percent), and Nevada (20 percent).
- Interested in the top U.S. destinations for immigrants by country or region of origin? Use our interactive maps to see top immigrant concentrations at state and county or metropolitan-area levels.
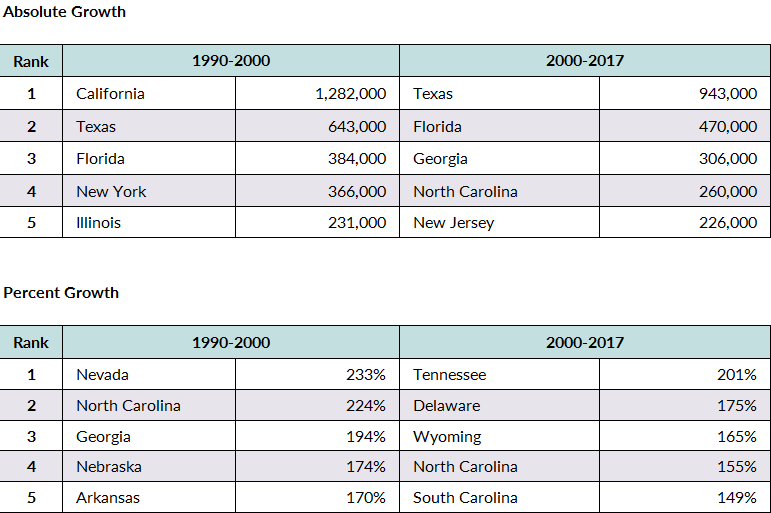
While traditional immigrant destinations lead in terms of absolute number of new immigrants, other states have seen much larger relative growth in their immigrant populations (see Table 1).
Table 1. Top Five States by Absolute and Percent Growth in Immigrant Population, 1990-2000 and 2000-17
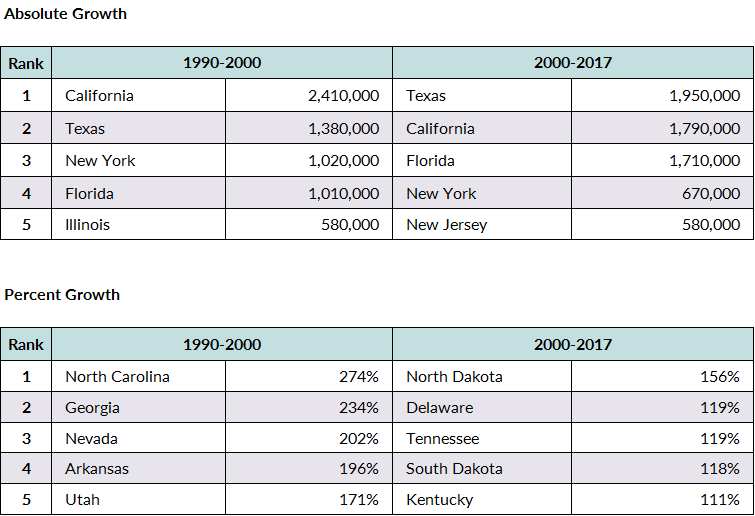
Note: In some states, the initial foreign-born population was quite small. Thus, relatively small absolute increases in the immigrant population in these states have translated into high percent growth
Source: MPI tabulation of data from the U.S. Census Bureau 2017 ACS and 1990 and 2000 Decennial Census.
- For more information on the top states of residence for the foreign born, see the interactive tool, Immigrant Population by State, 1990-Present.
Immigrants in the Labor Force
How many immigrants are in the U.S. civilian labor force?
Immigrants accounted for 17 percent (28 million) of the 163.7 million persons in the civilian labor force in 2017. Between 1970 and 2017, the percentage of the foreign born in the labor force more than tripled, from 5 percent to 17 percent. Over the same period, the foreign-born share of the total population grew more slowly: from less than 5 percent to just under 14 percent.
- For more on the share of immigrants in the labor force nationwide and by state since 1980, see Immigrant Share of the U.S. Population and Civilian Labor Force, 1980-Present.
What types of jobs do immigrants hold?
Of the 26.8 million employed foreign-born workers ages 16 and older in 2017, the largest share, more than 32 percent, worked in management, professional, and related occupations. See Figure 3 for other occupations.
Figure 3. Employed Workers in the Civilian Labor Force (ages 16 and older), by Nativity and Occupation, 2017
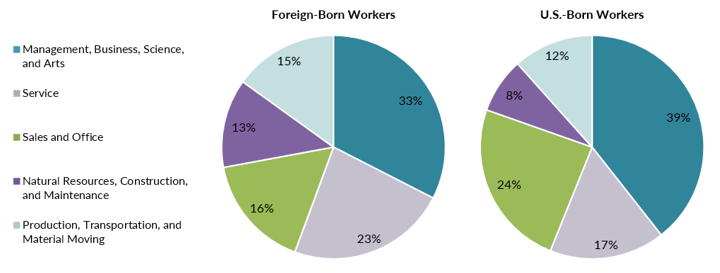
Note: Numbers may not add up to 100 as they are rounded to the nearest whole number.
Source: MPI tabulation of data from the U.S. Census Bureau 2017 ACS.
- Check out our State Immigration Data Profiles for more information on the labor force participation of immigrants and the U.S. born in the United States, each of the 50 states, and the District of Columbia.
Health Insurance Coverage
What share of immigrants have health insurance?
In 2017, approximately 57 percent of U.S. immigrants had private health insurance (compared to 69 percent of the U.S. born), and 30 percent had public health insurance coverage (compared to 36 percent of the native born).
Since implementation of the Affordable Care Act in 2014, health insurance coverage has improved for both the U.S. born and immigrants. From 2013 to 2017, the immigrant uninsured rate fell from 32 percent to 20 percent, and the rate for the native born fell from 12 percent to 7 percent.
Note: Health insurance coverage is calculated only for the civilian, noninstitutionalized population. Since some people may simultaneously hold both private and public health insurance coverage, estimates of those with public health insurance and those with public coverage may overlap. Their sum therefore may be greater than the total number of people with health insurance.
Children of Immigrants
How many U.S. children live with immigrant parents?
In 2017, approximately 18.2 million children under age 18 lived with at least one immigrant parent. They accounted for 26 percent of the 70 million children under age 18 in the United States, up from 13 percent in 1990 and 19 percent in 2000.
Second-generation children—born in the United States to at least one foreign-born parent—accounted for 88 percent (16 million) of all children under age 18 with immigrant parents. The remaining 12 percent (2.2 million) were born outside the United States.
- For state-by-state and age information on children living with immigrant parents, see the Children in U.S. Immigrant Families data tool.
How has the number of children in immigrant families changed over time?
Between 1990 and 2000, the number of children ages 17 and under with immigrant parents grew 60 percent, from 8.2 million to 13.1 million. Between 2000 and 2017, the number grew by another 39 percent, from 13.1 million to 18.2 million.
The population of first-generation immigrant children grew by 43 percent between 1990 and 2000 (from 1.9 million to 2.7 million), but then declined 19 percent between 2000 and 2017 (from 2.7 million to 2.2 million).
In contrast, the number of second-generation immigrant children has grown steadily since 1990. Between 1990 and 2000, the number increased by 65 percent (from 6.3 million to 10.4 million). Between 2000 and 2017, this population grew 54 percent (from 10.4 million to almost 16 million).
How many children living with immigrant parents are in low-income families?
In 2017, there were 27.4 million children under age 18 living in low-income families (i.e., with family incomes below 200 percent of the federal poverty threshold). Of them, 8.8 million (or 32 percent) were children of immigrants.
- For state-level estimates of children of immigrants and share in low-income families, see the Demographic and Social Profiles in the State Immigration Data Profiles tool.
Which states have the largest number of children in immigrant families and which ones have experienced the fastest growth of this population?
In 2017, the top five states by the total number of children under age 18 living with immigrant parents were California (4.1 million), Texas (2.5 million), New York (1.5 million), Florida (1.4 million), and New Jersey (767,000). These states accounted for 56 percent of the 18.2 million children with immigrant parents residing in the United States.
In terms of the share of children with immigrant parents, the top five states in 2017 were California (48 percent of all children in the state), New Jersey (40 percent), Nevada (38 percent), New York (37 percent), and Texas (35 percent).
While traditional immigrant destinations experience the largest absolute growth in children with immigrant parents, other states have seen much larger relative growth (see Table 2).
Table 2. Top Five States by Absolute and Percent Growth in Children with Immigrant Parents, 1990-2000 and 2000-17
Note: In some states, the initial number of children with immigrant parents was quite small. Thus, relatively small absolute increases in the immigrant population in these states have translated into high percent growth.
Source: MPI tabulation of data from the U.S. Census Bureau 2017 ACS and 1990 and 2000 Decennial Census.
Permanent Immigration
How many immigrants obtained lawful permanent residence (aka getting a green card) in 2017?
In fiscal year (FY) 2017, 1.1 million immigrants became lawful permanent residents (LPRs), also known as green-card holders. The number of new LPRs in 2017 decreased by 5 percent from 2016 (1.2 million). In the past decade, the number of new LPRs annually has ranged from 991,000 (2013) to 1.2 million (2016).
In recent years, green-card holders have been roughly evenly divided between those already living in the United States who are adjusting their status and those applying from outside the country. Almost half (49 percent, or 549,000) of the 1.1 million new LPRs in 2017 received green cards from within the United States. Many of these new permanent residents are spouses, minor children, and parents of U.S. citizens; or persons who arrived as refugees or as temporary workers.
A slightly higher number of new LPRs (578,000, or 51 percent) were persons granted this status from abroad. The share of new arrivals rose steadily in the past decade from 41-42 percent in 2008-09, to 46-47 percent in 2013-14, and surpassing 50 percent in 2016. The majority of new arrivals are immediate family members of U.S. citizens and LPRs.
- Trace changing immigration trends over time with the Legal Immigration to the United States, 1820-Present data tool.
Under which categories are permanent immigrants admitted?
There are four main pathways to obtain a green card: through a family relationship, employment sponsorship, humanitarian protection (refugees and asylees), and the Diversity Visa (DV) lottery.
Overall, of the 1.1 million immigrants who received green cards in 2017, 46 percent were immediate relatives of U.S. citizens (immediate relatives have unlimited annual visas), followed by another 21 percent of family-related immigrants (whose admission is limited by visa and country caps).
Thirteen percent adjusted from refugee or asylee status. About 12 percent of LPRs were either sponsored by their employers or were able to self-sponsor, including investors. Roughly 5 percent were diversity lottery winners.
What are the top five countries of birth for new permanent immigrants in 2017?
The top five countries of birth were Mexico (15 percent), mainland China and Cuba (6 percent each), and India and the Dominican Republic (5 percent each). These countries represented about 38 percent of all persons who received green cards in 2017.
How many people are selected in the Diversity Visa lottery and where do they come from?
In 2017, 51,600 people received green cards as diversity immigrants (from countries with low rates of immigration), representing approximately 5 percent of the 1.1 million new LPRs.
The leading countries of birth of DV immigrants were Nepal, the Democratic Republic of the Congo, and Egypt, which each accounted for about 6 percent of DV immigrants; followed by Ethiopia, Iran, Uzbekistan, and Albania, with 5 percent each.
For some countries, the diversity visa lottery represents a major share of all new LPRs. For example, among Algerians who received a green card in 2017, 62 percent did so via the green-card lottery. Shares were also high for Uzbekistan (58 percent) and Tajikistan (56 percent) and represented between 40 and 50 percent of LPRs born in Albania, Azerbaijan, Armenia, Togo, Sudan, Benin, and Moldova.
Created in 1990, the lottery sets aside 55,000 diversity visas annually, of which 5,000 must be used for applicants under the Nicaraguan and Central America Relief Act of 1997. Interest in the lottery is significantly higher than there are available visas: About 14.7 million qualified applications were registered for the DV-2018, in total covering 23.1 million applicants, their spouses, and their minor children. The number registering in the DV-2018 was 61 percent higher than the 9.2 million registered for the DV-2009. (The application number varies each year depending on which countries are eligible.) Before receiving permission to immigrate, lottery winners must provide proof of a high school education or its equivalent or show two years of work experience within the past five years in an occupation that requires at least two years of training or experience. They also must pass a medical exam and a background check.
- Read the State Department Visa Bulletin for March 2019 for more on the DV-2019 lottery results.
- For more information on the Diversity Visa program, read The Diversity Visa Program Holds Lessons for Future Legal Immigration Reform.
Temporary Visas
How many people have temporary visas?
According to the most recently available Department of Homeland Security (DHS) estimates at the time of this writing, 2.3 million immigrants on various temporary visas resided in the United States during 2016, up from about 2 million in 2015. Almost half (1,100,000) were temporary workers and their families, followed by 870,000 foreign students and their families (40 percent).
Sixty-one percent were from Asia. Nationals of countries in Europe and North America accounted for 15 percent each. The top five countries of origin—India, China, Mexico, Canada, and South Korea—accounted for 57 percent of all residents on temporary visas.
Note: This estimate of temporary visa holders includes temporary workers, international students, exchange visitors, diplomats, and representatives of foreign governments and international organizations. It excludes tourists and other short-term visitors. North America includes Canada, Bermuda, Mexico, Central America, and the Caribbean.
- Read about the size of the nonimmigrant population in the DHS publication, Estimates of the Size and Characteristics of the Resident Nonimmigrant Population in the United States.
How many people entered the United States on nonimmigrant visas?
In 2016, 42.7 million individuals entered the United States as I-94 nonimmigrants on various temporary visas. On average, each I-94 nonimmigrant was admitted 1.8 times. This is the first time the DHS Office of Immigration Statistics (OIS) estimated the number of unique individuals who came temporarily, as opposed to the number of nonimmigrant admissions or entries.
Most of these nonimmigrants, 34.2 million, entered as tourists, followed by 3.7 million business visitors. Of these, 15 million tourists and 1.7 million business travelers were from Visa Waiver countries. Further, 1 million international students entered on F-1 visas. OIS estimated that additionally about 290,300 individuals were admitted on high-skilled worker H-1B visas (mostly from India, China, Canada, the United Kingdom, and Mexico) and 81,600 on nonagricultural temporary or seasonal worker H-2B visas (mostly from Mexico, Jamaica, Guatemala, South Africa, and Canada).
- Read more on Nonimmigrant Admissions and Estimated Nonimmigrant Individuals in the DHS 2016 fact sheet.
How many nonimmigrant visas does the State Department issue?
In FY 2018, the annual number of nonimmigrant visas issued by the State Department decreased for the third time to 9 million—a 7 percent decline from the 9.7 million issued in FY 2017.
The Trump administration implemented a number of policies in 2017 and 2018 that could lead to a decline in admissions, including the travel ban barring individuals from certain countries from U.S. entry, lengthened visa application processes, and greater discretion for consular officers to deny visas. From FY 2015 to FY 2018, visa refusal rates for tourists and business travelers from travel-ban countries increased significantly: all applications from North Korea were denied, followed by Somalia (90 percent), Iran (88 percent), Yemen (83 percent), Syria (77 percent), and Libya and Venezuela (74 percent each). Furthermore, during the same period, visa refusal rates rose for visitors from some major non-travel ban countries, including Mexico (from 20 percent to 25 percent), mainland China (from 10 percent to 17 percent), and India (from 24 percent to 26 percent).
Three-quarters of the 9 million nonimmigrant visas issued in FY 2018 were temporary business and tourist visas (B and BCC visas).
The next largest visa class was for academic students and exchange visitors and their family members (F and J visa categories), who comprised around 8 percent of all nonimmigrant visas issued in FY 2018. The third largest group of nonimmigrant visas was given to temporary workers and trainees and their family members (H visa categories), who comprised 7 percent of nonimmigrant visas.
Looking at the distribution of temporary visas issued in 2018 by region of origin, the largest shares were issued to nationals from Asia (43 percent), North America (22 percent, including Mexico, Central America, and the Caribbean), and South America (18 percent). The remainder: Europe (12 percent), Africa (6 percent), and Oceania (0.7 percent).
Note: The number of visas issued does not necessarily match the number of foreign nationals who entered the United States in the same year because some nonimmigrant visas may not be used.
- Read the State Department’s Report of the Visa Office 2018.
How many nonimmigrant admissions does DHS grant in a year?
In total, DHS granted 181 million nonimmigrant admissions in 2017, of which 103 million were admissions of Canadians traveling for business or pleasure and Mexicans who possess a nonresident Border Crossing Card (i.e., laser visa). These travelers are exempt from completing the I-94 arrival/departure form at the port of entry, thus DHS does not provide characteristics for this group.
In 2017, there were 77.6 million total temporary admissions of I-94 nonimmigrants, a slight uptick from 77.1 million in 2016. (See Table 3.)
Table 3. Nonimmigrant Admissions by Category, FY 2017
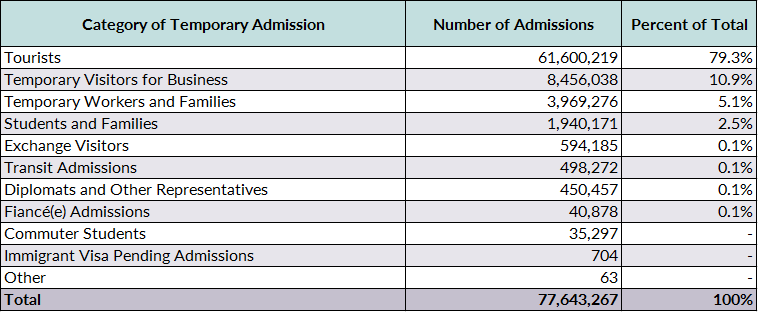
Source: DHS Office of Immigration Statistics, Yearbook of Immigration Statistics 2017.
Note: Nonimmigrant admissions represent the number of entries. Individuals may have multiple entries within the year. OIS reports characteristics of nonimmigrants who must complete an I-94 arrival/departure form at entry.
- Read more here: Nonimmigrant Admissions Fact Sheet: 2017
Refugees and Asylum Seekers
How many refugees entered the United States, and where were they from?
Every year, the president in consultation with Congress sets the annual refugee admissions ceiling and allocations by region of origin. For FY 2019, the annual ceiling was set at 30,000, the lowest since the program began in 1980.
In FY 2018, 22,491 refugees were resettled in the United States, amounting to less than half of the admission ceiling of 45,000 allocated for that year—largely due to processing delays and policies put in place to increase vetting of refugees. This represents a 58 percent drop compared to the 53,716 admitted in 2017.
2018 marked the first time the United States lost its top position as the leader in global refugee resettlement in favor of Canada, which resettled about 28,000 refugees.
The Democratic Republic of the Congo (DRC), Myanmar (also known as Burma), Ukraine, Bhutan, and Eritrea were the primary countries of nationality for refugees resettled in the United States, accounting for 78 percent (17,565) of all refugees resettled in 2018. Rounding out the top ten were Afghanistan, El Salvador, Pakistan, Russia, and Ethiopia. Together, nationals of the top ten countries comprised 90 percent (20,349) of all refugee arrivals in 2018.
Table 4. Top Ten Countries of Refugee Admissions by Nationality, FY 2018
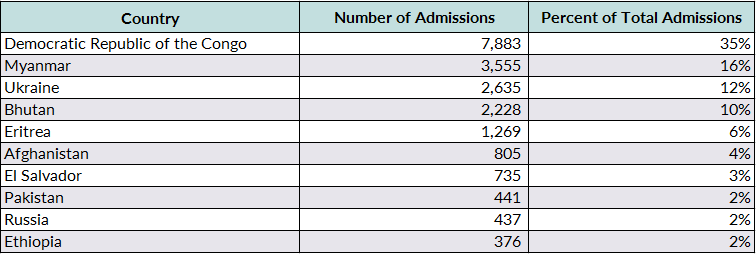
Source: MPI tabulation of Worldwide Refugee Admissions Processing System (WRAPS) data from the State Department’s Bureau of Population, Refugees, and Migration.
- Ten Facts About U.S. Refugee Resettlement.
- For more data on refugees, including top resettlement states, read Refugees and Asylees in the United States.
- Learn more on refugee admissions by year, national origin, and destination with State Department WRAPS data.
How many asylum applications were filed and where are asylum seekers from?
In FY 2018, an estimated 106,147 affirmative asylum applications were received by U.S. Citizenship and Immigration Services (USCIS)—25 percent fewer than the 141,695 in FY 2017. This is the first decline in application volume after eight years of growth. Applicants for affirmative asylum must be present in the United States, and do not include those seeking asylum through the defensive asylum process while in removal proceedings.
Venezuela was the top country of origin for received affirmative asylum applications, with 28,485 in FY 2018; followed by Guatemala (10,177), El Salvador (9,157), China (8,114), and Mexico (6,636).
Meanwhile, 111,887 defensive asylum applications were filed with the Department of Justice’s immigration court system, known as the Executive Office for Immigration Review (EOIR), in FY 2018—an 8 percent decrease from 121,418 applications filed a year earlier.
What is the asylum approval rate?
According to USCIS, in FY 2018, 30 percent of affirmative asylum adjudicated petitions were approved, a decline from the 43 percent in FY 2016 and 37 percent in FY 2017.
The same downward trend also applies to asylum petitions adjudicated by immigration courts. In FY 2018, 33 percent of such petitions were approved, versus 43 percent in FY 2016 and 37 percent in FY 2017.
How many people receive asylum status?
According to the most recent data at the time of this writing, in FY 2017, 26,568 individuals, including principal applicants and their spouses and/or unmarried children under age 21, were granted asylum after seeking protection upon or after arrival in the United States—up from 20,340 a year earlier. An additional 7,566 individuals, both residing inside and outside the United States, were approved for derivative status as immediate family members of principal asylum applicants. (Note: this number reflects travel documents issued to the 3,831 family members residing abroad, not their actual arrival to the United States.)
China was the top country of origin for those receiving asylum, with 5,548 persons (or 21 percent of total asylum grants). The next four largest countries of origin were El Salvador (3,469), Guatemala (2,963), Honduras (2,048), and Egypt (1,162). Together, nationals of these five countries made up 57 percent of those receiving asylum in FY 2017.
What is the current backlog for asylum applicants?
Due to the large application volume and limited resources, both the affirmative and defensive asylum systems have extensive backlogs. At the end of January 2019, according to USCIS, there were 352,277 affirmative cases pending; EOIR reported 821,726 total immigration cases pending, of which MPI estimated roughly 30 percent were defensive asylum ones.
- For more information, see the affirmative asylum quarterly report from USCIS and workload and adjudication statistics data on asylum cases from EOIR, and Refugees and Asylees: 2017 from DHS.
- For more on the immigration court backlog and asylum share, see the MPI report, The U.S. Asylum System in Crisis: Charting a Way Forward
Unauthorized Immigrants
How many unauthorized immigrants are in the United States?
The Migration Policy Institute (MPI) estimated 11.3 million unauthorized immigrants resided in the United States in 2016. About half of all unauthorized immigrants resided in three states: California (27 percent), Texas (14 percent), and New York (8 percent). The vast majority (82 percent) lived in 174 counties with 10,000 or more unauthorized immigrants each, of which the top five—Los Angeles County, CA; Harris County, TX; Cook County, IL; Orange County, CA; and Queens County, NY—accounted for 20 percent of all unauthorized immigrants.
- Read A Profile of the Unauthorized Immigrant Population in the United States for an overview of the characteristics of this population.
- Visit the Data Hub’s Unauthorized Immigrant Population Profiles for detailed sociodemographic information for the United States, 41 states and the District of Columbia, and 135 counties.
Note: MPI is among a small number of organizations that generate estimates of the unauthorized population because the Census Bureau does not. It is important to acknowledge that the estimates issued by MPI and others (including the DHS Office of Immigration Statistics, Pew Research Center, and Center for Migration Studies of New York) are based on different methodologies and data sources. Hence the estimates are not fully comparable.
Where are unauthorized immigrants from?
Mexicans and Central Americans are estimated to account for roughly two-thirds (67 percent or 7.6 million) of the unauthorized immigrants in the United States as of 2012-16, MPI estimates. About 1.8 million (16 percent) were from Asia; 685,000 (6 percent) from South America; 579,000 (5 percent) from Europe, Canada, or Oceania; 351,000 (3 percent) from the Caribbean; and 318,000 (3 percent) from Africa.
The top five countries of birth for unauthorized immigrants were Mexico (53 percent), El Salvador (6 percent), Guatemala (5 percent), and China and Honduras (3 percent each).
- This interactive map, Unauthorized Immigrant Populations by Country and Region, Top States and Counties of Residence, 2012-16, displays top U.S. concentrations by country or region of origin.
How many unauthorized immigrants live with children under age 18?
As of 2012-16, about 4 million unauthorized immigrants (37 percent of the overall unauthorized population ages 15 and older) lived with one or more children under age 18, MPI estimates. Of this group, about 82 percent (3.3 million) resided with at least one U.S.-citizen child under age 18, and 17 percent (697,000) lived with only non-U.S.-citizen children.
How many children under age 18 live with at least one unauthorized immigrant parent?
Approximately 5.1 million children under age 18 lived with an unauthorized immigrant parent during the 2012-16 period, representing 7 percent of the U.S. child population. About 80 percent (4.1 million) of these children were U.S. citizens, another 16 percent (809,000) were themselves unauthorized, and 3 percent (167,000) were legally present, including LPRs and those with temporary visas.
How many people were eligible for the Deferred Action for Childhood Arrivals (DACA) program and how many applications have been received since its launch in 2012?
The DACA program, announced on June 15, 2012, offered a two-year grant of deportation relief and work authorization to eligible young unauthorized immigrants. Requirements for eligibility included:
- being at least 15 years old;
- having entered the United States before the age of 16;
- having continuously resided in the United States since June 15, 2007;
- being enrolled in school, having earned a high school diploma or its equivalent, or being an honorably discharged veteran; and
- having not been convicted of a felony, significant misdemeanor, or three or more misdemeanors; or otherwise posing a threat to public safety or national security.
MPI estimates that as of 2018 approximately 1.3 million people met all criteria to apply under the original DACA program, 408,000 met all criteria except for education, and 120,000 would be eligible upon turning 15 provided they remain in school.
However, on September 5, 2017, the Trump administration announced the rescission of DACA, with a six-month wind-down. This decision has been challenged in multiple federal courts and a nationwide injunction has kept the DACA program in place, but only for people who currently have or in the past have had DACA benefits.
Between August 15, 2012, when USCIS began accepting applications, and September 30, 2018 (the most recent data available at the time of this writing), 908,755 initial applications were accepted for consideration. Thus, as of September 30, 2018, about 70 percent of the immediately eligible population had applied. USCIS approved 823,283 (or 91 percent) of these initial applications; 79,763 (9 percent) were denied, and the remainder were pending.
The top states of residence for accepted initial applications since the program’s inception are California (27 percent), Texas (16 percent), New York (6 percent), and Illinois and Florida (5 percent each). The top countries of origin are Mexico (78 percent), El Salvador (4 percent), Guatemala (3 percent), Honduras (2 percent), and Peru and Brazil (1 percent each).
On June 5, 2014, USCIS began accepting DACA renewal applications, and as of September 30, 2018 had accepted 1,352,730 such applications (with some DACA holders renewing for the second or third time). By the end of September 2018, 96 percent (1,297,626) of the renewal applications had been approved, with 3 percent (40,392) pending, and 1 percent (13,717) denied.
- USCIS data on DACA applications and approvals.
How many unauthorized immigrants were active participants of the program?
As of August 30, 2018, according to most recent data from USCIS, 699,350 individuals were current DACA recipients. MPI estimates that 54 percent of the immediately eligible population as of 2018 were participating the program.
The top states of residence for DACA active participants were California (29 percent), Texas (16 percent), Illinois and New York (about 5 percent each), followed by Florida, Arizona, and North Carolina (about 4 percent each).
The top countries of origin of active DACA program participants were Mexico (80 percent), El Salvador (4 percent), Guatemala (3 percent), Honduras (2 percent), and Peru and South Korea (1 percent each).
- For more information on countries of birth, state and metro areas of residence, sex, age, and marital status of DACA recipients as of September 4, 2017, see detailed USCIS data.
- View MPI estimates of DACA program participation rates and the immediately eligible at national and state levels, as well as for top countries of origin.
How many people are covered by Temporary Protected Status?
Since the enactment of the Immigration Act of 1990, the United States has occasionally granted a form of humanitarian relief called Temporary Protected Status (TPS) when the home countries of foreign nationals in the United States experience natural disasters, armed conflicts, or other circumstances making return unsafe. TPS offers work authorization and protection from deportation for six- to 18-month periods. The first country to be designated for TPS was El Salvador in 1990 to protect Salvadorans who had fled the country’s civil war. Since 1990, 22 countries have been designated for TPS. Ten countries currently are designated: El Salvador, Haiti, Honduras, Nepal, Nicaragua, Somalia, Sudan, South Sudan, Syria, and Yemen. TPS protects nearly 318,000 people from ten countries, with the largest groups being Salvadorans (195,000), Hondurans (57,000), and Haitians (46,000).
The Trump administration has announced that it will not extend TPS for immigrants from Sudan, Nicaragua, El Salvador, Haiti, Nepal, and Honduras when those designations expire. As a result, 98 percent of grantees could lose permission to work and protection from deportation—with the Haitian designation originally set to end on July 22, 2019; the Salvadoran one on September 9, 2019; and for Honduras on January 5, 2020.
However, there have been several legal challenges, including one (Ramos v. Nielsen) that resulted in a preliminary injunction barring termination of the Sudan, Nicaragua, Haiti, and El Salvador designations. The nationals of these four countries will receive automatic extension of TPS and work permits as long as the injunction remains in place.
- Read more about the TPS program in this Source feature article.
How many unaccompanied children and families have been apprehended at the U.S.-Mexico border?
Apprehensions at the Southwest border grew significantly in the first five months of FY 2019, due to the increase in families seeking asylum. Between October 2018 and February 2019, the most recent period for which data are available, the U.S. Border Patrol apprehended more than 136,000 minor children and adults travelling as family units and about 27,000 unaccompanied children along the Southwest border. This represents a significant uptick over the 107,200 family units and 50,000 unaccompanied children apprehended in all of FY 2018. These children and families are primarily from Guatemala, Honduras, and El Salvador.
Note: The term “family unit” refers to individuals—either a child under 18 years old, parent, or legal guardian—apprehended with a family member by the U.S. Border Patrol.
- View the most up-to-date DHS data on apprehensions of unaccompanied children and family units in FY 2018.
- View more DHS data on FY 2018 apprehensions.
Immigration Enforcement
Note: The government fiscal year runs from October 1 to September 30. All figures for immigration control and enforcement given here are for the fiscal year. The data presented here are the most recent offered by U.S. Customs and Border Protection (CBP) and U.S. Immigration and Customs Enforcement (ICE).
How many apprehensions of unauthorized immigrants occur at the border annually?
CBP reported a total of 404,142 apprehensions at both southern and northern borders in 2018, a significant increase from 310,531 in 2017, and closer to the 415,816 apprehensions in 2016. Ninety-eight percent of Border Patrol apprehensions in 2018 occurred along the Southwest border. While apprehensions were up in 2018, they remained a small share of the 1.6 million that occurred during the peak year of 2000.
Note: Apprehensions are events, not individuals. In other words, the same individual can be apprehended more than once, with each apprehension counted separately.
How many people are arrested by ICE within the United States yearly?
ICE made 158,581 administrative arrests in 2018, up 11 percent from a year earlier. An administrative arrest is the arrest of an individual for a civil violation of U.S. immigration law, which is subsequently adjudicated by an immigration judge or through other administrative processes.
How many people are deported per year?
Removals and returns result in the confirmed movement of inadmissible or deportable aliens out of the United States. Both ICE and CBP conduct removals and returns. Nearly 400,000 removals and returns were carried out in 2017, a decline from 440,000 in 2016.
There were 295,364 removals during 2017, representing 75 percent of the enforcement activity, and 100,754 returns. The removals total represents a drop from the 333,592 removals carried out in 2016. At the same time, the number of returns fell to the lowest level since 1965 (by comparison there were roughly 1 million returns in 2006), as the government has prioritized using the more formal sanction of removal, which carries greater consequences than return if the migrant attempts re-entry.
- For more information, see the DHS report, Immigration Enforcement Actions: 2017.
- For more information, see FY 2018 ICE Enforcement and Removal Operations Report
- For an examination of the 3.7 million removals carried out between 2003 and 2013, see Deportation and Discretion: Reviewing the Record and Options for Change.
Naturalization Trends
How many immigrants are naturalized citizens?
In 2017, 22 million immigrants were naturalized U.S. citizens, accounting for 49 percent of the total foreign-born population (44.5 million) and almost 7 percent of the U.S. population (325.7 million), according to ACS estimates.
Of the 22 million naturalized citizens, 27 percent were naturalized between 2010 and 2017, 31 percent between 2000 and 2009, and 42 percent prior to 2000.
- Use this Naturalization in the United States, 1910-Present tool to learn more about naturalization population over time.
How many immigrants become U.S. citizens annually?
USCIS naturalized 707,000 LPRs in 2017. The total number of immigrants receiving U.S. citizenship decreased by 6 percent from 753,000 in 2016, even though the number of petitions filed increased from 972,000 in 2016 to 987,000 in 2017. The decrease in naturalizations granted is a combination of factors including longer processing time due to higher demand (8.1 months in 2017) and applications denials (83,000 in 2017).
From a historical perspective, naturalizations have increased dramatically in recent decades. On average, fewer than 120,000 LPRs became citizens each year between 1950 and 1969, 210,000 in the 1980s, 500,000 in the 1990s, and 680,000 during the 2000s.
Naturalizations reached an all-time high in 2008, increasing 59 percent from 660,000 in 2007 to 1,047,000 in 2008. This came as a result of impending application fee increases and the promotion of U.S. citizenship in advance of the 2008 presidential elections. Between 2010 and 2017, the average annual number of naturalizations was about 712,000.
- For more information, see the Source article Naturalization Trends in the United States.
- For more information on USCIS processing times, see Historical National Average Processing Time for All USCIS Offices.
How many foreign nationals become U.S. citizens through military naturalization?
In 2017, 6,900 foreign-born military personnel naturalized as U.S. citizens—a 23 percent drop from 2016 when 8,900 military personnel became Americans. Since 2002, 118,100 foreign-born military personnel naturalized on U.S. soil. Another 11,500 became citizens overseas or aboard Navy ships.
- For more historical data on naturalization, see Naturalization in the United States, 1910-Present data visualization tool.
- Read the USCIS fact sheet on Naturalization through Military Service and Military Naturalization Statistics.
Where are newly naturalized citizens from?
Of those who naturalized in 2017, 17 percent were born in Mexico (119,000), roughly 7 percent in India (51,002), and 5 percent each in China (38,000) and the Philippines (37,000). Immigrants from these four countries, together with those from the Dominican Republic (30,000), Cuba (26,000), Vietnam (19,000), El Salvador (17,000), Colombia (16,000), and Jamaica (15,000), comprised the top ten countries of birth for newly naturalized citizens in 2017. These ten countries accounted for 52 percent of the 707,000 new U.S. citizens that fiscal year.
Table 5. Top Ten Countries of Origin of Newly Naturalized Citizens, 2017
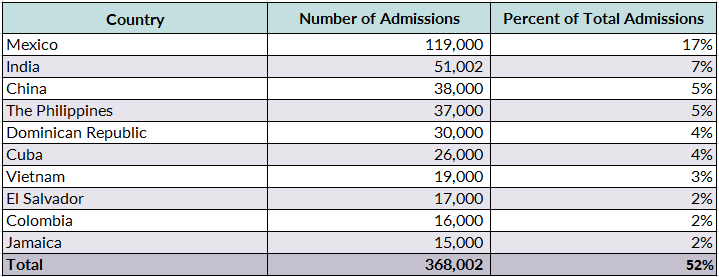
Source: DHS Office of Immigration Statistics, Yearbook of Immigration Statistics 2017.
Where do newly naturalized citizens live in the United States?
In 2017, 57 percent of the newly naturalized lived in one of five states. California had the largest number of newly naturalized citizens, with 22 percent (157,000), followed by 12 percent in New York (86,000), 10 percent in Florida (70,000), 7 percent in Texas (51,000), and 6 percent in New Jersey (39,000).
The top five metropolitan areas with the largest number of naturalizations were New York-Newark-Jersey City (113,000), Los Angeles-Long Beach (59,000), Miami-Ft Lauderdale-West Palm Beach (45,000), Washington-Arlington-Alexandria (30,000), and Chicago-Naperville (23,000). These five metropolitan areas accounted for over a third (38 percent) of all naturalizations in FY 2017.
How many green-card holders are eligible to naturalize?
According to the latest available DHS estimates, about 8.9 million of the 13.2 million green-card holders residing in the United States on January 1, 2014 were eligible to naturalize.
- For more information, see DHS Annual Flow Report.
How long does it take on average for green-card holders to naturalize?
On average, immigrants held green cards for eight years before becoming U.S. citizens in 2017—an average year longer than green-card holders in 2016. The time varied by country of origin: African- and Asian-born immigrants spent an average six years in LPR status before naturalization, followed by those born in South America (eight years), Europe (nine years), Oceania (ten years), and North America (including Central America, eleven years).
In general, naturalization requires being at least 18 years of age, passing English and civic exams, and for most, residing in the United States with LPR status continuously for at least five years (three years for those married to a U.S. citizen).
- For more information, see DHS Annual Flow Report.
- Read the USCIS Naturalization Eligibility Requirements.
Visa Backlogs
How many visa applications for permanent immigration (green cards) are backlogged?
In February 2019, the U.S. government was still processing some family-sponsored visa applications dating to August 1995, and employment-related visa applications from August 2007.
According to data on the petitions submitted to the State Department, there were about 3.8 million applicants (including spouses and minor children) who were on the waiting list as of November 1, 2018, the first time the backlog dropped in recent years.
The overwhelming majority of backlogs were family-sponsored applicants (3.7 million, which includes the principal applicant and their immediate family members). About 121,000 were employment-sponsored applicants and their families.
Of the overall 3.8 million applicants, 1.2 million were citizens of Mexico, followed by those from the Philippines (314,000), India (299,000), Vietnam and China (with 232,000 each). Family- and employment-based prospective immigrants who are waiting to adjust their status to lawful permanent resident from within the United States are not included in the State Department estimate.
USCIS also publishes backlog statistics but only for petitions approved in one of the five employment-based categories. USCIS data show that close to 395,000 approved employment-based immigrant petitions were awaiting a priority date based on the May 2018 Department of State Visa Bulletin. The figure corresponds to the number of primary applicants covered by these petitions but excludes their dependents. To MPI knowledge, USCIS did not publish backlog statistics on other types of green card applications the agency adjudicates.
In other words, the overall number of people waiting for a green card—within and outside of the United States—is likely to be larger than the 3.8 million reported by the State Department (as of November 2018) and 395,000 reported by USCIS (as of May 2018).
- For more details about wait times by immigration category and country of origin, see the State Department Visa Bulletin.
- Read Going to the Back of the Line: A Primer on Lines, Visa Categories, and Wait Times for more on the green-card backlog.
- Read the National Visa Center annual report on immigrant visa applicants and view USCIS employment-based immigrant petition backlog data.
Additional Data Resources: