

Frequently Requested Statistics on Immigrants and Immigration in the United States

An immigration boarding line. (Photo: iStock.com/Tony Studio)
Editor’s Note: The U.S. Census Bureau experienced significant challenges collecting data in 2020 due to the COVID-19 pandemic and released only a small number of data points from its 2020 American Community Survey, which it called “experimental.” As a result, this Spotlight has to rely on 2019 data for a number of sociodemographic and economic characteristics of immigrants and the U.S. born, with some of the trends it describes predating the pandemic.
U.S. immigration trends and policies underwent a series of dramatic changes over the last year. Wide COVID-19 vaccine availability in the United States and other wealthy countries led to easing of travel restrictions and gave new life to international mobility and the global economy. Meanwhile, President Joe Biden’s inauguration brought new policy priorities designed to increase migrant protections and smooth immigrants’ arrival into the country, in sharp contrast to the restrictive approach of the prior Trump administration. Among these was the Biden administration’s extension of temporary protections to just under 475,000 Venezuelans, Afghans, Ukrainians, and Burmese already in the United States, following global crises around the world. At the same time, a record-breaking number of apprehensions and expulsions occurred on the southern border, and continued slowdowns of government services due to the pandemic and other factors contributed to delayed immigration processing.
This Spotlight offers information about the approximately 44.9 million immigrants in the United States by compiling the most authoritative and current data available. It provides an overview of historic immigration trends in the United States, sociodemographic information about who is immigrating, through which channels, and how many immigrants become naturalized citizens. It also provides data on the government’s enforcement actions and adjudication efforts to process visas.
This article draws on statistics from the Migration Policy Institute (MPI); the U.S. Census Bureau (using its 2019 American Community Survey [ACS], 2021 Current Population Survey [CPS], and 2000 decennial census); and the U.S. Departments of Homeland Security (DHS) and State. (Note: DHS and State Department data refer to fiscal years that begin on October 1 and end on September 30; ACS and CPS data refer to calendar years). For more detailed information on U.S. and global immigration data sources and one-click access to these datasets, see the MPI report Immigration Data Matters. All the data tools and maps linked to in this article also can be accessed through MPI’s Migration Data Hub.
Click on the bullet points for more information on each topic:
- Immigrants Now and Historically
- Demographic, Educational, and Linguistic Characteristics
- Immigrant Destinations
- Immigrants in the Labor Force
- Income and Poverty
- Health Insurance Coverage
- Children of Immigrants
- Permanent Immigration
- Temporary Visas
- Refugees and Asylum Seekers
- Unauthorized Immigrants
- Immigration Enforcement
- Naturalization Trends
- Visa Backlogs
Immigrants Now and Historically
How many immigrants reside in the United States?
More than 44.9 million immigrants lived in the United States in 2019, the historical numeric high since census records have been kept. In 2019, immigrants comprised 13.7 percent of the total U.S. population, a figure that remains short of the record high of 14.8 percent in 1890.
The foreign-born population remained largely flat between 2018 and 2019, with an increase of 204,000 people, or growth of less than 0.5 percent. This is consistent with the 203,000 increase from 2017 to 2018 and much lower than the approximately 787,000 increase—or nearly 2 percent growth—between 2016 and 2017. The slowing growth of the immigrant population over the past few years is mirrored by the slowing growth of the overall U.S. population since 2015.
How have the number and share of immigrants changed over time?
In 1850, the first year the United States began collecting nativity data through the census, the country had 2.2 million immigrants, representing nearly 10 percent of the total population.
Between 1860 and 1920, immigrants’ share of the population fluctuated between 13 percent and almost 15 percent, peaking at 14.8 percent in 1890, largely due to high levels of immigration from Europe. Restrictive immigration laws in 1921 and 1924 limited permanent immigration almost exclusively to northern and western Europeans. Combined with the Great Depression and World War II, this led to a sharp drop in new arrivals from the Eastern Hemisphere. The foreign-born share steadily declined, hitting a record low of 4.7 percent (or 9.6 million immigrants) in 1970 (see Figure 1).
- Want more information about historical immigration to the United States? Check out the U.S. Immigrant Population and Share over Time, 1850-Present data tool.
Figure 1. Size and Share of the Foreign-Born Population in the United States, 1850-2019
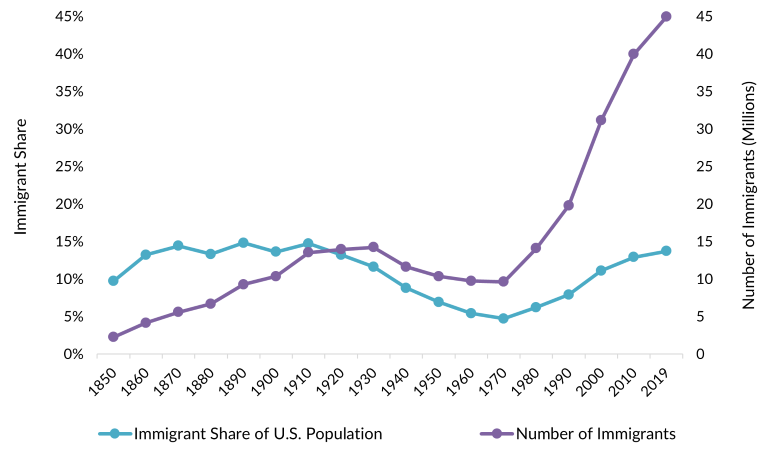
Sources: Migration Policy Institute (MPI) tabulation of data from U.S. Census Bureau, 2010-19 American Community Surveys (ACS), and 1970, 1990, and 2000 decennial census. All other data are from Campbell J. Gibson and Emily Lennon, "Historical Census Statistics on the Foreign-Born Population of the United States: 1850 to 1990" (Working Paper no. 29, U.S. Census Bureau, Washington, DC, 1999).
Since 1970, the share and number of immigrants have increased rapidly, mainly because of increased immigration from Latin America and Asia. Important shifts in U.S. immigration law were responsible for this change in flows, including the Immigration and Nationality Act of 1965 which abolished national-origin admission quotas, the creation of a formal refugee resettlement program with the Refugee Act of 1980, and the Cold War-era grant of preferential treatment to Cuban immigrants. Other factors were the United States’ growing economic and military presence in Asia and Latin America, as well as economic and social ties with the United States’ southern neighbors, and major economic transformations and political instability in countries around the world.
- Get a comprehensive understanding of U.S. historical immigration trends and policies in the article “Immigration Has Been a Defining, Often Contentious, Element Throughout U.S. History.”
- Understand the impact of the 1965 law in “Fifty Years On, the 1965 Immigration and Nationality Act Continues to Reshape the United States.”
- Read more about the end of national-origin quotas in “The Geopolitical Origins of the U.S. Immigration Act of 1965.”
Where are most immigrants from originally?
Mexicans are the largest group of U.S. immigrants, comprising 24 percent of the total immigrant population in 2019, which is a decline from 30 percent in 2000. China (including Hong Kong and Macao but not Taiwan) and India were the origins of the next two largest immigrant groups, each accounting for approximately 6 percent of the overall foreign-born population. Other top countries of origin include the Philippines (5 percent); El Salvador, Vietnam, Cuba, and the Dominican Republic (3 percent each); and Guatemala and Korea (each 2 percent).
Together, these ten countries accounted for 57 percent of all immigrants in the United States in 2019.
- To learn more about key immigrant populations, check out the Migration Information Source’s Spotlights archive. These articles provide data profiles of a range of individual immigrant groups in the United States including Mexicans, Chinese, Indians, Filipinos, Vietnamese, Cubans, and other countries and regions all over the world.
How do today’s top countries of origin compare to those of the past?
The large numbers of immigrants from Latin America and Asia in recent decades represent a sharp turnaround from the mid-1900s, when immigration largely came from Europe. In the 1960s no single country accounted for more than 15 percent of the U.S. immigrant population, but Italians were the top origin group, making up 13 percent of the foreign born in 1960, followed by Germans and Canadians (about 10 percent each).
Immigrants from Mexico were the most numerous for decades after 1970, but the composition of new arrivals has changed since 2010. Now, immigrants are more likely to come from Asia, with India and China leading the way. In fact, in 2013 India and China displaced Mexico as the top origin countries for new arrivals.
The number of immigrants from the Dominican Republic, the Philippines, Cuba, Venezuela, Guatemala, and El Salvador has also increased since 2010. By contrast, the number of Mexican immigrants in the United States declined by more than 779,000 between 2010 and 2019, representing the largest absolute decline of all immigrant groups.
Among the groups with at least 100,000 immigrants in the United States in 2019, the Venezuelan immigrant population increased the most between 2010 and 2019 (by 153 percent), followed by individuals from Afghanistan (143 percent), Nepal (140 percent), Myanmar (also known as Burma; 84 percent), and Nigeria (79 percent).
- See how immigrants’ regions of origin of have changed with the Regions of Birth for Immigrants in the United States, 1960-Present data tool.
- Want to see immigration trends from individual countries? Use the Countries of Birth for U.S. Immigrants, 1960-Present data tool.
- Compare the top ten origin countries in different decades with the interactive Largest U.S. Immigrant Groups over Time, 1960-Present data tool.
- Read more about “Immigrants from New Origin Countries in the United States.”
How long have current immigrants resided in the United States?
Fifty-one percent of all immigrants in the United States in 2019 arrived prior to 2000 (29 percent entered before 1990 and 21 percent between 1990 and 1999), while 25 percent entered between 2000 and 2009. The remaining 25 percent have come since 2010.
How many U.S. residents are from immigrant families?
Immigrants and their U.S.-born children number approximately 84.8 million people, or 26 percent of the U.S. population in the 2021 CPS, a decline of approximately 950,000 from 2020. The Pew Research Center has projected that the immigrant-origin share of the population will rise to about 36 percent by 2065.
Demographic, Educational, and Linguistic Characteristics
What is the median age for immigrants?
The immigrant population’s median age in 2019 was 45.7 years, making it older than the U.S.-born population, which had a median age of 36.5 years. One reason for this is that the immigrant population is comprised of people who arrive largely as adults, whereas immigrants’ children born in the United States contribute to the younger median age of the U.S.-born population.
Fewer than 1 percent of immigrants were under age 5 in 2019, compared to 7 percent of the U.S.-born population in this age group. Children and youth ages 5 to 17 years accounted for 5 percent of immigrants and 18 percent of the U.S. born. People of working age (18 to 64 years) comprised 78 percent of the immigrant population, a much higher figure than the 59 percent of those born in the United States. Approximately 17 percent of immigrants were 65 years and older, similar to the 16 percent of the U.S. born in this age group.
What is the sex ratio of the immigrant population?
Slightly more immigrants are women and girls than men or boys; in 2019, about 52 percent of all U.S. immigrants were female. The share has fluctuated slightly over the past four decades, but females tend to be a slight majority. They accounted for 53 percent of the immigrant population in 1980, 51 percent in 1990, 50 percent in 2000, and 51 percent in 2010.
What is the racial makeup of immigrants?
In 2019, 45 percent of immigrants reported their race as single-race White, 27 percent as Asian, 10 percent as Black, and 15 percent as some other race. About 2 percent reported having two or more races.
- Use the State Immigration Data Profiles from MPI’s Migration Data Hub to learn more about the demographic characteristics of immigrants and the U.S. born (including age, race, and ethnicity) in each of the 50 states, the District of Columbia, and nationwide.
How many immigrants are Hispanic or Latino?
In 2019, 44 percent of U.S. immigrants (19.8 million people) reported having Hispanic or Latino ethnic origins.
Note: The Census Bureau classifies Hispanic and Latino as ethnic categories, separate from the racial categories listed above (see Definitions box for more information).
How many Hispanics in the United States are immigrants?
Most U.S. Hispanics are U.S. born. Of the 60.5 million people in 2019 who self-identified as Hispanic or Latino, 33 percent (19.8 million) were immigrants and 67 percent (40.6 million) were native born.
Which languages are most frequently spoken at home?
In 2019, approximately 78 percent (241 million) of all 308.8 million U.S. residents ages 5 and older regardless of nativity reported speaking only English at home. The remaining 22 percent (67.8 million) reported speaking a language other than English at home.
Among those who reported speaking a language other than English at home, 62 percent spoke Spanish. Other top languages were Chinese (including Mandarin and Cantonese, 5 percent); Tagalog (almost 3 percent); and Vietnamese, Arabic, French (including Cajun), and Korean (about 2 percent each) (see Table 1).
Table 1. Languages Spoken at Home Other than English (ages 5 and older), 2019
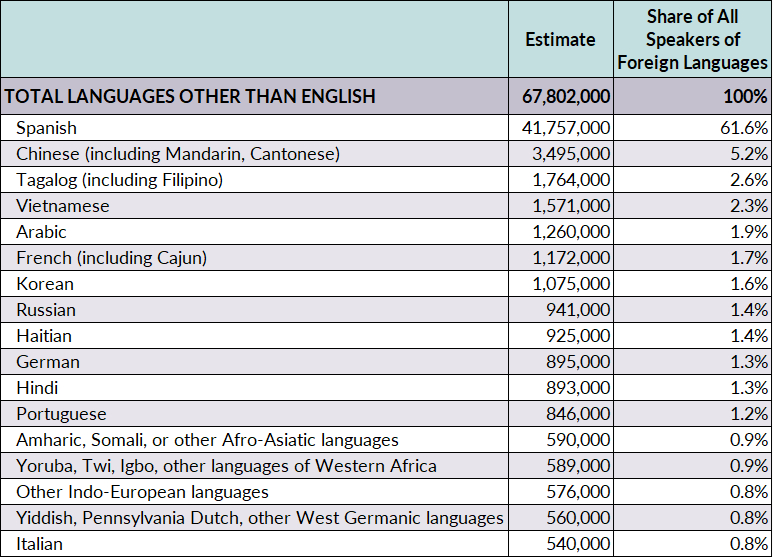
Source: MPI tabulation of data from the U.S. Census Bureau 2019 ACS.
Not including English, Spanish was the most common language spoken at home in all but four states: Alaska (where the Eskimo-Aleut languages dominated), Hawaii (Ilocano, Samoan, Hawaiian, Marshallese, or other Austronesian languages), and Maine and Vermont (French) (see Figure 2).
Figure 2. Map of Most Commonly Spoken Languages other than English and Spanish by State, 2019
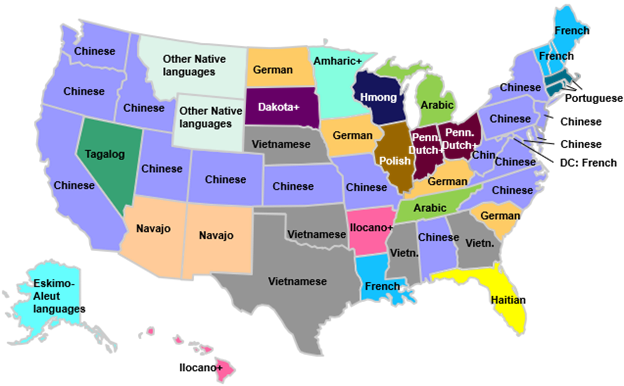
Notes: Chinese includes Mandarin and Cantonese; Dakota+ includes Dakota, Lakota, Nakota, and Sioux; French includes Cajun; Ilocano+ includes Ilocano, Samoan, Hawaiian, Marshallese, or other Austronesian languages; Pennsylvania Dutch+ includes Pennsylvania German, Yiddish, or other West Germanic languages; and Tagalog includes Filipino.
Sources: MPI analysis of data from the U.S. Census Bureau 2019 ACS for the United States and all states except Alaska, Arkansas, Hawaii, Idaho, Maine, Mississippi, Montana, New Hampshire, North Dakota, Rhode Island, South Dakota, Vermont, West Virginia, and Wyoming, as well as the District of Columbia. Data for these 15 jurisdictions are from the U.S. Census Bureau pooled 2015-19 ACS.
How many immigrants are Limited English Proficient (LEP)?
In 2019, approximately 46 percent (20.7 million) of the 44.6 million immigrants ages 5 and older were Limited English Proficient (LEP). Immigrants accounted for 81 percent of the country’s 25.5 million LEP individuals.
Note: The term "Limited English Proficient" refers to persons ages 5 and older who reported speaking English "not at all," "not well," or "well" on their survey questionnaire. Individuals who reported speaking “only English” or speaking English "very well" are considered proficient in English.
- MPI has compiled information on the size of the LEP population across the United States and by state in the data table Limited English Proficient Population: Number and Share, by State, 1990, 2000, 2010, and 2019.
What share of the immigrant population has a college education?
In 2019, 33 percent (12.9 million) of the 39.5 million immigrants ages 25 and older had a bachelor’s degree or higher, similar to U.S.-born adults (see Figure 3). However, newer arrivals tend to be better educated; 48 percent of immigrants who entered the country between 2014 and 2019 held at least a bachelor’s degree.
Figure 3. Educational Attainment of U.S.-Born, Immigrant, and Recently Arrived Immigrant Adults, 2019
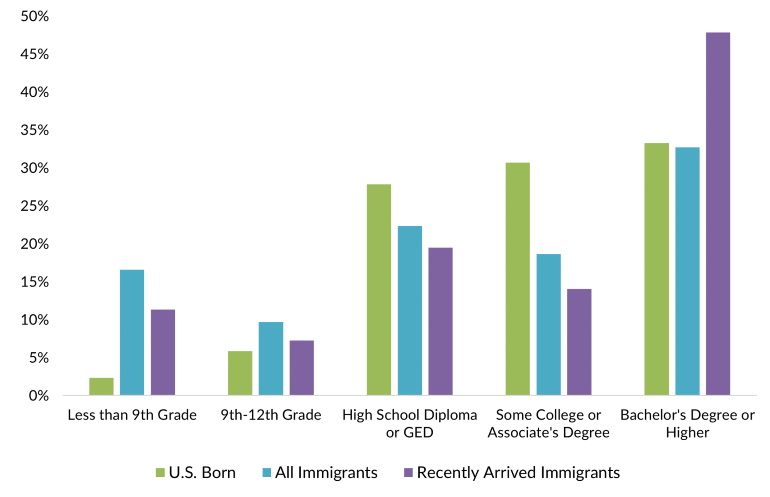
Note: Data are for adults ages 25 and older. Recently arrived immigrants are those who entered the United States between 2014 and 2019.
Source: MPI tabulation of data from the U.S. Census Bureau 2019 ACS.
Educational attainment varies by immigrants’ country of origin. Almost 80 percent of immigrant adults from India had a bachelor’s degree or more in 2019, more than any other origin country. Other top countries were Zimbabwe (74 percent), Taiwan (73 percent), the United Arab Emirates and Belarus (70 percent each), and Singapore (69 percent).
- Find information for all origin countries in the MPI dataset Educational Attainment Among U.S.-Born Adults and All Immigrant Adults by Country of Birth in 2019.
- Read more about the socioeconomic characteristics of highly educated immigrants in “College-Educated Immigrants in the United States.”
Immigrant Destinations
Which U.S. states have the largest numbers of immigrants?
The U.S. states with the most immigrants in 2019 were California (10.6 million), Texas (5 million), Florida (4.5 million), New York (4.4 million), and New Jersey (2.1 million).
As a percentage of the total population, immigrants made up the largest shares in California (27 percent), New Jersey (23 percent), New York (22 percent), Florida (21 percent), and Nevada (20 percent).
- For more information on the top states of residence for the foreign born, see the interactive tool Immigrant Population by State, 1990-Present.
- Want to know where immigrants from a particular region or country of origin settled in the United States? Use the Migration Data Hub’s interactive maps to see top immigrant concentrations at state and county or metropolitan-area levels.
Which states have experienced the fastest growth of their immigrant populations?
Traditional immigrant destinations have the largest absolute number of new immigrants. But other states have seen much larger relative growth in their immigrant populations. In some cases this is because the states’ initial foreign-born populations were quite small, so a relatively small absolute increase has translated into high-percent growth (see Table 2). For instance, more immigrants moved to Florida between 2010 and 2019 than any other state (868,000), but the size of the immigrant population in South Dakota grew by a larger relative share (68 percent).
Table 2. Top Five States by Absolute and Percent Growth in Immigrant Population, 2010-19
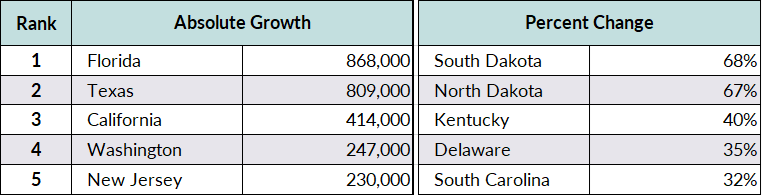
Source: MPI tabulation of data from the U.S. Census Bureau 2010 and 2019 ACS and 2000 decennial census.
Immigrants in the Labor Force
How many immigrants are in the U.S. civilian labor force?
Immigrants constituted 17 percent (28.6 million people) of the civilian labor force (166.3 million) in 2019, which comprises both employed and unemployed people. Immigrant participation in the labor force has more than tripled since 1970, when immigrants accounted for approximately 5 percent of the civilian labor force.
- Understand immigrants' evolving composition in the labor force nationwide and by state with the Immigrant Share of the U.S. Population and Civilian Labor Force, 1980-Present data tool.
What types of jobs do immigrants perform?
Of the 27.6 million employed foreign-born workers ages 16 and older in 2019, the largest share (35 percent) worked in management, professional, and related occupations (see Figure 4).
Figure 4. Employed Workers in the U.S. Civilian Labor Force (ages 16 and older), by Nativity and Occupation, 2019
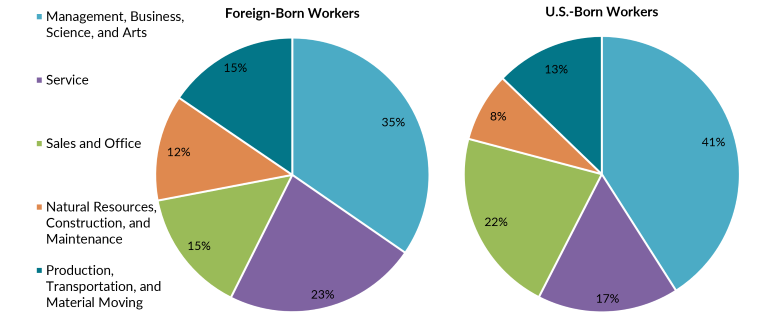
Note: Numbers may not add up to 100 as they are rounded to the nearest whole number.
Source: MPI tabulation of data from the U.S. Census Bureau 2019 ACS.
- Check out the Migration Data Hub’s State Immigration Data Profiles for more information on the labor force participation of immigrants and the U.S. born in the United States, each of the 50 states, and the District of Columbia.
Income and Poverty
Immigrants tend to have slightly lower incomes than the native born. Immigrant households in 2019 had a median income of $63,550, compared to $66,040 for native-born households.
Fourteen percent of immigrants were poor (that is, with family incomes below the official poverty threshold of $25,750 for a family of four in 2019), compared to 12 percent of the U.S. born.
Health Insurance Coverage
What share of immigrants have health insurance?
Approximately 58 percent of U.S. immigrants had private health insurance in 2019 (compared to 69 percent of the U.S. born), and 30 percent had public health insurance coverage (compared to 36 percent of the U.S. born). Meanwhile, about 20 percent lacked health insurance (compared to slightly less than 8 percent of the U.S. born).
Since implementation of the Affordable Care Act (ACA) in 2014, health insurance coverage rates have improved for both the U.S. born and immigrants. From 2013 to 2017, the rate of uninsured immigrants fell from 32 percent to 20 percent, and the rate for the native born fell from 12 percent to 7 percent. The Trump administration made a number of changes to ACA policies, including eliminating the individual coverage mandate penalty, ending cost-sharing subsidies to insurers, and cutting funding for navigator programs. The rates of those uninsured has since remained mostly level.
Note: Health insurance coverage is calculated only for the civilian, noninstitutionalized population. Since some people may simultaneously hold both private and public health insurance coverage, estimates of those with public health insurance and those with public coverage may overlap. The sum of these rates therefore may be greater than the total share of people with health insurance.
Children of Immigrants
How many U.S. children live with immigrant parents?
Approximately 17.8 million U.S. children under age 18 lived with at least one immigrant parent in 2019. They accounted for 26 percent of the 68.9 million children under age 18 in the United States, up from 19 percent in 2000 and 13 percent in 1990.
Most of these children are themselves native born. Second-generation immigrant children born in the United States to at least one foreign-born parent accounted for 88 percent (15.6 million) of all children with immigrant parents. The remaining 12 percent (2.2 million) were born outside the United States.
Note: Beginning with the 2014 ACS, the U.S. Census Bureau has excluded children of same-sex married couples from the total number of children; the same information is unavailable by parental nativity.
- For information on children living with immigrant parents by age and in different states, see the Children in U.S. Immigrant Families data tool.
How has the number of children in immigrant families changed over time?
Between 2010 and 2019, the number of children ages 17 and under with immigrant parents grew by 5 percent, from 17 million to 17.8 million. This was a significantly smaller rate of growth than during the 2000-2010 era, when the number grew by 30 percent, from 13.1 million.
This growth has been driven by the increasing number of children born in the United States to immigrant parents, which has gone up steadily since 2000. Their numbers increased by 7 percent between 2010 and 2019, from 14.6 million up to 15.6 million. This followed rapid growth of 40 percent between 2000—when their population was 10.4 million—to 2010.
Meanwhile, the population of first-generation immigrant children born outside the United States has declined over the last 20 years. It dropped by 9 percent between 2010 and 2019, from 2.4 million to 2.2 million, after a 12 percent drop during the 2000-2010 period, at the start of which there were 2.7 million first-generation immigrant children.
How many children living with immigrant parents are in low-income families?
Regardless of nativity, 25.6 million children under 18 lived in families with incomes below 200 percent of the federal poverty threshold in 2019. Of them, nearly 8 million (or 31 percent) had one or more foreign-born parent.
Of the 17.8 million children of immigrants, 45 percent were in low-income families. This is a higher rate than for children of U.S.-born parents (35 percent of the 51.1 million).
- For state-level estimates of children of immigrants and share in low-income families, see the Demographic and Social Profiles in the State Immigration Data Profiles.
In which states do most children in immigrant families live?
In terms of absolute numbers, the top states for children under age 18 living with immigrant parents in 2019 were California (4 million), Texas (2.4 million), New York and Florida (1.4 million each), and New Jersey (769,000). These states accounted for 56 percent of the 17.8 million U.S. children with immigrant parents.
In terms of the share of children who had immigrant parents, the top states in 2019 were California (47 percent of all children in the state), New Jersey (41 percent), Nevada (38 percent), New York (36 percent), and Texas (35 percent).
Which states have experienced the fastest growth of the number of children in immigrant families?
Traditional immigrant destinations such as Texas and Florida experienced the largest absolute growth in the number of children with immigrant parents in recent years, but other states have seen much larger relative growth (see Table 3). In states such as North Dakota, the initial number of children with immigrant parents was quite small, so relatively small absolute increases have translated into high-percent growth.
Table 3. Top Five States by Absolute and Percent Growth in Children with Immigrant Parents, 2010-19
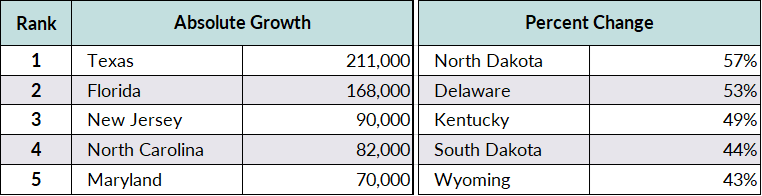
Source: MPI tabulation of data from the U.S. Census Bureau 2010 and 2019 ACS and 2000 decennial census.
Permanent Immigration
How many immigrants obtain lawful permanent residence (also known as getting a green card)?
In fiscal year (FY) 2020, slightly more than 707,000 immigrants became lawful permanent residents (LPRs, also known as green-card holders), the lowest number since 2003 and the first time the figure dropped below 1 million since 2013, when 991,000 people obtained green cards. The number of new LPRs in FY 2020 was approximately 324,000 lower than in FY 2019 (a decline of 31 percent), and represented a decrease of 476,000 (a 40 percent decline) from the recent high of 1.2 million in FY 2016.
Much of the decline in new LPRs in FY 2020 is due to the fewer number granted to individuals living outside the country, as result of processing and other delays during the COVID-19 pandemic. In the past decade, immigrants obtaining LPR status have been on average about evenly divided between those already living in the United States who are adjusting their status and those applying from abroad. But in FY 2020 the 268,000 new green cards issued to applicants abroad represented just 38 percent of the total, and a 41 percent decline from the nearly 454,000 issued in FY 2019. The overwhelming majority of these new arrivals (82 percent) were immediate family members of U.S. citizens and LPRs.
Meanwhile, approximately 62 percent (or 439,000) of the 707,000 new LPRs in FY 2020 received green cards from within the United States. Most of these new permanent residents were spouses, children, and parents of U.S. citizens and LPRs, followed by people who obtained their green cards through employment or after initially entering the country as refugees and asylees.
- Trace changing trends in permanent immigration over time with the Legal Immigration to the United States, 1820-Present data tool.
- For more on the impact of immigration backlogs during the COVID-19 pandemic, read the U.S. Policy Beat article “Mounting Backlogs Undermine U.S. Immigration System and Impede Biden Policy Changes.”
Under which categories are permanent immigrants admitted?
There are four main pathways to obtain a green card: through a family relationship, employment sponsorship, humanitarian protection (for refugees and asylees), and the Diversity Visa (DV) lottery (also known as the green-card lottery). Some categories within these pathways are capped at the number of new green cards that can be issued each year.
Of the 707,000 immigrants who received green cards in FY 2020, 45 percent were immediate relatives of U.S. citizens (an uncapped visa category), followed by 17 percent were family-related immigrants (whose admission is limited by visa and country caps). About 21 percent of new LPRs were sponsored by their employers or self-petitioned, including investors who create jobs, a jump from just 14 percent of new LPRs in FY 2019. Meanwhile, 9 percent adjusted from refugee or asylee status and approximately 4 percent were diversity lottery winners.
What are the most common countries of origin for new permanent immigrants?
The top five countries of birth for new LPRs in FY 2020 were Mexico (14 percent), India (7 percent), mainland China (6 percent), and the Dominican Republic, Vietnam, and the Philippines (4 percent apiece). Together, these countries represented about 39 percent of all new green-card recipients in FY 2020.
How many people are selected in the Diversity Visa lottery and where do they come from?
The Diversity Visa lottery is available to individuals from countries with low rates of immigration to the United States. Created in 1990, the lottery sets aside 55,000 green cards annually, of which 5,000 must be used for applicants under the Nicaraguan and Central America Relief Act of 1997. Interest in the lottery is significantly higher than the amount of available visas; about 6.7 million qualified applications were filed for the DV-2021, covering 11.8 million applicants plus their spouses and minor children. This number was down from 14.7 million applications in DV-2020 and 14.4 million in DV-2019. (The number of applications varies each year in part because the list of eligible countries is modified annually.) Before receiving permission to immigrate, lottery winners must provide proof of a high school education or its equivalent or show two years of work experience within the past five years in an occupation that requires at least two years of training or experience. They also must pass a medical exam and a background check.
In FY 2020, 25,000 people received a green card as diversity immigrants, representing approximately 4 percent of the 707,000 new LPRs.
The leading countries of birth of DV recipients were Nepal and the Democratic Republic of the Congo, together accounting for about 14 percent of DV entrants adjusting to LPR status in FY 2020. Other top countries of origin were Egypt and Russia (6 percent each), Albania (5 percent), and Ukraine, Sudan, and Algeria (4 percent each).
For some countries, the Diversity Visa lottery represents a major share of all new LPRs. For example, 59 percent of all nationals of Algeria who obtained LPR status in FY 2020 did so through the green-card lottery. Shares were also high for nationals of Tajikistan (58 percent), Benin (52 percent), Sudan (50 percent), and Azerbaijan (48 percent).
- Read the most recent State Department Visa Bulletin for more on the DV lottery.
- For more information on the Diversity Visa program, read The Diversity Visa Program Holds Lessons for Future Legal Immigration Reform.
Temporary Visas
How many nonimmigrant visas does the State Department issue each year?
The 2.8 million nonimmigrant visas issued by the State Department in FY 2021—which include tourists and other short-term visitors—represented a 30 percent decline from the 4 million issued in FY 2020, and marked the sixth year in a row that these numbers have gone down.
Forty-eight percent of the nonimmigrant visas issued in FY 2021 were temporary business and tourist visas (B and BCC visas). The next largest visa class was for academic students and exchange visitors and their family members (F and J visa categories), which comprised 19 percent, and 17 percent was for temporary workers and trainees and their family members (H visa categories).
The Trump administration’s travel ban, which was extended to six other countries in early 2020, was one reason for the sharp decline in nonimmigrant visa issuances in FY 2021. On June 22, 2020, President Donald Trump issued a proclamation suspending the issuance of certain nonimmigrant visas including H-1B visas (for temporary workers in specialty occupations), H-2B visas (for nonagricultural workers), certain J visas (for exchange visitors), and L visas (for intracompany transferees), as well as recipients’ dependents. Additionally, the COVID-19 pandemic, which prompted a global slowdown in international mobility and a slew of border restrictions, continues keeping the number of visas issued down.
Note: The number of visas issued does not necessarily match the number of foreign nationals who entered the United States that year because some nonimmigrant visas may not be used.
- Want more information about temporary nonimmigrant population trends? Read “Temporary Visa Holders in the United States.”
- Read the State Department’s Annual Reports of the Visa Office.
- Read the State Department’s fact sheet on Visa Refusals.
How many nonimmigrant admissions does DHS grant each year?
Foreign nationals were admitted into the United States for nonimmigrant purposes 86 million times in FY 2020—a 54 percent decrease from the 186 million in 2019. Of the 86 million, nearly 49 million were admissions of Canadians and Mexicans traveling for business or pleasure, who are exempt from completing the I-94 arrival/departure form at the port of entry; DHS does not provide characteristics for this group.
The remaining 37.2 million temporary admissions of nonimmigrants who filled out the I-94 form were similarly 54 percent fewer than the 81.6 million admissions a year earlier. Most were admissions of tourists (77 percent) or business travelers (11 percent), followed by temporary workers and their families (7 percent; see Table 4).
Table 4. Nonimmigrant Admissions by Category, FY 2020 (I-94 only)
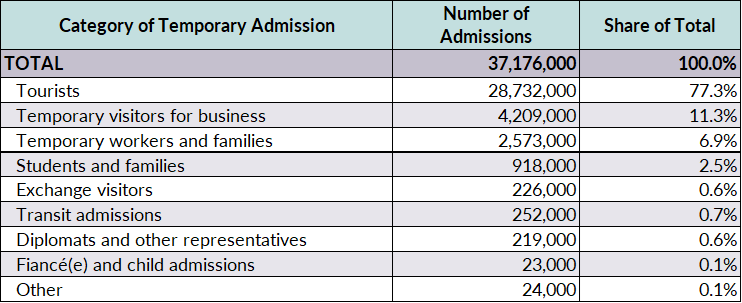
Note: Nonimmigrant admissions represent the number of entries. Individuals may have multiple entries within the year. The Department of Homeland Security (DHS) Office of Immigration Statistics reports characteristics of nonimmigrants who must complete an I-94 arrival/departure form at entry.
Source: MPI tabulation of data from DHS, 2020 Yearbook of Immigration Statistics (Washington, DC: DHS Office of Immigration Statistics, 2022), available online.
These data are for the number of times people were admitted into the country—not the number of individuals who were admitted (in other words, a single individual can be admitted multiple times in a year). Often, these people stay in the United States for only a short period, such as for the duration of their vacation or business trip. Only once has the DHS Office of Immigration Statistics (OIS) estimated the number of individuals who came temporarily, in FY 2016. For that year, DHS estimated that 42.7 million individuals entered as I-94 nonimmigrants on various temporary visas, each of whom was admitted 1.8 times on average.
Most of these nonimmigrants—34.2 million—entered as tourists, followed by 3.7 million as business visitors. Of these, 15 million tourists and 1.7 million business travelers were from Visa Waiver Program countries, meaning they did not need a visa to enter the United States. An additional 1 million international students entered on F-1 visas. OIS additionally estimated that about 290,300 individuals were admitted on high-skilled worker H-1B visas (mostly from India, China, Canada, the United Kingdom, and Mexico) and 81,600 on nonagricultural temporary or seasonal worker H-2B visas (mostly from Mexico, Jamaica, Guatemala, South Africa, and Canada).
Note: Nonimmigrant admissions represent the number of entries. Individuals may have multiple entries within the year.
- Read the DHS fact sheet on Nonimmigrant Admissions and Estimated Nonimmigrant Individuals.
- Read more about nonimmigrant admissions from DHS.
How many U.S. residents have temporary visas?
According to DHS, 3.2 million foreign nationals on various temporary visas resided in the United States during FY 2019, up from about 2.8 million in FY 2018. About half (1.6 million) were temporary workers and their families, followed by 35 percent who were foreign students and their families (1.1 million).
Sixty percent of temporary-visa holders residing in the United States were from Asia, while 17 percent were from elsewhere in North America and 14 percent were from Europe. The top countries of origin were India (27 percent), China (14 percent), Mexico (9 percent), Canada (6 percent), and South Korea (3 percent). Together, these five countries accounted for approximately 60 percent of all U.S. residents on temporary visas.
Note: The population of residents holding temporary visas includes temporary workers, international students, exchange visitors, diplomats, and representatives of foreign governments and international organizations. It excludes tourists and other short-term visitors. North America includes Canada, Bermuda, Central America, and the Caribbean.
Refugees and Asylum Seekers
How many refugees enter the United States each year, and where were they from?
Every year, the president in consultation with Congress sets the annual refugee admissions ceiling and allocations by region of origin. The Trump administration set the ceiling at 15,000 in FY 2021 and 18,000 in FY 2020, down from 30,000 in FY 2019 and the lowest since the resettlement program was formally created in 1980. The Biden administration subsequently revised the FY 2021 limit to 62,500 and doubled the number to 125,000 for FY 2022.
Due to the limited capacity of the resettlement program and COVID-19-related logistic challenges, only 11,411 refugees were resettled in the United States in FY 2021, amounting to 18 percent of the 62,500 allocated spaces for the year. By the end of February 2022, nearly 6,500 refugees arrived in the United States, out of the 125,000 allowed for FY 2022.
In FY 2021, refugees’ primary countries of nationality were the Democratic Republic of the Congo, Syria, Afghanistan, Ukraine, and Myanmar (also known as Burma). Combined, these countries accounted for 75 percent (nearly 8,600) of all refugees resettled that year. Rounding out the top ten were Sudan, Iraq, El Salvador, Eritrea, and Iran. Together, nationals of the top ten countries comprised 89 percent (almost 10,200) of all refugee arrivals in FY 2021 (see Table 5).
Table 5. Top Ten Countries of Refugee Admissions by Nationality, FY 2021
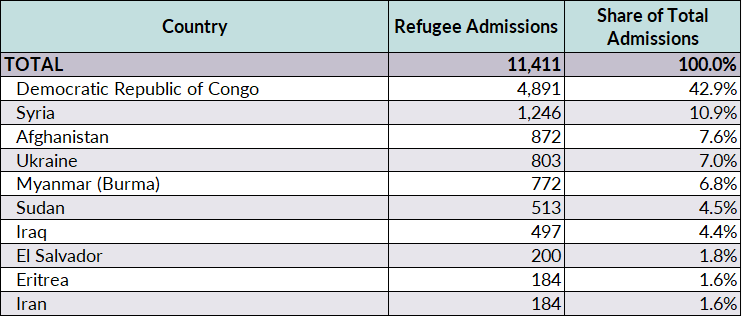
Source: MPI tabulation of Worldwide Refugee Admissions Processing System (WRAPS) data from the State Department’s Bureau of Population, Refugees, and Migration.
As of this writing, 692 refugees from Ukraine had been resettled so far in the United States during the first five and a half months of FY 2022, 62 percent of whom arrived during February 2022.
- For more data on refugees, including top resettlement states, read the Migration Information Source Spotlight on “Refugees and Asylees in the United States.”
- Learn more about refugee admissions by year, national origin, and destination with State Department WRAPS data.
What is the sex ratio of the admitted refugee population?
About 48 percent of refugees admitted into the United States in FY 2020 were female.
What are the most common religions of admitted refugees?
Refugees who identified as Christian (including Pentecostalists, Catholics, and Baptists) made up 74 percent of all admitted refugees in FY 2020. Muslim refugees (including Sunni and Shiite) comprised 22 percent of admitted refugees. The remainder included Buddhists (1 percent) and Hindu (under 1 percent). About 1 percent of refugees reported not being affiliated with any religion or being atheists.
Overall, the United States admitted more Christian refugees in the past decade than Muslim ones. Between FY 2010 and FY 2020, Christians represented 48 percent (286,100) of the 601,000 refugees with known religion data, compared to 33 percent (201,000) who were Muslim. FY 2016 marked the only time since 2010 when the United States resettled more Muslim refugees (38,900 individuals, or 46 percent of the total 85,000 refugees in FY 2016) than Christians (44 percent, 37,500 individuals).
Note: Refugee demographic data is based on self-identification, so religious breakdowns include major religions as well as denominations.
What are the most common languages spoken by refugees?
In FY 2020, the top languages spoken by refugees were Ukrainian, Russian, Arabic, and Kiswahili. Rounding the top ten were Spanish, Kinyarwanda, Sgaw Karen, Kibembe, Tigrinya, and Dari. Speakers of the top ten languages made up 71 percent of all refugees resettled that year.
How many asylum applications are filed each year?
U.S. Citizenship and Immigration Services (USCIS) received approximately 61,000 affirmative asylum applications in FY 2021, the fewest since FY 2014. This marked the fourth year of declining applications after eight years of growth.
Meanwhile, 63,800 defensive asylum applications were filed in FY 2021 with the Department of Justice’s immigration court system, the Executive Office for Immigration Review (EOIR)—a 59 percent decrease from the 155,000 applications filed in FY 2020.
What is the asylum approval rate?
According to preliminary USCIS data, 28 percent of affirmative asylum petitions completed in FY 2021 were approved, similar to the 27 percent approval rate in FY 2020 and a slight decrease from the 31 percent in FY 2019 and 30 percent in FY 2018.
Approvals of asylum petitions handled by immigration courts rebounded in FY 2021 after undergoing a steady downward trend: 34 percent of such applications were approved, versus 26 percent in FY 2020, 29 percent in FY 2019, 33 percent in FY 2018, 37 percent in FY 2017, and 43 percent in FY 2016.
How many people receive asylum status?
In FY 2019, 46,500 individuals were granted asylum after seeking protection upon or after arrival in the United States, including principal applicants and their spouses and/or unmarried children under age 21. This represented a 24 percent increase from the 37,600 people granted asylum in FY 2018. An additional 3,300 individuals received derivative asylum status in the United States as immediate family members of principal applicants and 6,300 were approved for derivative status outside the United States. (Note that this number reflects travel documents issued to these family members, not their arrival in the United States.)
More than 59 percent of asylum grants came affirmatively through USCIS (rather than defensively through the immigration courts), of which there were 27,600 in FY 2019, up 13 percent from 24,400 in FY 2018 and 77 percent from 15,600 in FY 2017. This increase is partly a result of a January 2018 policy change by USCIS to begin adjudicating asylum applications on a last-in, first-out basis, which the agency has said discourages non-meritorious cases.
Where are most asylum seekers from?
China was the top country of origin for those receiving asylum in FY 2019, with 7,500 people (or 16 percent of total asylum grants), followed closely by Venezuela, with 6,800 individuals (15 percent). Other top countries of origin were El Salvador (with 3,200), Guatemala (2,600), and India (2,300). Together, nationals of these five countries made up 48 percent of those receiving asylum in FY 2019.
What is the current asylum application backlog?
Due to the large application volume and limited resources, both the affirmative and defensive asylum systems have extensive backlogs. As of the end of 2021, more than 432,000 affirmative asylum cases were pending with USCIS and nearly 629,000 cases were pending with EOIR.
- For more information, see the USCIS affirmative asylum quarterly reports, EOIR’s workload and adjudication statistics data on asylum cases, and the Refugees and Asylees Annual Flow Report from DHS’s Office of Immigration Statistics.
- For more on the immigration court backlog and asylum share, see the MPI report The U.S. Asylum System in Crisis: Charting a Way Forward.
Unauthorized Immigrants
How many unauthorized immigrants are in the United States?
The Migration Policy Institute (MPI) estimates there were about 11 million unauthorized immigrants in the United States in 2019. Almost half resided in three states: California (25 percent), Texas (16 percent), and New York (8 percent). The vast majority (81 percent) lived in 176 counties with 10,000 or more unauthorized immigrants each, of which the top five—Los Angeles County, California; Harris County, Texas; Dallas County, Texas; Cook County, Illinois; and Orange County, California—accounted for 20 percent of all unauthorized immigrants.
- Visit the Migration Data Hub’s Unauthorized Immigrant Population Profiles for detailed sociodemographic information about unauthorized immigrants nationwide, in 41 states and the District of Columbia, and 130 counties.
- MPI estimates of the number of unauthorized individuals who could receive legal status under various policy scenarios, including DREAMers, essential workers, and farmworkers, in Back on the Table: U.S. Legalization and the Unauthorized Immigrant Groups that Could Factor in the Debate. See also MPI Estimates of Potential Beneficiaries under the DREAM Act of 2021.
What are unauthorized immigrants’ countries of birth?
Mexicans and Central Americans accounted for roughly two-thirds (67 percent, or 7.4 million) of U.S. unauthorized immigrants in 2019, according to MPI estimates. About 1.7 million (15 percent) were from Asia; 907,000 (8 percent) from South America; 440,000 (4 percent) from Europe, Canada, or Oceania; 327,000 (3 percent) from the Caribbean; and 295,000 (3 percent) from Africa.
Unauthorized immigrants’ top countries of birth were Mexico (48 percent), El Salvador and Guatemala (7 percent each), India (5 percent), and Honduras (4 percent).
- Use the interactive map, Unauthorized Immigrant Populations by Country and Region, Top States and Counties of Residence, 2019 to view top U.S. concentrations by country or region of origin.
How many unauthorized immigrants live with children under age 18?
About 4.3 million unauthorized immigrants (41 percent of all unauthorized immigrants ages 15 and older) lived with one or more children under age 18, MPI estimates. Of this group, about 81 percent (3.5 million) resided with at least one U.S.-citizen child under age 18, and 19 percent (806,000) lived with children who were not U.S. citizens.
How many children under age 18 live with at least one unauthorized immigrant parent?
Approximately 5.5 million children under age 18 lived with an unauthorized immigrant parent as of 2019, representing 7 percent of the U.S. child population. About 86 percent (4.7 million) of these children were U.S. citizens, another 13 percent (726,000) were themselves unauthorized, and 1 percent (61,000) were legally present, including LPRs and those with temporary visas.
How many people are eligible for the Deferred Action for Childhood Arrivals (DACA) program under original rules and how many applications have been received since its launch in 2012?
The DACA program, announced in 2012, offers two years of deportation relief and work authorization to eligible young unauthorized immigrants. To be eligible, one must:
- be at least 15 years old
- have entered the United States before age 16
- have continuously resided in the United States since June 15, 2007
- be enrolled in school, have earned a high school diploma or its equivalent, or be an honorably discharged veteran
- have not been convicted of a felony, a significant misdemeanor, or three or more misdemeanors; or otherwise pose a threat to public safety or national security
The Trump administration attempted to terminate DACA in 2017, but multiple court challenges left the program alive, albeit closed to new entrants. The U.S. Supreme Court ruled in June 2020 that rescinding DACA violated federal law, and USCIS briefly began accepting new applications. The Biden administration attempted to revive and expand the program, but ongoing court challenges mean that as of this writing DHS is prohibited from granting DACA requests and accompanying requests for employment authorization made by new applicants.
MPI estimates that as of December 2021, 1.5 million individuals were eligible for DACA under its original rules, 1.2 million of whom were immediately eligible under the program’s age and educational requirements (the rest were eligible aside from the education requirements or were too young but estimated to be eligible once they reached age 15). Between August 15, 2012 (when the government began accepting applications) and December 31, 2021, nearly 835,100 applicants were approved, suggesting this is the maximum number of people who have ever held DACA status during the life of the program. The agency granted 83 percent of the 1 million accepted initial applications; 8 percent (83,600) were denied, and 91,300 remained pending.
Among the 1 million accepted initial applications since the program’s inception, individuals’ top states of residence are California (28 percent), Texas (17 percent), Illinois and New York (5 percent each), and Florida (4 percent). The top five countries of origin of accepted applicants are Mexico (79 percent), El Salvador (4 percent), Guatemala (3 percent), Honduras (2 percent), and South Korea (1 percent).
How many people currently have DACA status?
USCIS reports that 611,470 individuals had active DACA status as of December 31, 2021
The top states of residence for DACA active participants were California (29 percent), Texas (17 percent), and Illinois (5 percent), followed by New York, Florida, Arizona, and North Carolina (about 4 percent each).
The top countries of origin of active DACA program participants were Mexico (81 percent), El Salvador (4 percent), Guatemala (3 percent), Honduras (2 percent), and Peru, South Korea, Brazil, Ecuador, Colombia, and Argentina (about 1 percent each).
- Find USCIS data on DACA applications and approvals.
- View MPI estimates of DACA program participation numbers and the immediately eligible at national and state levels, as well as for top countries of origin.
How many people are covered by Temporary Protected Status?
Since the Immigration Act of 1990, the United States has occasionally granted a form of humanitarian relief called Temporary Protected Status (TPS) when the origin countries of foreign nationals in the United States experience natural disasters, armed conflicts, or other circumstances making return unsafe. TPS offers work authorization and protection from deportation for periods of six months to 18 months. El Salvador was the first country to be designated for TPS in 1990, to protect Salvadorans who had fled its civil war. Since then, more than 20 countries have been designated for TPS.
In 2021, the Biden administration added Myanmar and Venezuela to the list of eligible countries and expanded eligibility for those from Haiti. Certain Liberians and residents of Hong Kong were designated for Deferred Enforced Departure, a similar status offering temporary protection from deportation and work authorization. In March 2022, Ukraine and Afghanistan were also added to the list of TPS countries, and eligibility for those from South Sudan and Sudan was expanded. Collectively, more than 500,000 individuals in the United States are eligible for TPS according to publicly available government estimates as of this writing.
Fourteen countries are currently designated: Afghanistan, El Salvador, Haiti, Honduras, Myanmar (also known as Burma), Nepal, Nicaragua, Somalia, South Sudan, Sudan, Syria, Venezuela, Ukraine, and Yemen. As of March 11, 2021, an estimated 319,000 people had active TPS status, with the largest groups being Salvadorans (198,000), Hondurans (60,000), and Haitians (41,000). By the end of FY 2021, 16,000 Venezuelans had been approved for TPS and more than 204,000 applications were pending.
Certain Liberians and residents of Hong Kong have also been designated for Deferred Enforced Departure, a similar status offering temporary protection from deportation and work authorization.
- Read more about the TPS program in the Migration Information Source article “Temporary Protected Status in the United States: A Grant of Humanitarian Relief that Is Less than Permanent.”
- View an overview of the TPS program from the Congressional Research Service.
Immigration Enforcement
How many times are unauthorized immigrants stopped at the border each year?
U.S. Customs and Border Protection (CBP) reported nearly 1.8 million enforcement encounters at both the southern and northern borders in FY 2021, a major increase from 490,000 a year earlier, when the pandemic suppressed movement around the world. The vast majority of these FY 2021 encounters (1.7 million) were at the U.S.-Mexico border. (The term encounters is a recent one used by CBP, reflecting both apprehensions and expulsions.)
Enforcement encounters at the Southwest border increased significantly starting in March 2021, in response to factors including the change in presidential administrations and uneven economic impacts of the COVID-19 pandemic. The 1.7 million encounters at the Southwest border in FY 2021 was a record high, well more than triple the 458,000 encounters in FY 2020 and 77 percent higher than the 978,000 in FY 2019.
Notably, these figures refer to individual actions, not the number of people who attempted to cross the border without authorization. Use of Title 42 to immediately expel migrants during the COVID-19 pandemic has changed the consequences for individuals caught crossing the border, and many have responded by repeating attempts on multiple occasions, contributing to higher numbers of encounters
How many families and unaccompanied children have been detained at the U.S.-Mexico border?
CBP in FY 2021 made nearly 480,000 encounters of children and adults travelling as families (known as “family units”) and about 147,000 unaccompanied children along the Southwest border. This represents a sixfold increase from the 71,000 family units and 33,000 unaccompanied minors encountered in FY 2020. Including single adults, CBP encountered migrants at the U.S.-Mexico border more than 1.7 million times in FY 2021.
Just a share of encounters led to detention or release into the United States (known as Title 8 apprehensions); among these, figures for family and unaccompanied minors apprehended in FY 2021 remained below FY 2020 levels until February 2021 and below FY 2019 levels until July 2021. The combined 495,000 Title 8 apprehensions of family and unaccompanied minors in FY 2021 were much higher than the 83,000 in FY 2020, but were 19 percent less than the 608,000 that occurred in FY 2019.
Unaccompanied children arrested at the border in FY 2021 were primarily from Guatemala and Honduras, with smaller numbers from Mexico and El Salvador. Families were primarily from Honduras, with smaller numbers from Guatemala, Brazil, and El Salvador.
Note: The term “family unit” refers to individuals—either a child under 18 years old, parent, or legal guardian—apprehended with a family member by the U.S. Border Patrol.
- View the most up-to-date DHS data on apprehensions of unaccompanied children and family units.
- View the most recent DHS statistics on enforcement actions.
How many people are arrested by U.S. Immigration and Customs Enforcement (ICE) within the United States each year?
While the number of CBP border arrests reached a record high in FY 2021, ICE arrests in the interior of the United States declined. ICE agents made approximately 74,100 administrative arrests in FY 2021, down from the 103,600 arrests in FY 2020 and 143,100 in FY 2019. ICE has attributed the drop to a change in focus during COVID-19. An administrative arrest is the arrest of an individual for a civil violation of U.S. immigration law, which is subsequently adjudicated by an immigration judge or through other administrative processes.
How many people are deported per year?
ICE removed 59,000 foreign citizens in FY 2021, which continued a decline from nearly 186,000 removals and returns in FY 2020 and 267,300 in FY 2019.
CBP had not reported FY 2021 data as of this writing, but in FY 2020 CBP and ICE collectively reported more than 406,000 removals and returns. Of these, 221,000 were carried out by CBP, which was 17 percent less than the 264,100 in FY 2019.
- For more information, see FY 2021 ICE Enforcement and Removal Operations Report.
Note: Removals and returns, which are carried out both by ICE and CBP, result in the confirmed movement of inadmissible or deportable aliens out of the United States. Title 42 expulsions carried out at the border are not included in these numbers.
Naturalization Trends
How many immigrants are naturalized citizens?
In FY 2019, 23.2 million immigrants were naturalized U.S. citizens, accounting for approximately 52 percent of all 44.9 million immigrants and 7 percent of the total U.S. population (328.2 million), according to ACS estimates.
Of these 23.2 million naturalized citizens, 32 percent were naturalized between FY 2010 and 2019, 28 percent between FY 2000 and 2009, and 39 percent prior to FY 2000.
How many immigrants become U.S. citizens annually?
USCIS naturalized about 628,0000 green-card holders in FY 2020, a 26 percent decrease from the 844,000 in FY 2019. Meanwhile, the 968,000 petitions for naturalization filed in FY 2020 was nearly 17 percent more than the 831,000 a year earlier. At the same time, the number of denied petitions decreased by nearly 18 percent, from 98,000 in FY 2019 to 81,000 in FY 2020.
USCIS is taking longer to process naturalization applications, with average processing times increasing from 5.6 months in FY 2016 to 9.1 months in FY 2020 to 11.7 months as of the end of January 2022.
From a historical perspective, naturalizations have increased dramatically in recent decades. On average, fewer than 120,000 LPRs became citizens each year between FY 1950 and FY 1969, 150,000 in the 1970s, 210,000 in the 1980s, 500,000 in the 1990s, 680,000 during the 2000s, and 721,000 between 2010 and 2020.
Naturalizations reached an all-time high in FY 2008, increasing 59 percent from 660,000 the prior year to 1,047,000. This came as a result of impending application fee increases and the promotion of U.S. citizenship in advance of the 2008 presidential election.
- For more historical data on naturalization, see the Naturalization in the United States, 1910-Present data tool.
- Find more sociodemographic information in the article “Naturalized Citizens in the United States.”
- Understand the challenges to naturalization with the MPI report A Rockier Road to U.S. Citizenship? Findings of a Survey on Changing Naturalization Procedures.
- For more information on USCIS processing times, see Historical National Average Processing Time for All USCIS Offices.
How many foreign nationals become U.S. citizens through military naturalization?
In FY 2020, 2,600 foreign-born military personnel became U.S. citizens, a 31 percent drop from FY 2019 (3,800) and the fewest since FY 2002.
- For more information on the foreign born in the U.S. military, see Noncitizens in the U.S. Military: Navigating National Security Concerns and Recruitment Needs.
Where are newly naturalized citizens from?
Of the new U.S. citizens in FY 2020, 13 percent were born in Mexico, 8 percent in India, and 5 percent each in the Philippines and Cuba (see Table 6). Immigrants from these four countries, together with those from China, Vietnam, the Dominican Republic, Jamaica, Colombia, and El Salvador accounted for 48 percent of the 628,000 new U.S. citizens that fiscal year.
Table 6. Top Ten Countries of Origin of Newly Naturalized Citizens, FY 2020
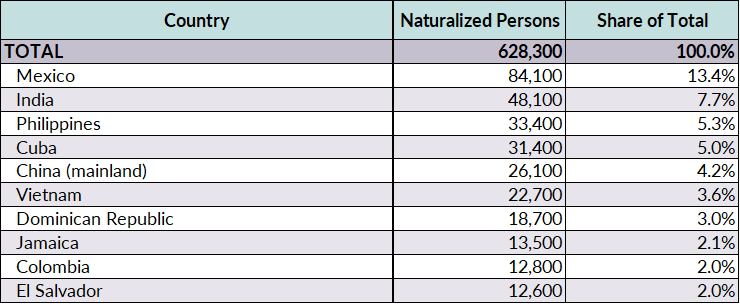
Source: DHS Office of Immigration Statistics, 2020 Yearbook of Immigration Statistics.
Where in the United States do newly naturalized citizens live?
Nearly 54 percent of people naturalized as citizens in FY 2020 lived in one of five states: California (18 percent, or 113,000 individuals); Florida (13 percent, or 79,000); Texas (11 percent, or 67,000); New York (9 percent, or 56,000); and New Jersey (4 percent, or 22,000).
The top metropolitan areas with the largest number of new naturalizations were New York-Newark-Jersey City (69,000), Miami-Ft Lauderdale-Pompano Beach (53,000), Los Angeles-Long Beach-Anaheim (43,000), Washington-Arlington-Alexandria (26,000), and San Francisco-Oakland-Berkeley (23,000). These five metro areas were the residences for 34 percent of all naturalizations in FY 2020.
How many green-card holders are eligible to naturalize?
According to the latest available DHS estimates, about 9.1 million of the 13.6 million green-card holders residing in the United States on January 1, 2019 were eligible to become naturalized citizens based on how long they had held LPR status.
- For more information, see Estimates of the Lawful Permanent Resident Population.
How long does it take on average for green-card holders to naturalize?
On average, immigrants who became U.S. citizens in FY 2020 had previously held green cards for about seven years, a decrease from an average of eight years in FY 2019. The time varied by region of origin: immigrants born in Africa and Asia spent an average six years in LPR status before naturalization, those born in South America spent an average of seven years in that status, Europeans spent an average of eight years, and new citizens from Oceania and North America (including Central America) each spent an average of ten years with a green card.
In general, the requirements for naturalization are being at least 18 years of age, passing English and civic exams, and for most applicants, residing in the United States with LPR status continuously for at least five years (three years for those married to a U.S. citizen).
- For more information, see DHS Annual Flow Reports.
- Read the USCIS Naturalization Eligibility Requirements.
Naturalization Rates
The number of green-card holders who naturalize every year depends on many factors, including the number of people who are eligible, application processing times, and stringency and length of background checks. This number can also be affected by barriers to naturalize, such as high application fees, as well as personal motivations. For instance, green-card holders from mainland China may be less inclined to become U.S. citizens because China prohibits dual citizenship, whereas immigrants from countries that allow dual citizenship may have greater incentive.
The share of green-card holders who naturalize within a certain time period, such as within ten years of receiving a green card, varies by LPRs’ country and region of birth and class of admission. This is known as a naturalization rate.
Overall, 53 percent of the immigrant cohort who became LPRs in FY 2008 naturalized by FY 2018. A ten-year naturalization rate was the highest for those born in Africa (76 percent) and South America (64 percent) and the lowest for LPRs from North America, including Mexico and Canada (27 percent). The ten-year naturalization rate was nearly 70 percent for Indian-born green-card holders, 60 percent for those from the Philippines, 52 percent for Cubans, 44 percent for LPRs from China, and 27 percent for Mexicans.
In terms of classes of admission, approximately 68 percent of humanitarian migrants and employment-based green-card holders who became LPRs in FY 2008 had become naturalized citizens by FY 2018. Ten-year naturalization rates were lower for those who were immediate relatives of U.S. citizens or other family members of U.S. citizens and LPRs (about 47 percent each).
- For more information, read the DHS report Trends in Naturalization Rates: FY 2018 Update Report.
Visa Backlogs
How many visa applications for permanent immigration (green cards) are backlogged?
Because of limits on certain visa categories and per-country caps, the U.S. government in some cases is still processing applications that are more than two decades old. In March 2022, the State Department was processing some family-sponsored visa applications dating to September 1997, and employment-related visa applications from January 2012.
According to data on petitions submitted to the State Department, more than 4.1 million applicants (including spouses and minor children) were on the waiting list as of November 1, 2021, a 4 percent increase from the same point in 2020 (when there were just under 4 million applicants).
The overwhelming majority of backlogs were among family-sponsored applicants (nearly 4 million, which includes the principal applicant and their immediate family members). About 172,000 backlogged applicants were for employment-sponsored channels and their families.
Of the overall 4.1 million applicants, 1.2 million were citizens of Mexico, followed by those from the Philippines (309,000), India (303,000), the Dominican Republic (275,000), and mainland China (239,000). Family- and employment-based prospective immigrants who are waiting to adjust their status to lawful permanent residence from within the United States are not included in the State Department estimates.
USCIS also publishes backlog statistics, but only for petitions approved in one of the five employment-based categories. As of April 2021 (the latest available as of this writing), approximately 481,000 approved employment-based immigrant petitions were awaiting a priority date. This figure corresponds to the number of primary applicants covered by these petitions but excludes their dependents. To MPI’s knowledge, USCIS has not published backlog statistics on other types of green-card applications the agency adjudicates.
In other words, the overall number of people waiting for a green card—within and outside of the United States—is likely to be larger than the 4.1 million reported by the State Department (as of November 2021) and 481,000 reported by USCIS (as of April 2021).
- For more details about wait times by immigration category and country of origin, see the State Department’s Visa Bulletin.
- Get more information about capped employment- and family-based preference categories with MPI’s Explainer: How the U.S. Legal Immigration System Works.
- For more on the impact of immigration backlogs during the COVID-19 pandemic, read the U.S. Policy Beat article “Mounting Backlogs Undermine U.S. Immigration System and Impede Biden Policy Changes.”
- Read Going to the Back of the Line: A Primer on Lines, Visa Categories, and Wait Times for more on the green-card backlog.
- Read the National Visa Center annual report on immigrant visa waiting list and view USCIS employment-based immigrant petition backlog data.