

Immigrant Health-Care Workers in the United States

In 2015 there were 2.1 million foreign-born health care workers in the United States, comprising 17 percent of the health care labor force. (Photo: Shutterstock)
With health-care reform high on the legislative agenda and the implications of immigration policy changes on particular populations in the news, the role of the foreign born in medical occupations has become a topic of intense interest. Immigrants represent a significant slice of this labor force, comprising almost 17 percent of the 12.4 million people in the United States working as doctors, nurses, dentists, and in other health-care occupations in 2015.
Although health care as a sector accounts for just 8 percent of total U.S. employment, these occupations are among the fastest-growing, due in part to the aging of the U.S. population. Health care is projected to add 2.3 million jobs between 2014 and 2024, according to the U.S. Bureau of Labor Statistics (BLS). The number of foreign-born health-care workers has risen significantly, from 1.5 million in 2006 to 2.1 million in 2015. The immigrant share is highest among highly skilled professionals such as physicians and surgeons (28 percent) and the least skilled direct-care workers such as nursing, psychiatric, and home health aides (24 percent).
Although the characteristics of health-care workers varied across seven occupational categories that make up this sector, as a group foreign-born health-care workers were more likely than their native-born counterparts to have obtained a university-level education. Immigrant women in the industry were more likely than natives to work in direct care, the occupations known for low wages and lower access to health insurance. In contrast, immigrant men were more likely than the U.S. born to be physician and surgeons, occupations that are well-compensated and come with near-universal health insurance access. Compared to all foreign-born workers, those employed in the health-care field were more likely to speak English fluently and had higher rates of naturalization and health insurance coverage.
This Spotlight provides a demographic and socioeconomic profile of foreign-born health-care workers residing in the United States. The data come primarily from the U.S. Census Bureau's 2015 American Community Survey (ACS) and the U.S. Bureau of Labor Statistics. All data refer to employed civilians ages 16 and older unless otherwise noted.
- Historical Trends and Projections
- Number and Share Nationally and by State
- Region and Country of Birth
- Education, Naturalization, and Language Proficiency
- Visa Pathways
- Health Insurance Coverage
Historical Trends and Projections
Health-care occupations employed about 12.4 million workers in 2015, up from 12 million in 2010. These occupations are projected to account for 2.3 million of the 9.8 million newly created jobs in the United States between 2014 and 2024, or about one in four new jobs.
Jobs in this group fall into two broad categories: health-care practitioners and technical occupations (8.8 million workers in 2015), and health-care support occupations (3.6 million). Health-care support occupations are expected to grow the fastest among the 22 broad workforce-wide occupational groups analyzed by the Bureau of Labor Statistics (BLS), projected to increase by 23 percent between 2014 and 2024, followed by health-care practitioners and technical occupations (16 percent).
Occupations that grow fast tend to experience labor shortages, at least in the near term. An analysis earlier this year by the Committee for Economic Development estimated that health-care occupations will have the highest risk of labor shortages. Three occupations in particular—occupational and physical therapy assistants and aides; physicians and surgeons; and registered nurses—were projected to be hardest hit during the next decade.
A number of factors make it difficult to meet the rising demand in the health-care sector. One is changing demographics, such as aging of the U.S. population and retirement of those who provide services or train health-care workers. Other factors reflect the nature of health-care services: Most jobs require in-person services delivered in a particular location, which limits the potential for automation and telework. In addition, many health-care professionals must complete a lengthy training period and obtain licenses to practice, making it harder to switch between fields in response to new job openings. Recruitment of foreign-born health-care workers is often considered one of the solutions to address labor shortages in health care, particularly in disadvantaged regions.
- Click here for more information about BLS employment projections methodology.
Number and Share Nationally and by State
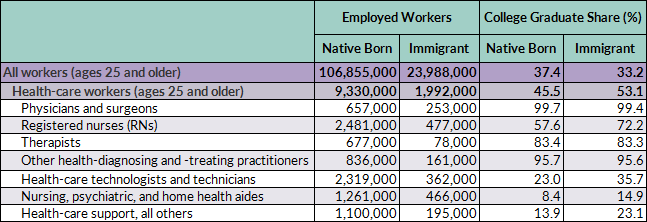
Among the 12.4 million workers employed in health-care occupations in 2015, 2.1 million (17 percent, or about one in six) were foreign born. The immigrant share of health-care workers was roughly the same as that of all employed civilian workers ages 16 and over (see Table 1).
Relative to their share of the total workforce, immigrants were over-represented among both high- and low-skilled health-care workers. The foreign born accounted for 28 percent of the 910,000 physicians and surgeons practicing in the United States, and 24 percent of the 2.1 million nursing, psychiatric, and home health aides (see Table 1).
Table 1. All Civilian Employed Workers (ages 16 and older) and Health-Care Subset, by Occupational Group and Nativity, 2015
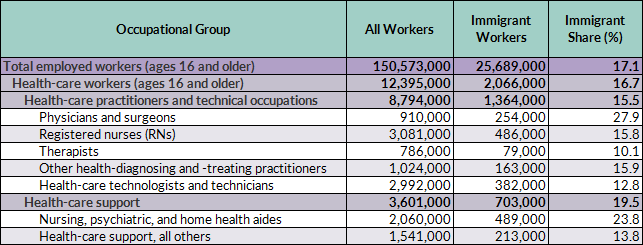
Source: Migration Policy Institute (MPI) tabulation of data from the U.S. Census Bureau 2015 American Community Survey (ACS).
The immigrant share of the health-care workforce was roughly twice the national level in three states: New York (37 percent), California (33 percent), and New Jersey (32 percent), as well as the District of Columbia (37 percent). Other states with high shares were Florida (28 percent), Maryland (24 percent), and Massachusetts (21 percent).
In a number of states, immigrants made up much higher shares of medical doctors and other health practitioners than of all health-care workers or all workers in general. In Michigan, for example, while immigrants accounted for just 8 percent of all workers and 9 percent of health-care workers, their share was twice as high (20 percent) among doctors. Other states that have a relatively low share of immigrant workers overall while relying heavily on foreign-born doctors include Maryland (29 percent of doctors), New Hampshire (17 percent), Indiana (16 percent), Missouri (15 percent), and West Virginia (13 percent).
State-Level Data on Immigrant Health-Care Workers
Click here to access detailed information on the immigrant share among health-care workers overall and by occupation for all 50 states.
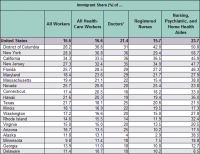
In several states, immigrants accounted for large shares of low-skilled health-care workers such as nursing, psychiatric, and home health aides. New York had the highest share, with 59 percent, followed by the District of Columbia and New Jersey, where approximately half of home health aides were foreign born.
Notably, while the share of all foreign-born health workers in Alaska was below the national average (13 percent compared to 17 percent), more than one-third (38 percent) of nursing, psychiatric, and home health aides in the state were foreign born—the sixth highest of all states in the nation.
Note: In this analysis the term "doctors and other health practitioners" includes physicians, surgeons, dentists, optometrists, podiatrists, veterinarians, physician assistants, nurse anesthetists, nurse practitioners, and nurse midwives.
In 2015, foreign-born women employed in health-care occupations were most likely to work as nursing, psychiatric, or home health aides (28 percent) or as registered nurses (27 percent). In contrast, their male counterparts were most likely to work as physicians and surgeons (30 percent), or as technologists and technicians (20 percent; see Table 2).
Table 2. Occupational Distribution of Civilian Employed Health-Care Workers (ages 16 and older), by Nativity and Sex, 2015
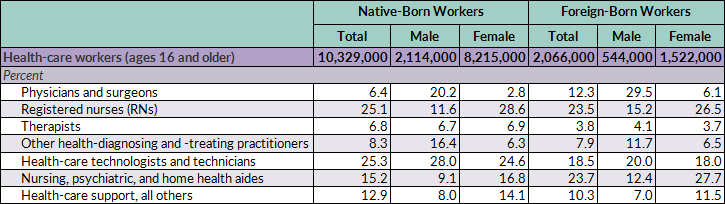
Source: MPI tabulation of data from the U.S. Census Bureau 2015 ACS.
Both immigrant men and women employed in health-care occupations in 2015 were more likely than the native born to work as physicians and surgeons: Thirty percent and 6 percent of foreign-born men and women employed in health care, respectively, worked in these professions, compared to 20 percent and 3 percent of native-born men and women. Regardless of nativity, however, men were still considerably more likely than women to work as physicians and surgeons.
Foreign-born health-care workers overall were also more likely than their native-born peers to work as nursing, psychiatric, or home health aides: For the foreign born, 28 percent of women and 12 percent of men worked in this occupational group, compared to 17 percent and 9 percent of U.S.-born women and men respectively.
Regardless of nativity, most health-care occupations rely on female workers. Women accounted for 74 percent of the 2.1 million foreign-born health-care workers in 2015. Among the native born, this share was even higher: 80 percent. Women represented the lion’s share of both foreign- and native-born registered nurses (83 percent and 91 percent, respectively). Similarly, both foreign- and native-born women accounted for approximately 86-88 percent of low-skilled and low-paid nursing, psychiatric, and home health aides. In contrast, 37 percent of foreign-born physicians and surgeons were women, compared to 35 percent of those who were native born.
Asia was the leading region of birth of foreign-born workers employed in health care in 2015, with 42 percent, followed by Latin America (18 percent); the Caribbean (16 percent); Northern America (Canada and Bermuda), Europe, and Oceania (12 percent collectively); and Africa (12 percent).
Asian-born health-care workers and those from Northern America, Europe, and Oceania were more likely than their counterparts from other regions to work as physicians and surgeons and, along with those born in Africa, as registered nurses (see Figure 1). In contrast, those from the Caribbean were more likely to work as nursing, psychiatric, or home health aides, with 48 percent in these jobs. One-third of African immigrants and 30 percent of Latin American immigrants in the health-care industry also reported working as nursing, psychiatric, or home health aides.
Figure 1. Foreign-Born Civilian Employed Health-Care Workers (ages 16 and older), by Region of Birth and Occupational Group, 2015
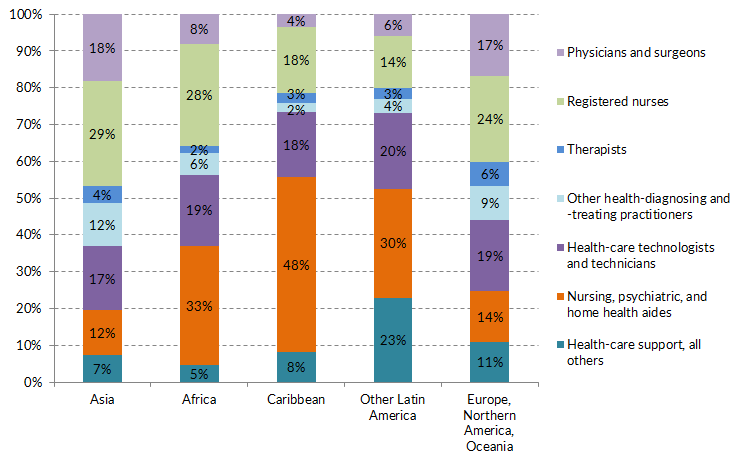
Note: “Other Latin America” includes Mexico, Central America, and South America. “Northern America” includes Canada and Bermuda. Other and unspecified countries and regions of birth were not included due to a small sample size. The term “Other Health-Diagnosing and -Treating Practitioners” includes dentists and physician assistants, among other occupations.
Source: MPI tabulation of data from the U.S. Census Bureau 2015 ACS.
Immigrants from the Philippines accounted for nearly 30 percent of the 486,000 immigrants working as registered nurses, followed by those from India (6 percent) and Nigeria (5 percent). Among the 254,000 immigrant physicians and surgeons, Indians were the top group with 22 percent, followed by those from China (5 percent) and the Philippines (4 percent). In contrast, Mexicans, Haitians, and Jamaicans together accounted for 31 percent of the 489,000 foreign-born nursing, psychiatric, and home health aides.
Education, Naturalization, and Language Proficiency
Foreign-born workers ages 25 and older in health-care occupations were more likely than their native-born counterparts to have obtained a bachelor’s degree or higher—53 percent, compared to 46 percent. This nativity gap in degree attainment was widest for health-care workers employed as registered nurses, health-care technologists and technicians, and "other" health-care support occupations (see Table 3).
Table 3. Educational Attainment for Overall Civilian Employed Population (ages 25 and older) and Health-Care Subset, by Occupational Group and Nativity, 2015
Source: MPI tabulation of data from the U.S. Census Bureau 2015 ACS.
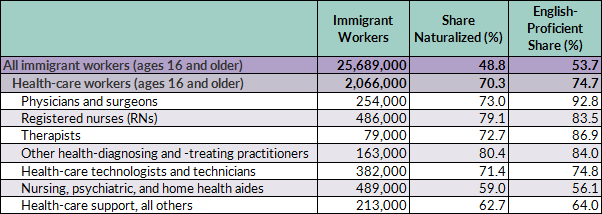
Foreign-born health-care workers were also more likely to be naturalized citizens. About 70 percent were naturalized U.S. citizens, compared to 49 percent of all foreign-born civilians ages 16 and older employed in the United States.
A majority of foreign-born workers in each of the seven health-care occupational groups were U.S. citizens. However, the share varied by occupation, ranging from 59 percent for those working as nursing, psychiatric, and home health aides, to 73 percent for physicians and surgeons and therapists, and about 80 percent for registered nurses and "other" health-care practitioners and technical occupations (see Table 4).
Table 4. Naturalization Rate and English Proficiency of Foreign-Born Health-Care Workers (ages 16 and older), by Occupational Group, 2015
Note: English proficient refers to persons who reported speaking English exclusively or "very well."
Source: MPI tabulation of data from the U.S. Census Bureau 2015 ACS.
Approximately 75 percent of foreign-born health-care workers reported speaking English proficiently, meaning exclusively or "very well." The proficiency rate for civilian employed foreign-born workers overall was about 54 percent (see Table 4).
Majorities of immigrants in the seven occupational groups reported speaking English proficiently, with proficiency rates ranging from 56 percent for nursing, psychiatric, and home health aides; to 93 percent for physicians and surgeons.
Foreign-born health-care workers are admitted to the United States under a variety of temporary and permanent visa categories. Temporary visa categories include H-1B (specialty occupations), H-2B (nonagricultural workers), H-3 (trainees), TN (Mexican and Canadian professionals under the North American Free Trade Agreement [NAFTA]), J-1 (exchange visitors), and O-1 (persons with "extraordinary ability or achievement"). As is the case with other immigrants, those in the health-care sector can be admitted through permanent immigration channels (i.e., getting a green card) based on family or employment connections, or through humanitarian protection routes.
It is hard to assess how many foreign health professionals arrive annually, whether via temporary or permanent visa channels, because for the most part visa data are not broken down by occupation. Since most occupations in health care require a professional license, relatively few foreigners meet the requirement unless they obtain a U.S. degree and complete the necessary postgraduate training first. Some doctors with foreign degrees are able to apply for a J-1 visa to complete a medical residency in the United States.
Despite the key role immigrants play in providing health-care services, the U.S. immigration system does not prioritize attracting foreign-born health-care professionals. Just 4 percent (or 4,645) of the 113,603 H-1B petitions approved for initial employment in fiscal year (FY) 2015 went to workers in health-care and medicine occupations, according to Department of Homeland Security (DHS) data. The majority of annual H-1B petitions (62 percent in FY 2015) go to workers in computer-related occupations.
Most workers employed in health-care occupations had health insurance in 2015, regardless of their occupation or nativity. A far greater share of immigrant workers in non-health-care occupations lacked coverage, compared to health-care workers: 24 percent versus 8 percent, respectively.
While the coverage rate was close to universal for physicians and surgeons regardless of nativity, about 13 percent of both foreign- and U.S.-born nursing, psychiatric, and home health aides lacked health insurance. Among other health-care support professionals, 9 percent of the native born and 12 percent of the foreign born lacked health insurance.
Sources
Committee for Economic Development (CED). 2017. Immigration Policy That Works – Bringing Foreign-Born Workers into High-Shortage Occupations to Grow Our Economy. Arlington, VA: CED. Available online.
Levanon, Gad and Ben Cheng. 2014. Occupations Most At Risk of Labor Shortages in the Next Decade. Blog post, the Conference Board, April 7, 2014. Available online.
U.S. Census Bureau. 2015 American Community Survey. Accessed from Steven Ruggles, J. Trent Alexander, Katie Genadek, Ronald Goeken, Matthew B. Schroeder, and Matthew Sobek. Integrated Public Use Microdata Series: Version 5.0 [Machine-readable database]. Minneapolis: University of Minnesota, 2010. Available online.
U.S. Citizenship and Immigration Services (USCIS). 2011. Temporary (Nonimmigrant) Workers. Updated September 7, 2011. Available online.
---. 2016. Characteristics of H-1B Specialty Occupation Workers. Washington, DC: USCIS. Available online.
U.S. Department of Labor Bureau of Labor Statistics. 2015. Economic and Employment Projections – Employment Projections: 2014-24. News release, December 8, 2015. Available online.