

Immigrant Veterans in the United States in 2016

A group of immigrants serving in the armed forces become citizens at a naturalization ceremony in New York. (Photo: Sgt. Randall A. Clinton/Marine Corps)
Approximately 511,000 foreign-born veterans of the U.S. armed forces resided in the United States in 2016, accounting for 3 percent of the 18.8 million veterans nationwide. Of that number, 1.5 million were U.S. born with a parent who was an immigrant. While the share of veterans who are foreign born is much lower than the immigrant share of the overall population (14 percent), veterans with an immigrant parent composed a larger share than the first generation (8 percent). Together, approximately 2 million veterans (11 percent of all veterans) were from an immigrant background.
Naturalized citizens, lawful permanent residents, and certain nationals of three countries in free association with the United States—the Marshall Islands, the Federated States of Micronesia, and Palau—are all eligible for military service. In addition, Congress can deem other foreign-born individuals eligible to serve if the secretary of a specific military branch "determines that such enlistment is vital to the national interest."
Immigrants have always served in the U.S. armed forces. In the past, their presence was particularly high: The foreign born represented half of all military recruits by the 1840s and 20 percent of the 1.5 million service members in the Union Army during the Civil War, according to U.S. Citizenship and Immigration Services (USCIS).
Using data from the U.S. Census Bureau (the 2016 Annual Social and Economic Supplement [ASEC] of the Current Population Survey [CPS] and the 2014 American Community Survey [ACS]), this Spotlight provides information on the population of immigrant veterans (ages 17 and older) in the United States, focusing on its size, top countries of origin, racial and ethnic composition, and socioeconomic characteristics. It is important to note that the Census Bureau data come from household-based surveys and are thus likely to undercount people who are homeless.
- Historical Trends
- Country of Birth
- Citizenship
- Race and Ethnicity
- English Proficiency
- Gender and Marital Status
- Age, Education, and Employment
- Income and Poverty
- Health Insurance Coverage
Over the past decade, the total number of veterans has declined from 26.1 million in 1995 to 18.8 million in 2016. Most of the drop was attributable to the declining number of native-born veterans; the number of veterans who are immigrants has remained stable. As a result, the immigrant share increased slightly from 2 percent of all veterans in 1995 to 3 percent in 2016 (see Figure 1).
Figure 1. Total Number of Veterans and the Immigrant Share (%), 1995-2016
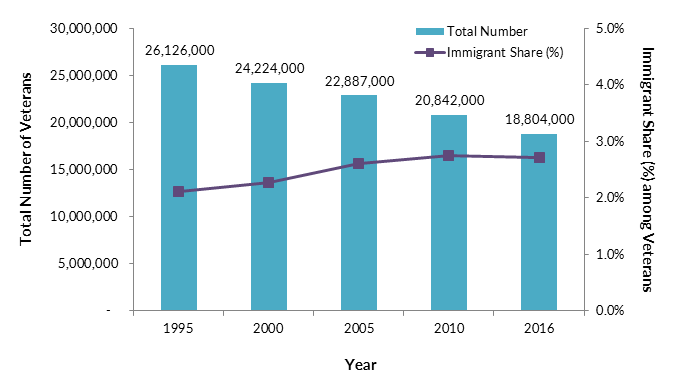
Source: MPI analysis of U.S. Census Bureau 1995, 2000, 2005, 2010, and 2016 Annual Social and Economic Supplement (ASEC) of the Current Population Survey (CPS).
Mexico (83,000) and the Philippines (68,000) were the top two countries of birth for the 511,000 immigrant veterans in 2016, representing 16 percent and 13 percent, respectively. Other major origin countries included Germany (33,000), Canada (31,000), Haiti (17,000), and India (15,000). (See Figure 2.)
Figure 2. Top Ten Countries of Birth of Foreign-Born Veterans, 2016
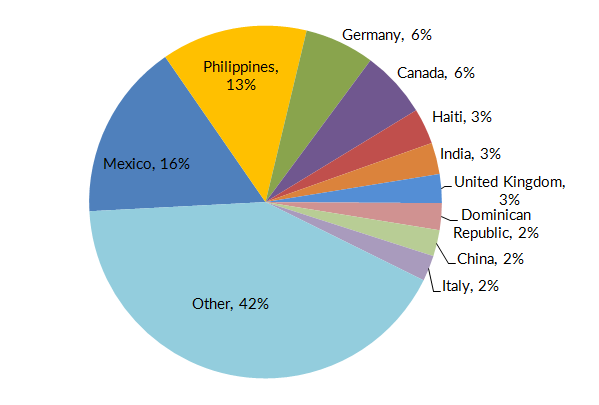
Source: MPI analysis of 2016 CPS ASEC.
In 2016, the vast majority of immigrant veterans were naturalized citizens: 82 percent (417,000 of them).
During times of peace, noncitizen members of the armed forces may obtain citizenship after one year of military service. Section 329 of the Immigration and Nationality Act authorizes the president to issue executive orders specifying periods of conflict during which foreign-born members of the U.S. military are eligible for immediate U.S. citizenship. In a July 2002 executive order, President Bush designated September 11, 2001 as the start day of a period of hostilities, and noncitizen military personnel serving on or after that date became eligible for expedited citizenship. Furthermore, revisions to U.S. citizenship law in 2004 allowed USCIS to conduct naturalization interviews and ceremonies for foreign-born U.S. armed forces members serving at military bases abroad.
Additionally, a program launched in 2009 called Military Accessions Vital to the National Interest (MAVNI) allows certain noncitizens with in-demand skills, particularly in health care and critical languages, to join the Army in exchange for expedited U.S. citizenship. In FY 2016, the MAVNI program planned to recruit up to 5,200 immigrants.
Click here for an interactive data tool showing the annual number of naturalizations (civilian and military) in the United States, from FY 1910-2014.
The racial and ethnic composition of foreign-born veterans was much more diverse than that of U.S.-born veterans. More than half identified as Hispanic or Asian (30 percent and 22 percent, respectively), and 34 percent self-identified as White (see Figure 3). In contrast, approximately 80 percent of U.S.-born veterans self-identified as White, followed by 11 percent as Black, 6 percent as Hispanic, and 1 percent as Asian.
Figure 3. Race and Ethnicity of Foreign- and Native-Born Veteran Populations, 2016
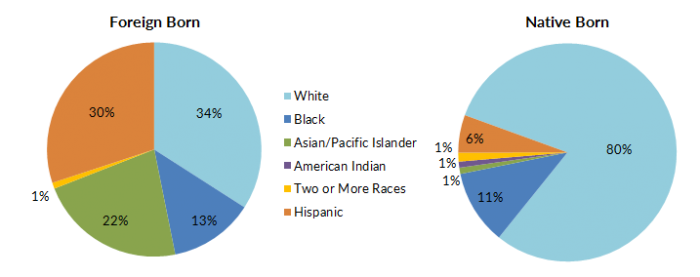
Source: MPI analysis of 2016 CPS ASEC.
Among U.S.-born Hispanic and Asian veterans, significant shares came from immigrant families: 57 percent of native-born Asian veterans and 31 percent of U.S.-born Hispanic veterans had at least one immigrant parent.
English Proficiency and Language Diversity
Compared to the overall immigrant population in the United States, immigrant veterans were much less likely to be Limited English Proficient (LEP). According to the 2014 ACS, the most recent data with information on both English proficiency and veteran status, 21 percent of immigrant veterans were LEP, versus 50 percent of the total foreign-born population.
Note: Limited English proficiency refers to those who indicated on the ACS questionnaire that they spoke English less than “very well.”
In 2014, 38 percent of immigrant veterans reported speaking only English at home. The remainder spoke a wide range of languages, including Spanish (24 percent); Tagalog (9 percent); German (3 percent); Vietnamese, Korean, Chinese, Italian (2 percent each); and French, Arabic, and Polish (1 percent each).
Click here for an interactive data tool displaying the top language spoken by LEP U.S. residents.
Although the overall presence of women in the armed forces, and subsequently in the veteran population, has historically been low, women accounted for a somewhat higher share among immigrant veterans than the native born. In 2016, approximately 11 percent of foreign-born veterans were female, compared to 8 percent of native-born veterans.
Immigrant veterans were also more likely to be married and less likely to be divorced compared to native-born veterans, reflecting a similar pattern among immigrant and native-born nonveterans. As of 2016, 73 percent of immigrant veterans were married, versus 65 percent of native veterans. Approximately 7 percent of foreign-born veterans were divorced, compared to 15 percent of U.S.-born veterans.
Age, Education, and Employment
Among veterans, immigrants are slightly younger than the native born. In 2016, the average age of foreign-born veterans was 58 years old, compared to 62 years old for those born in the United States.
In general, immigrant veterans (ages 25 and older) have higher educational attainment compared to their U.S.-born counterparts: They were more likely to be college graduates and less likely to be high school dropouts. Immigrant veterans were also more educated than the nonveteran immigrant population. As of 2016, approximately 36 percent of immigrant veterans had at least a bachelor’s degree compared to 29 percent of native-born veterans. About 31 percent of native-born veterans have a high school diploma or equivalent as their final degree, compared to 21 percent of foreign-born veterans (see Figure 4). In contrast, among nonveterans, immigrants were much more likely than the native born to have not finished high school and less likely to have a college education.
Figure 4. Educational Attainment of Adults (ages 25 and Older) by Veteran Status and Nativity, 2016
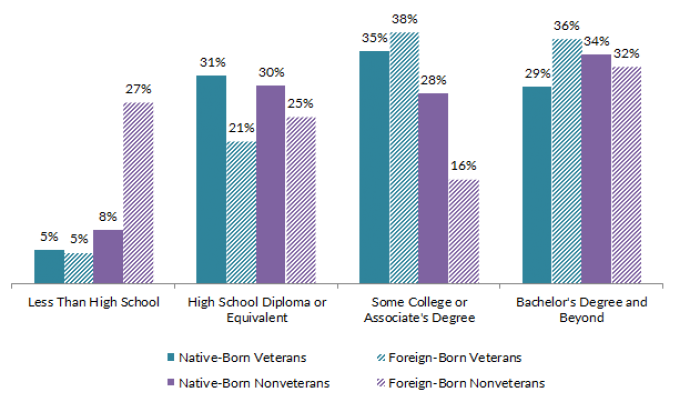
Source: MPI analysis of 2016 CPS ASEC.
Immigrant veterans participate in the civilian labor force at a higher rate than their U.S.-born counterparts. Less than half (47 percent) of U.S.-born veterans were in the civilian labor force in 2016, compared to 61 percent of immigrant veterans, though this rate was lower than for the U.S.- and foreign-born nonveteran populations (65 percent and 66 percent, respectively).
Among those in the civilian labor force, unemployment rates for veterans and nonveterans, regardless of immigration status, were essentially the same, at about 5 percent.
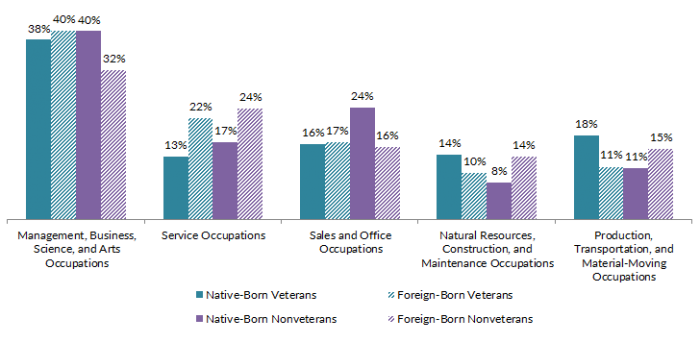
Overall, the occupational distribution of employed veterans largely resembled that of the nonveteran population. Both native- and foreign-born veterans were less likely to be in service occupations. Consistent with their higher levels of educational attainment, immigrant veterans were slightly more likely to be in management, business, science, and arts occupations (40 percent) than native veterans (38 percent, see Figure 5) and less likely to be employed in production, transportation, and material moving occupations (11 percent versus 18 percent).
Click here for an interactive data tool showing immigrants as a share of the total population and the civilian labor force over time.
Figure 5. Occupation of Employed Workers (ages 17 and Older) by Veteran Status and Nativity, 2016
Source: MPI analysis of 2016 CPS ASEC.
Households headed by immigrant veterans have higher incomes than those headed by native-born veterans. In 2016, immigrant veterans had an average $102,000 household income, compared to $78,000 for native-born veteran households. For comparison, the average household incomes for native- and foreign-born nonveterans were roughly similar, at $79,000 and $78,000, respectively.
Regardless of their nativity, veterans were much less likely than nonveterans to be in poverty. In 2016, 7 percent of both foreign- and U.S.-born veterans lived in poverty, compared to 16 percent and 11 percent respectively for foreign- and native-born nonveterans. Because the Census Bureau data are collected on households, its surveys are likely to undercount homeless veterans. The U.S. Department of Housing and Urban Development (HUD) estimates that approximately 39,000 veterans were homeless on any given night in 2016.
In 2016, the overwhelming majority of veterans, regardless of their nativity, were covered by at least one type of health insurance (see Figure 6). In addition to Medicaid and Medicare, which are available to eligible populations regardless of veteran status, public health insurance options for veterans include TRICARE, the Civilian Health and Medical Program of the Department of Veteran's Affairs (CHAMPVA), and others. In 2016, 47 percent of foreign-born veterans and 38 percent of native-born veterans with public coverage were covered by military health care programs.
Uninsured rates among veterans—4 percent for natives and 2 percent for immigrants—were extremely low compared to the nonveteran population.
Figure 6. Health Coverage for Adults (ages 17 and Older), by Veteran Status and Nativity, 2016
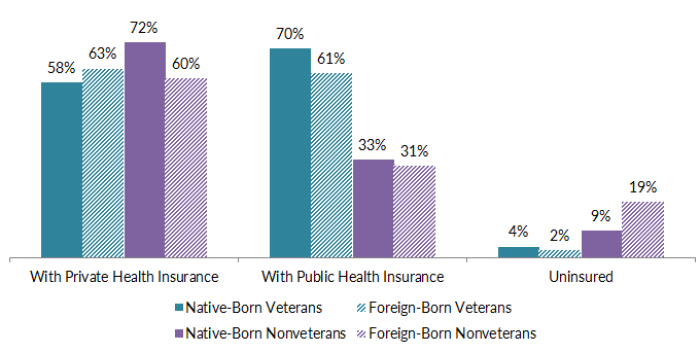
Note: The sum of shares by type of insurance is likely to be greater than 100 because people may have more than one type of insurance.
Source: MPI analysis of 2016 CPS ASEC.
Sources
U.S. Census Bureau. 2016. 2014 American Community Survey. Accessed from Steven Ruggles, Katie Genadek, Ronald Goeken, Josiah Grover, and Matthew Sobek. Integrated Public Use Microdata Series: Version 6.0 [Machine-readable database]. Minneapolis: University of Minnesota, 2016. Available Online.
---. 2016. 2016 Current Population Survey Annual Social and Economic Supplement. Accessed from Sarah Flood, Miriam King, Steven Ruggles, and J. Robert Warren. Integrated Public Use Microdata Series, Current Population Survey: Version 4.0. [Machine-readable database]. Minneapolis: University of Minnesota, 2015. Available Online.
U.S. Department of Defense. N.d. Fact Sheet: Military Accessions Vital to National Interest (MAVNI) Recruitment Pilot Program. Washington, DC: Department of Defense. Accessed October 11, 2016. Available Online.
U.S. Department of Housing and Urban Development (HUD). 2016. 2016 PIT Estimate of Homeless Veterans by State. Washington, DC: HUD. Available Online.