

Immigrants from the Dominican Republic in the United States

Andra Mihali
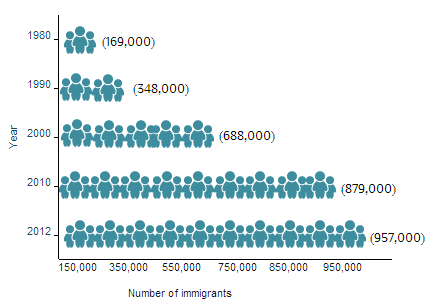
Large-scale migration from the Dominican Republic to the United States began in the 1960s, in the wake of economic and political turbulence that occurred after dictator Rafael Trujillo was killed by rebels in 1961 and the U.S. military and other government agencies intervened. The Dominican immigrant population in the United States, which stood at 12,000 in 1960, grew rapidly after that: reaching 350,000 in 1990 and 879,000 in 2010.
In 2012, 960,000 immigrants from the Dominican Republic resided in the United States, constituting 2 percent of the total U.S. foreign-born population of 40.8 million. Historically, immigration from the Dominican Republic to the United States has been dominated by women. Between 1970 and 2012, about 56 percent of all Dominican immigrants residing in the United States were female. People of Dominican origin or ancestry represent the fifth-largest Hispanic group in the United States (or 3 percent of the 52.9 million Hispanics), following Mexicans, Puerto Ricans, Cubans, and Salvadorans.
|
Figure 1. Dominican Immigrant Population in the United States, 1980-2012
|
|
Source: Data from U.S. Census Bureau 2006, 2010, and 2012 American Community Surveys (ACS), and 1980, 1990, and 2000 Decennial Census. |
Since 1990 the immigrant population from the Dominican Republic residing in the United States has been larger than other immigrant populations from the Caribbean, with the exception of immigrants from Cuba. Click here to view how the number of immigrants from the Dominican Republic and other countries has changed over time.
The vast majority of immigrants from the Dominican Republic are in the United States, with much smaller populations also residing in Italy (40,000) and Spain (14,000). Click here to see where immigrants from the Dominican Republic have settled internationally.
|
Definitions
|
|
|
Nearly all immigrants from the Dominican Republic obtain lawful permanent residence in the United States (also known as getting a “green card”) through family reunification, whereas very few come through employment channels. For the most part, immigration from the Dominican Republic is legal. The number of Dominican beneficiaries of the Deferred Action for Childhood Arrivals (DACA) program is relatively small. However, many of those who applied have obtained approval. Between August 15, 2012 and March 31, 2014, approximately 2,670 DACA-eligible unauthorized youth from the Dominican Republic had applied for temporary reprieve from deportation under the program, and more than 80 percent of accepted applications have been approved.
Immigrants from the Dominican Republic were more likely than the overall foreign-born population in the United States to live in poverty, be Limited English Proficient, and have gained U.S. citizenship; they were less likely to have a college degree or to be uninsured.
Employing the most recent data available from the U.S. Census Bureau’s American Community Survey (ACS) and the U.S. Department of Homeland Security (DHS), this Spotlight provides information on Dominican immigrants, examining the size of the population, geographic distribution, and socioeconomic characteristics. The article also uses World Bank data to highlight remittances trends.
Click on the bullet points below for more information:
- Distribution by State and Key Cities
- English Proficiency
- Educational and Professional Attainment
- Income and Poverty
- Immigration Pathways and Naturalization
- Health Coverage
- Diaspora
- Remittances
Dominican immigrants in the United States were most concentrated in New York, New Jersey, and Florida. These three states were home to 75 percent of Dominican immigrants in the 2008-12 period.
|
Figure 2. Top Destination States for Dominican Immigrants in the United States, 2008-12
|
|
Note: Pooled 2008-12 ACS data were used to get statistically valid estimates at the state and metropolitan statistical area levels, for smaller-population geographies. |
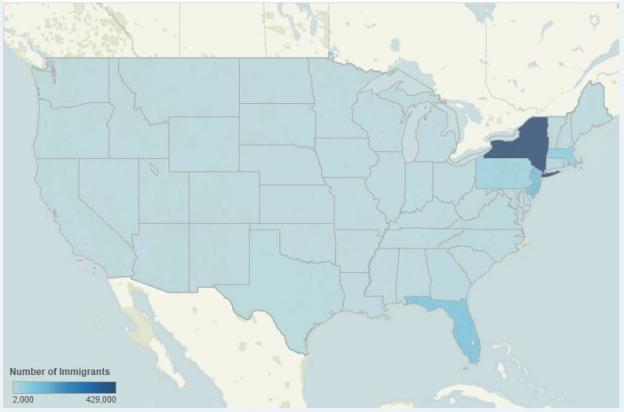
Visit the MPI Data Hub Population Distribution for Regions and Countries of Birth by State and Country Map to view the states and counties in which immigrants from the Dominican Republic reside. Select the Dominican Republic from the dropdown menu.
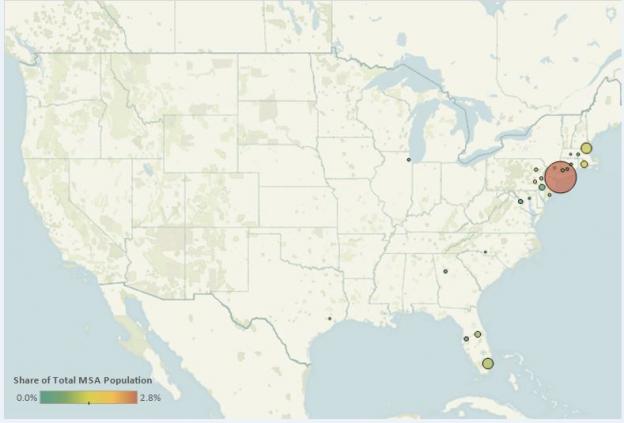
The major metropolitan areas where immigrants from the Dominican Republic resided include the greater New York, Boston, and Miami metropolitan areas. These three metro areas accounted for about 75 percent of the total immigrant population from the Dominican Republic residing in the United States.
|
Figure 3. Top Destination Metropolitan Areas for Dominican Immigrants in the United States, 2008-12
|
|
Source: MPI tabulation of data from U.S. Census Bureau pooled 2008-12 ACS. |
|
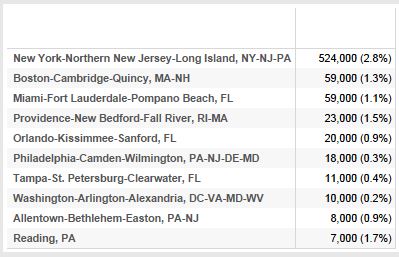
Top Concentrations by Metropolitan Area for the Foreign Born from the Dominican Republic
|
|
Source: MPI tabulation of data from the U.S. Census Bureau pooled 2008-12 ACS. |
Click here to view the interactive map showing population distribution for regions and countries of birth by metropolitan statistical area. Select the Dominican Republic from the dropdown menu.
Immigrants from the Dominican Republic were more likely to be Limited English Proficient (LEP) compared to the overall immigrant population (65 percent versus 50 percent in 2012). For the total foreign-born population from the Caribbean (which includes English-speaking Jamaica and Trinidad and Tobago), the LEP share was lower (43 percent) than for Dominican immigrants.
(Note: The term Limited English Proficient refers to any person age 5 and older who reported speaking English “not at all,” “not well,” or “well” on their survey questionnaire. Individuals who reported speaking only English or speaking English “very well” are considered proficient in English).
Educational and Professional Attainment
In 2012, approximately 14 percent of Dominican immigrants in the United States ages 25 and over had a bachelor's degree or higher, slightly lower than the Caribbean immigrant population overall (19 percent), and only half the share of the total foreign-born adult population (28 percent). About 38 percent of immigrant adults from the Dominican Republic lacked a high school diploma, compared to 31 percent of all immigrant adults.
Eighty percent of Dominican immigrants were of working age (18 - 64) while roughly 12 percent were ages 65 and older in 2012. The median age for this immigrant population was 43 years, equivalent to the median age of the overall foreign-born population.
Data from the Institute of International Education show that 1,803 students from the Dominican Republic were enrolled in U.S. universities in the 2012-13 academic year, a 12 percent increase from the 2011-12 academic year. This share represents approximately 16 percent of the total student population from the Caribbean (11,100).
|
Figure 4. Employed Immigrant Workers in the Civilian Labor Force (Ages 16 and Older) by Occupation and Origin, 2012
|
|
Source: MPI tabulation of data from the U.S. Census Bureau 2012 ACS. |
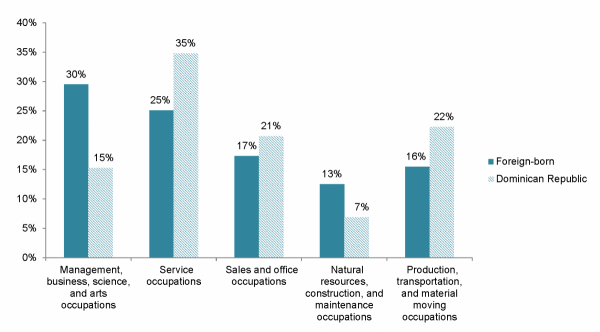
About 35 percent of immigrant adults (ages 16 and older) from the Dominican Republic were employed in service occupations, compared to 25 percent of all immigrant adults.
The overall labor force participation rate of immigrants from the Dominican Republic (16 and older) and all immigrants was equivalent (67 percent). However, immigrant women from the Dominican Republic were much more likely to be engaged in the civilian labor force than all immigrant women (62 percent versus 56 percent).
Immigrants from the Dominican Republic residing in the United States had a lower median income than immigrants from the Caribbean ($31,000 versus $39,000) and the overall foreign-born population ($47,000).
The share of immigrants from the Dominican Republic in poverty (28 percent) was higher than the corresponding share for the overall immigrant population from the Caribbean (21 percent) and the overall foreign-born population (19 percent).
Immigration Pathways and Naturalization
In 2012, approximately 960,000 immigrants from the Dominican Republic resided in the United States. Of them, 50 percent were naturalized U.S. citizens (versus 46 percent naturalized among all immigrants).
|
Figure 5. Immigrants from the Dominican Republic in the United States by Period of Arrival, 2012
|
|
Source: MPI tabulation of data from the U.S. Census Bureau 2012 ACS. |
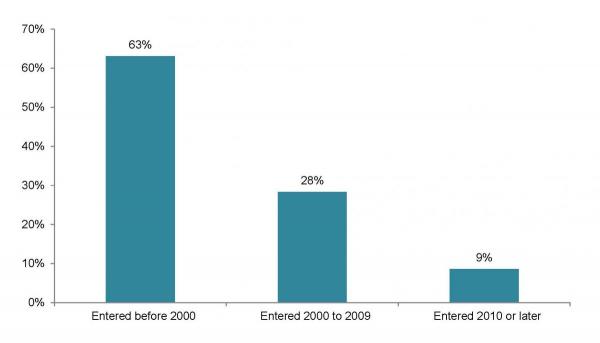
The majority of Dominican immigrants (63 percent) arrived in the United States before 2000 and 28 percent arrived between 2000 and 2009, while fewer than one-tenth have arrived since 2010.
DHS data show that on January 1, 2012, approximately 490,000 of the 13.3 million lawful permanent residents (LPRs) residing in the United States (or about 4 percent) were from the Dominican Republic; 310,000 of these green-card holders from the Dominican Republic were eligible to become U.S. citizens but had not done so as of that date.
Ninety-nine percent of the 41,566 immigrants from the Dominican Republic who received LPR status in 2012 were immediate relatives of U.S. citizens or other family-sponsored immigrants.
|
Figure 6. Immigration Pathways of Immigrants from the Dominican Republic in the United States, 2012
|
|
Notes: Family-sponsored: Includes adult children and siblings of U.S. citizens as well as spouses and children of green-card holders. Immediate relatives of U.S. citizens: Includes spouses, minor children, and parents of U.S. citizens. The Diversity Visa Lottery: The Immigration Act of 1990 established the Diversity Visa Lottery to allow entry to immigrants from countries with low rates of immigration to the United States. The law states that 55,000 diversity visas are made available each fiscal year. |
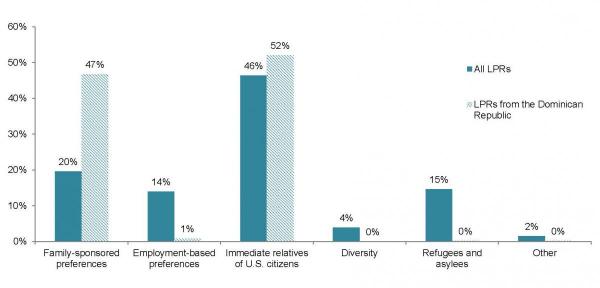
Of the 42,000 foreign born from the Dominican Republic who received their green cards in 2012, the majority were much more likely to immigrate as spouses, minor children, or parents of U.S. citizens (52 percent) or as other family-sponsored immigrants (47 percent) than the total LPR population (46 percent and 20 percent, respectively). In contrast, just 1 percent of Dominican immigrants obtained their green cards through employment sponsorship, compared to 14 percent of all new green-card holders.
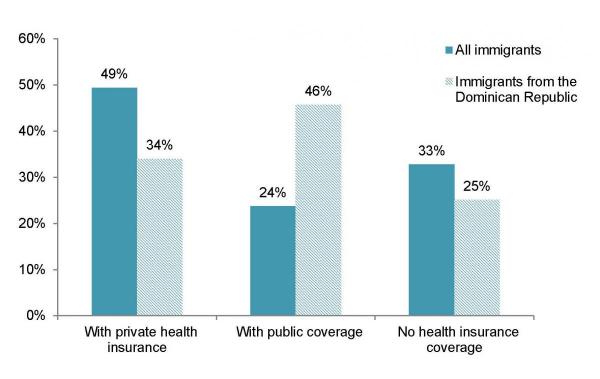
The foreign-born population from the Dominican Republic was less like to be uninsured than the immigrant population overall (25 percent versus 33 percent). Nearly half (46 percent) of Dominican immigrants had public health insurance coverage, compared to 24 percent of all immigrants.
|
Figure 7. Immigrants from the Dominican Republic in the United States by Type of Health Coverage, 2012
|
|
Note: The sum of shares by type of insurance is likely to be greater than 100 because people may have more than one type of insurance. |
The Dominican diaspora in the United States is comprised of approximately 1.7 million individuals who were either born in the Dominican Republic or reported Dominican origin, according to MPI analysis of the U.S. Census Bureau’s pooled 2008-12 ACS.
According to World Bank data, total remittances sent to the Dominican Republic via formal channels equaled $3.6 billion in 2012, representing 6 percent of the country's gross domestic product (GDP).
|
Figure 8. Annual Remittance Flows to the Dominican Republic, 1970-2012
|
|
Source: MPI tabulations of data from the World Bank Prospects Group, “Annual Remittance Data,” October 2013 update. Available Online. |
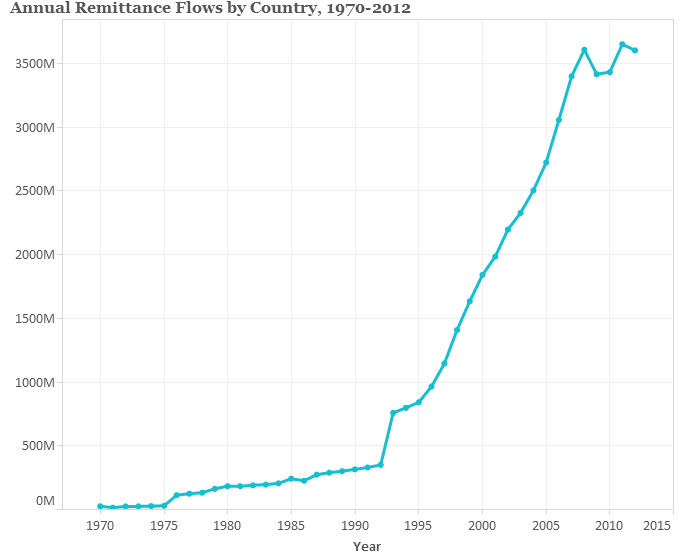
The Dominican diaspora in the United States transferred about $2.7 billion in remittances to the Dominican Republic in 2012.
Visit the Data Hub’s collection of interactive remittances tools, which track remittances by inflow and outflow, between countries, and over time.
Sources
U.S. Citizenship and Immigration Services (USCIS). 2014. DACA Quarterly Report FY14Q1. February 6, 2014. Available Online.
Institute of International Education. 2014. International Students: All Places of Origin, 2011/12 - 2012/13. Available Online.
Jesse Hoffnung-Garskof. 2008. A Tale of Two Cities: Santo Domingo and New York after 1950. (Princeton, NJ: Princeton University Press).
Department of Homeland Security (DHS), Office of Immigration Statistics. Various years. Yearbook of Immigration Statistics. Washington, DC: DHS Office of Immigration Statistics. Available Online.
---. Various years. Annual Flow Reports. Washington, DC: DHS Office of Immigration Statistics. Available Online.
U.S. Citizenship and Immigration Services (USCIS). 2013. Estimates of the Legal Permanent Resident Population in 2012. Washington, DC: DHS Office of Immigration Statistics. Available Online.
World Bank Prospects Group. 2013. Migration and Remittances Data, October 2013 update. Available Online.
---. Bilateral Remittances Matrix, May 2013 version. Available Online.