

Immigrants in the U.S. States with the Fastest-Growing Foreign-Born Populations

Hmong farmers at work in Minnesota, one of the country's fastest-growing immigrant destination states. (Photo: Media Mike Hazard/Flickr)
The foreign-born share of the U.S. population is at its highest level since 1910, with the approximately 44 million immigrants living in the United States representing 13.5 percent of the overall population. With U.S. fertility rates at a historic low, the Census Bureau projects that net international migration will be the main driver behind U.S. population growth between 2027 and 2038. Today, immigrants settle across the country rather than clustering overwhelmingly in a handful of states, as in the past. As the foreign-born population has grown and spread out over the past few decades, it has contributed to population growth in several states and offset decline in others.
Between 2010 and 2016, the number of immigrants in the United States increased by 9 percent. The foreign-born population grew by 15 percent or more in 15 states: North Dakota, West Virginia, South Dakota, Delaware, Nebraska, Minnesota, Wyoming, Pennsylvania, Alaska, Indiana, Florida, Nevada, Washington, Iowa, and Maryland (listed from highest to lowest growth rates; see Figure 1). Approximately 9 million immigrants, or one in every five, reside in these 15 states.
Figure 1. Change in State Immigrant Population, (%), 2010-16
![]()
Note: Teal states are those with immigrant population growth of 15 percent or higher.
Source: Migration Policy Institute (MPI) tabulation of data from the U.S. Census Bureau 2010 and 2016 American Community Survey (ACS).
This Spotlight compares the size, origins, and demographic and socioeconomic characteristics of immigrants in these states and select counties, with those of the U.S.-born population. It relies on data from the Census Bureau's 2010 and 2016 American Community Survey (ACS), pooled ACS data from 2006-10 and 2012-16, the Department of Homeland Security’s Yearbook of Immigration Statistics, and the State Department’s Refugee Processing Center.
Click on the bullet points below for more information:
- Size and Population Change
- Countries of Origin
- Immigration Pathways and Naturalization
- Period of Arrival
- English Proficiency and Languages Spoken at Home
- Educational Attainment
- Employment and Occupations
- Poverty
- Health Insurance
In the six years following the 2007-09 Great Recession, North Dakota, West Virginia, and South Dakota experienced the fastest growth rates of their foreign-born populations: 48 percent, 41 percent, and 39 percent, respectively. Note that the high growth rates in these states are magnified largely because of the small size of their immigrant populations in 2010.
The top 15 states also include several with large immigrant populations, such as Florida, Washington, Maryland, and Pennsylvania, where the foreign-born population grew faster than in the country overall.
In all 15 states except West Virginia the total population increased between 2010 and 2016. Immigrants contributed to this overall growth, in some cases quite significantly. For instance, half of total population growth in Maryland was due to immigration, as was about one-third in Minnesota, Indiana, Delaware, Nevada, and Florida (see Figure 2).
Figure 2. Population Change in State Population, by Nativity, (%), 2010-16
![]()
Note: The 15 states designation represents the states that experienced growth in the foreign-born population of 15 percent or more between 2010 and 2016: North Dakota, West Virginia, South Dakota, Delaware, Nebraska, Minnesota, Wyoming, Pennsylvania, Alaska, Indiana, Florida, Nevada, Washington, Iowa, and Maryland (listed from highest to lowest growth rates).
Source: MPI tabulation of data from the U.S. Census Bureau 2016 and 2010 ACS.
Click here for interactive tools showing how the immigrant population changed over time in other states. Download state-level data here.
In Pennsylvania, while the state’s native-born population declined by 57,200, the net gain of 131,800 immigrants more than made up for this loss, resulting in positive overall growth. And in West Virginia, immigrant arrivals slowed total population decline, though not enough to offset it.
However, immigrant populations did not grow uniformly within states. In five counties across the 15 states, foreign-born growth accounted for 16 percent or more of the entire state’s population growth (see Table 1).
Note: To estimate change over time at the county level, this Spotlight compares pooled ACS data from 2006-10 to 2012-16. Five-year pooled data were used to ensure reliability of county-level estimates. In contrast, state-level estimates are based on single-year data. For this reason, county and state-level trends may not be fully comparable.
Table 1. Overall State Population Growth Due to Immigrants in Select Counties, (%), 2010-16
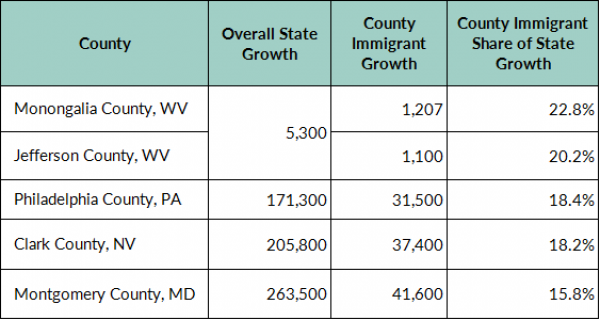
Source: MPI tabulation of pooled data from the U.S. Census Bureau 2006-10 ACS and 2012-16 ACS.
Notably, some of the growth of the U.S.-born population is due to the birth of children to immigrant parents. In other words, immigration contributes to state population growth—and by extension to expansion of the local labor force—in two ways: net in-migration (domestic or international) and higher annual births than among the native born. In 2014, about 84.2 babies were born per 1,000 immigrant women ages 15 to 44, compared to 58.3 births per 1,000 U.S.-born women in 2014, according to Pew Research Center estimates. Since 1970, births to immigrant mothers have increased fertility in all states but California and Rhode Island.
Mexican immigrants were the largest origin group in these 15 states, representing 13 percent of the foreign born, closely followed by Cubans with 11 percent (see Figure 3). Mexicans were much less concentrated in the fastest-growing immigrant destinations compared to the United States overall (27 percent), and Cubans were much more concentrated in these states than in the country more broadly (less than 3 percent). (This is for the most part due to the inclusion of Florida, home to the vast majority of Cuban immigrants.)
The other top countries of birth for the 15 states were India (5 percent); Haiti, the Philippines, and China/Hong Kong (4 percent each); Colombia and Jamaica (3 percent each); and El Salvador and Vietnam (less than 3 percent each). Immigrants from Haiti, Colombia, and Jamaica were more represented in these states than in the country overall.
Figure 3. Top Countries of Birth of Immigrants in 15 Fastest-Growing Destination States versus United States Overall, 2016
![]()
Source: MPI tabulation of data from the U.S. Census Bureau 2016 ACS.
Immigration Pathways and Naturalization
The foreign born in the 15 fastest-growing destination states were slightly more likely to be naturalized U.S. citizens compared to immigrants overall—51 percent versus 49 percent. In 2016, immigrants in Alaska had the highest naturalization share of these states (57 percent), followed by Florida (55 percent); this share was lowest in South Dakota (36 percent) and Nebraska (34 percent). (See Figure 4.)
Figure 4. Share of Immigrants Naturalized by State, (%), 2016
![]()
Source: MPI tabulation of data from the U.S. Census Bureau 2016 ACS.
More than 1.6 million foreign nationals in the top 15 states obtained lawful permanent residence (LPR status, also known as getting a green card) between fiscal year (FY) 2010 and 2016. They accounted for 22 percent of the 7.4 million immigrants who received green cards during the same period nationwide.
The 15 states were home to about 1.7 million unauthorized immigrants in the 2010-14 period, or about 15 percent of the 11 million unauthorized population in the United States, according to Migration Policy Institute (MPI) estimates.
In total, approximately 120,100 refugees, or one-quarter of the 491,400 admitted to the United States during the 2010-16 period, were resettled in these 15 states. They accounted for 10 percent of total foreign-born population growth in these states over this period.
Seventy-five percent of refugees resettled in the 15 states were from one of five countries: Burma (32,100), Bhutan (18,900), Iraq (13,400), Somalia (13,000), or Cuba (12,400). The composition varied across states, with 58 percent of Cubans settling in Florida, 13 percent of Bhutanese in Pennsylvania, and 12 percent of Somalis in Minnesota.
Immigrants residing in the top 15 states arrived in the country more recently than the foreign-born population overall. In 2016, 21 percent of the foreign born in these states entered in 2010 or later, 28 percent arrived during the 2000s, and the remaining 51 percent came before 2000. Among all immigrants, 18 percent arrived since 2010, 27 percent came during the 2000s, and 55 percent entered before 2000.
English Proficiency and Languages Spoken at Home
Immigrants in the fastest-growing destination states are more likely to be proficient in English than the overall U.S. immigrant population. About 45 percent of the foreign born ages 5 and older in these states reported speaking English less than "very well," thus classifying them as Limited English Proficient (LEP), versus roughly half of all immigrants.
Note: Limited English Proficient refers to those who reported speaking English "not at all," "not well," or "well" on the ACS questionnaire. Individuals who reported speaking English exclusively or "very well" are considered proficient in English.
In the United States, about 22 percent of the total population ages 5 and older speaks a language other than English at home. This share was higher in Nevada (31 percent) and Florida (29 percent), but much smaller than the national average in most other fast-growing destination states (see Table 2).
Spanish was the top non-English language spoken at home in the country overall and in the 15 fastest-growing states with one exception: Alaska, where Eskimo–Aleut and other Native American languages predominated.
Table 2. Speakers (ages 5 and older) of Languages Other than English and Top Five Languages Spoken at Home, by State, 2016
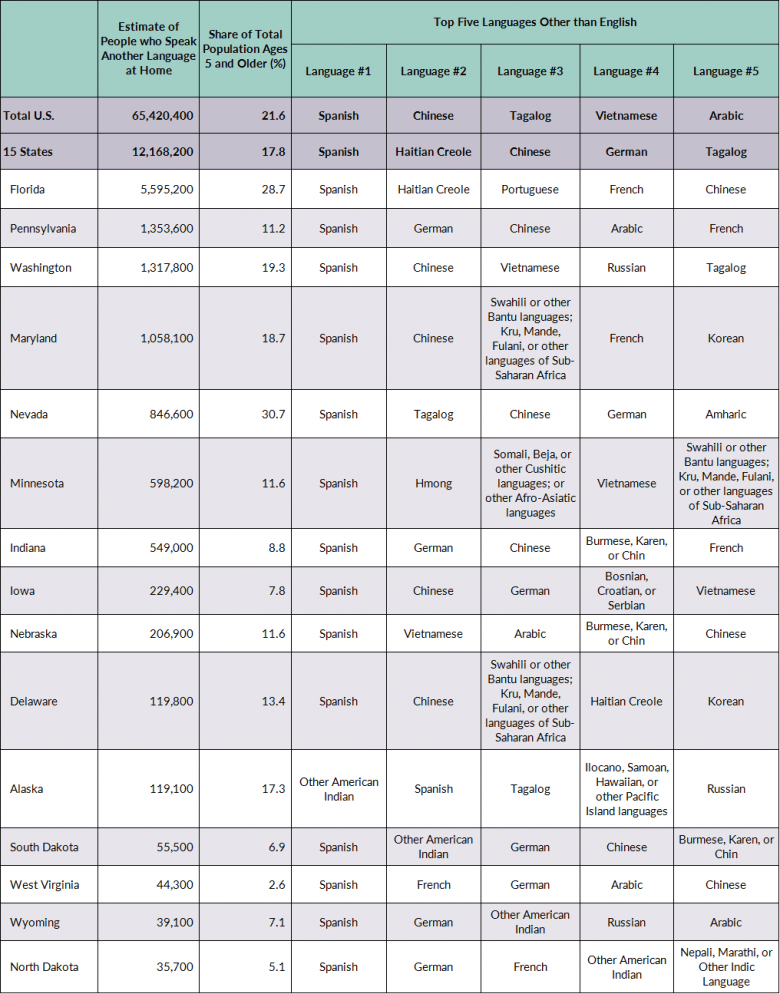
Notes: "Other American Indian" exclude Navajo and South/Central American Indian languages, which are reported separately; "Chinese" includes Mandarin, Cantonese, and Chinese; "Somali, Beja, or other Cushitic languages; or other Afro-Asiatic Languages" exclude Arabic, Hebrew, Syriac, Aramaic, Chaldean, or Amharic, which are reported separately; "French" includes French, Patois, and Cajun; "German" includes German and Pennsylvania Dutch; "Ilocano, Samoan, Hawaiian, or other Pacific Islander languages" exclude Tagalog, which is reported separately; "Malayalam, Kannada, or other Dravidian Languages” exclude Tamil and Telugu, which are reported separately; "Nepali, Marathi, or other Indic languages" exclude Hindi, Urdu, Punjabi, Bengali, and Guajarati, which are reported separately; "Portuguese” includes Portuguese and Portuguese Creole; "Spanish" includes Spanish and Spanish Creole; "Tagalog" includes Filipino.
Source: MPI tabulation of data from the U.S. Census Bureau 2016 ACS.
At the national level, the next four languages spoken at home were Chinese, Tagalog, Vietnamese, and Arabic. There were marked differences, however, in the top languages spoken by people in the 15 states, related to differing population trends and composition. Residents of Minnesota, where many refugees have been resettled in the past few decades, reported speaking Hmong and Vietnamese, as well as a host of African languages including Beja, Somali, Swahili, and Kru.
Similarly, Iowa is home to refugees and immigrants from the former Yugoslavia who were resettled in the 1990s. As a result, some residents reported speaking Bosnian, Croatian, and Serbian at home. Burmese, Karen, and Chin—spoken by Burmese refugees—were among the top five languages in Indiana, Nebraska, and South Dakota. Given that Florida is the top state for Haitian immigrants, it is not surprising that Haitian Creole was the second most common non-English language in Florida.
Immigrant adults in the 15 states with the fastest immigrant growth have higher levels of education than U.S. immigrants overall: about 76 percent in 2016 reported having earned a high school degree or higher, compared to 71 percent of all foreign born and 91 percent of all native born in the United States (see Figure 5).
Figure 5. Educational Attainment of Immigrant Adults (ages 25 and older) by State, 2016
![]()
Note: Numbers may not add up to 100 as they are rounded to the nearest whole number.
Source: MPI tabulation of data from the U.S. Census Bureau 2016 ACS.
However, educational attainment varies significantly across states and as compared to the national trend. Immigrants in Nebraska are less likely to be educated, with 44 percent lacking a high school diploma compared to 29 percent of the overall foreign born. In contrast, immigrants in West Virginia, Maryland, Pennsylvania, and Delaware are much more likely to hold college degrees than U.S. immigrants overall.
Immigrants are overrepresented among all workers relative to their share of the population in each of the 15 states, as in the country overall (see Figure 6). Nevada and Florida represent the high end of the range: While representing 20 percent of the Nevada population, the foreign born were 27 percent of the state’s workers; and 26 percent of Florida workers while accounting for 21 percent of the state population.
Figure 6. Immigrant Share of Employed Workers in the Civilian Labor Force (ages 16 and older) and of Total Population by State, 2016
![]()
Source: MPI tabulation of data from the U.S. Census Bureau 2016 ACS.
Immigrants in the 15 states participate in the labor force at a somewhat higher rate than their native-born counterparts—66 percent in 2016, compared to 62 percent of the U.S. born. These rates are equal to those of the foreign and native born in the country overall.
Meanwhile, immigrant workers in the fastest-growing destination states were less likely than their U.S.-born counterparts to be employed in management, business, and finance occupations (31 percent versus 38 percent) and more likely to be in service occupations (25 percent versus 17 percent).
The jobs typically held by immigrants in each state generally align with their education levels. For example, immigrants in Nebraska are less educated and are significantly more likely to work in production, transportation, and material moving occupations (32 percent). Immigrants with more education are employed at higher rates in management, business, science, and art occupations in West Virginia (50 percent), Delaware (42 percent), Maryland (40 percent), and Pennsylvania (38 percent; see Figure 7).
Figure 7. Employed Immigrant Workers in the Civilian Labor Force (ages 16 and older) by Occupation and State, 2016
![]()
Source: MPI tabulation of data from the U.S. Census Bureau 2016 ACS.
In many states, immigrants are highly represented among all workers in low-skilled jobs. For example, in Florida the foreign born make up more than 30 percent of workers employed in natural resources (which includes agriculture), construction, and maintenance occupations; service occupations; and production, transportation, and material moving (see Figure 8). This is higher than the immigrant share of all workers (26 percent). In Nevada, about 41 percent of workers in service jobs and 37 percent in production, transportation, and material moving jobs were born abroad.
Figure 8. Immigrant Share of Employed Workers in the Civilian Labor Force by Occupation and State, (%), 2016
![]()
Source: MPI tabulation of data from the U.S. Census Bureau 2016 ACS.
Poverty levels for both foreign- and native-born populations in the fastest-growing immigrant destinations are on par with national trends: About 16 percent of immigrant families had an annual income below the federal poverty line, compared to 12-14 percent among the U.S. born (see Figure 9).
Meanwhile, poverty rates vary substantially by state, with the largest gaps between immigrants and natives in North Dakota. The poverty rate is similar between the two groups in Maryland, and in Alaska, the U.S.-born population is more likely to be poor than immigrants.
Figure 9. Share of Individuals in Poverty, by State and Nativity, (%), 2016
![]()
Source: MPI tabulation of data from the U.S. Census Bureau 2016 ACS.
Regardless of place of residence, immigrants were much more likely to lack health insurance in 2016, compared to their U.S.-born counterparts. In the fastest-growing immigrant states as in the country overall, about 20 percent of immigrants were uninsured versus 6-7 percent of the native born (see Figure 10).
At the state level, both immigrants and the U.S. born in Florida and Wyoming have higher uninsured rates compared to the national average. The difference in uninsured rates between immigrants and natives was the widest in Nebraska (29 percent versus 7 percent), Nevada (26 percent versus 8 percent), and Indiana (23 percent versus 7 percent).
Figure 10. Share of Population Lacking Health Insurance, by State and Nativity, (%), 2016
![]()
Note: Numbers refer to the civilian noninstitutionalized population.
Source: MPI tabulation of data from the U.S. Census Bureau 2016 ACS.
Almost all the indicators examined above for the 15 states with the fastest immigrant growth are also available for other states. Visit MPI’s Migration Data Hub for the State Immigration Data Profiles tool and select any state to view demographics, educational and workforce characteristics, and income and poverty rates for immigrants and the native born in that state.
Sources
Livingston, Gretchen. 2017. Over the Past 25 Years, Immigrant Moms Bolstered Births in 48 States. Pew FactTank blog, August 29, 2017. Available online.
Livingston, Gretchen and Kristen Bialik. 2018. 7 Facts about U.S. Moms. Pew FactTank blog, May 10, 2018. Available online.
Migration Policy Institute. N.d. Unauthorized Immigrant Population Profiles. Accessed July 1, 2018. Available online.
Pew Charitable Trusts. 2014. Changing Patterns in U.S. Immigration and Population. Washington, DC: Pew Charitable Trusts. Available online.
U.S. Census Bureau. 2017. 2006 to 2016 American Community Surveys. Accessed from Steven Ruggles, Katie Genadek, Ronald Goeken, Josiah Grover, and Matthew Sobek. Integrated Public Use Microdata Series: Version 7.0 [dataset]. Minneapolis: University of Minnesota, 2017. Available online.
U.S. Department of Homeland Security (DHS), Office of Immigration Statistics. 2017. 2016 Yearbook of Immigration Statistics. Washington, DC: DHS Office of Immigration Statistics. Available online.
U.S. Department of State, Bureau of Population, Refugees, and Migration. N.d. Refugee Processing Center—Arrivals by Destination and Nationality. Accessed July 1, 2018. Available online.
Tavernise, Sabrina. 2018. U.S. Fertility Rate Fell to a Record Low, for a Second Straight Year. The New York Times, May 16, 2018. Available online.