

Indian Immigrants in the United States

A family in New Jersey celebrates the Hindu festival of Janmashtami. (Photo: ISKCON of Central New Jersey)
Immigration to the United States from India started in the early 19th century when Indian immigrants began settling in communities along the West Coast. Although they originally arrived in small numbers, new opportunities arose in middle of the 20th century, and the population grew larger in following decades. As of 2019, about 2.7 million Indian immigrants resided in the United States. Today, Indian immigrants account for approximately 6 percent of the U.S. foreign-born population, making them the second-largest immigrant group in the country, after Mexicans and ahead of immigrants from China and the Philippines.
The first wave of Indian immigrants found work mainly in the agriculture, lumber, and railroad industries. Although their presence remained relatively small through the early the 20th century, they and other non-European migrants were the target of a series of laws in 1917, 1921, and 1924, which, among other exclusionary measures, eventually banned Indian immigrants altogether. While the Luce-Celler Act of 1946 established a yearly quota of 100 Indian immigrants, it was the 1965 Immigration and Nationality Act that removed national-origin quotas altogether, paving the way for non-European arrivals. Educational exchange programs, new temporary visas for highly skilled workers, and expanded employment-based immigration channels opened pathways for highly skilled and educated Indian immigrants, many of whom brought family. From 1980 to 2019, the Indian immigrant population in the United States increased 13-fold (see Figure 1).
Figure 1. Indian Immigrant Population in the United States, 1980-2019
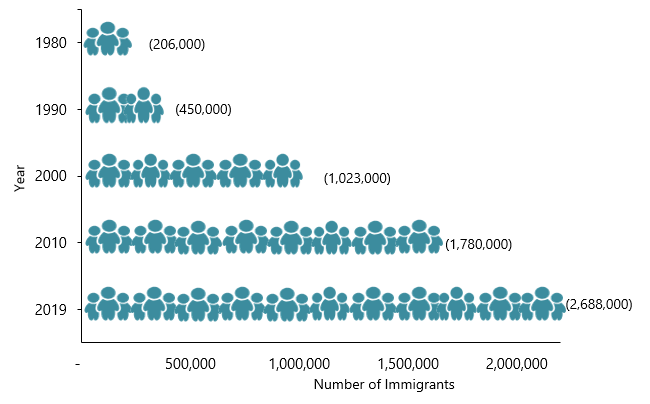
Sources: Data from U.S. Census Bureau 2010 and 2019 American Community Surveys (ACS), and Campbell J. Gibson and Kay Jung, "Historical Census Statistics on the Foreign-born Population of the United States: 1850-2000" (Working Paper no. 81, U.S. Census Bureau, Washington, DC, February 2006), available online.
The United States is the second most popular destination for Indians living abroad, after the United Arab Emirates (3.4 million). Other top destinations include Saudi Arabia (2.4 million), Pakistan (1.6 million), Oman (1.3 million), and Kuwait (1.1 million), according to mid-2019 United Nations Population Division estimates.
Click here to view an interactive map showing where migrants from India and other countries have settled worldwide.
Indian immigrants are notable not only for their large numbers. Compared with both the overall U.S.- and foreign-born populations, Indian immigrants are more likely to be highly educated, to work in management positions, and to have higher incomes. They also have lower poverty rates and are less likely to be uninsured. Today, most Indians in the United States who obtain lawful permanent residence (LPR status, also known as getting a green card) do so through family reunification channels, either as immediate relatives of U.S. citizens or through other family-sponsored channels, although a sizeable share gain status through employment preferences.
Using data from the U.S. Census Bureau (the most recent 2019 American Community Survey [ACS] as well as pooled 2014-18 ACS data), the Department of Homeland Security’s Yearbook of Immigration Statistics, and the World Bank, this Spotlight provides information on the Indian immigrant population in the United States, focusing on its size, geographic distribution, and socioeconomic characteristics.
Click on the bullet points below for more information:
- Distribution by State and Key Cities
- English Proficiency
- Age, Education, and Employment
- Income and Poverty
- Immigration Pathways and Naturalization
- Health Coverage
- Diaspora
- Remittances
Distribution by State and Key Cities
In the 2014-18 period, immigrants from India were highly concentrated in California (20 percent), followed by Texas and New Jersey (each with 10 percent). The next three most populous states—New York, Illinois, and Georgia—were home to an additional 17 percent of the Indian population collectively. The top four counties by Indian concentration were Santa Clara County in California, Middlesex County in New Jersey, Alameda County in California, and Cook County in Illinois. Together four these counties were home to 15 percent of Indian immigrants in the United States.
Figure 2. Top Destination States for Indian-Born Immigrants in the United States, 2014-18
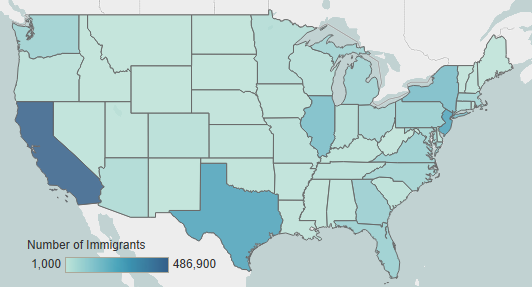
Note: Pooled 2014-18 ACS data were used to get statistically valid estimates at the state level for smaller-population geographies. Not shown are the populations in Alaska and Hawaii, which are small in size; for details, visit the Migration Policy Institute (MPI) Data Hub for an interactive map showing geographic distribution of immigrants by state and county, available online.
Source: MPI tabulation of data from U.S. Census Bureau pooled 2014-18 ACS.
Click here for an interactive map that highlights the states and counties with the highest concentrations of immigrants from India and other countries.
As of 2014-18, the U.S. cities with the largest number of Indians were the greater New York, Chicago, San Francisco, and San Jose metropolitan areas. These four metro areas accounted for about 30 percent of Indians in the United States.
Figure 3. Top Metropolitan Destinations for Indian-Born Immigrants in the United States, 2014-18
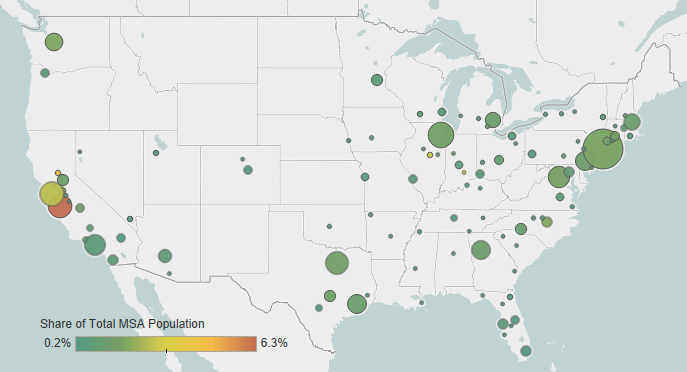
Note: Pooled 2014-18 ACS data were used to get statistically valid estimates at the metropolitan statistical-area level for smaller-population geographies.
Source: MPI tabulation of data from U.S. Census Bureau pooled 2014-18 ACS.
Click here for an interactive map that highlights the metropolitan areas with the highest concentrations of immigrants from India and other countries.
Table 1. Top Concentrations by Metropolitan Area for the Foreign Born from India, 2014-18
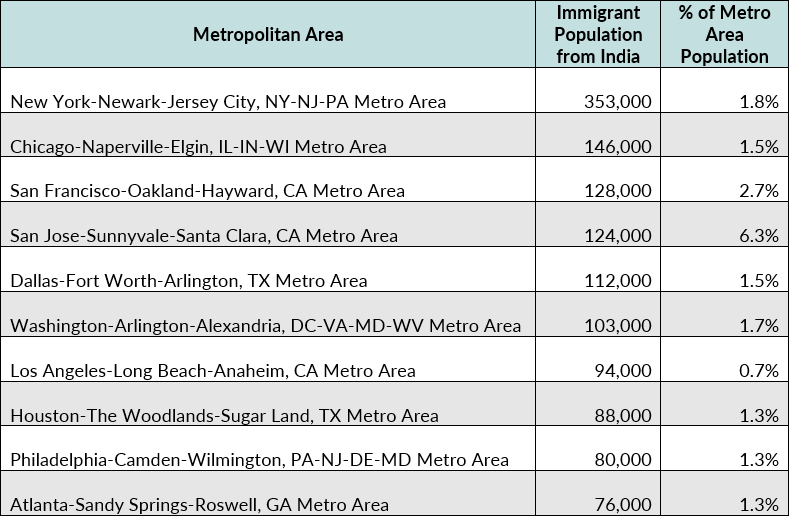
Source: MPI tabulation of data from the U.S. Census Bureau pooled 2014-18 ACS.
Indian immigrants are much more likely to be proficient in English than the overall foreign-born population. In 2019, about 22 percent of Indians ages 5 and over reported limited English proficiency, compared to 46 percent of all immigrants. Approximately 12 percent of Indians spoke only English at home, versus 16 percent of the foreign born. According to the most recently available data on languages, besides English, immigrants from India spoke a variety of other languages at home in 2018, including Hindi (26 percent), Telugu (13 percent), Gujarati (11 percent), Tamil (9 percent), and Punjabi (8 percent).
Note: Limited English proficiency refers to those who indicated on the ACS questionnaire that they spoke English less than “very well.”
Age, Education, and Employment
In 2019, Indians were younger than the overall foreign-born population but older than the U.S.-born population. The Indian median age was 40 years, compared to 46 years for all immigrants and 37 years for the native born. This is largely due to the high number of working-age Indians: 81 percent of all Indian immigrants were in the 18-to-64 range, versus 78 percent of the overall foreign-born population and 59 percent of the native-born population. Meanwhile, Indians were less likely than both the native- and foreign-born populations to be 65 or older.
Figure 4. Age Distribution by Origin, 2019
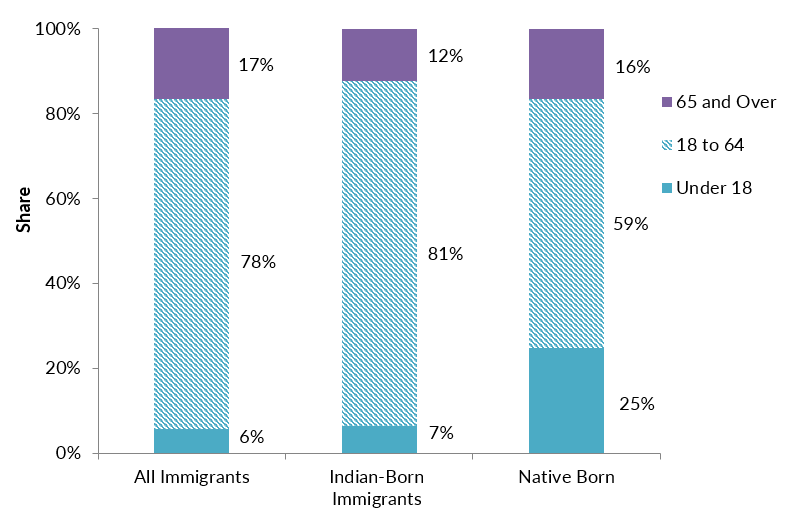
Source: MPI tabulation of data from the U.S. Census Bureau 2019 ACS.
Indians have much higher education rates than both the U.S.- and overall foreign-born populations. In 2019, 79 percent of Indian immigrants ages 25 and older reported having at least a bachelor’s degree, compared to 33 percent of both U.S.-born and all immigrant adults.
Indians participate in the labor force at a slightly higher rate than all immigrants and the U.S.-born population. About 72 percent of Indian immigrants ages 16 and older were in the civilian labor force in 2019, compared to 67 percent of the foreign born and 62 percent of the native born. Indians were much more likely to be employed in management, business, science, and arts occupations than the overall U.S.- and foreign-born populations (see Figure 5).
Figure 5. Employed Workers in the Civilian Labor Force (ages 16 and older) by Occupation and Origin, 2019

Source: MPI tabulation of data from the U.S. Census Bureau 2019 ACS.
Indians overall have much higher incomes than the total foreign- and native-born populations. In 2019, households headed by an Indian immigrant had a median income of $132,000, compared to $64,000 and $66,000 for all immigrant and U.S.-born households, respectively.
In 2019, Indian immigrants were less likely to be in poverty (5 percent) than immigrants overall (14 percent) or the U.S. born (12 percent).
Immigration Pathways and Naturalization
Indians are less likely to be naturalized U.S. citizens than immigrants overall. In 2019, 47 percent of Indians were naturalized citizens, compared to 52 percent of all immigrants.
Compared to all immigrants, Indians are much less likely to have arrived before 2000. The largest share of Indians, approximately 41 percent, arrived in 2010 or later, as compared to just 25 percent of the overall foreign-born population (see Figure 6).
Figure 6. Indian-Born and All Immigrants in the United States by Period of Arrival, 2019
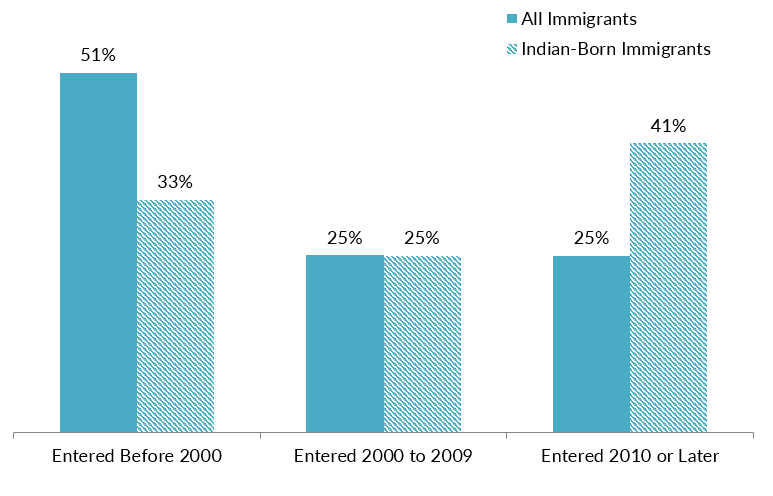
Source: MPI tabulation of data from the U.S. Census Bureau 2019 ACS.
In fiscal year (FY) 2018, India was the fourth-largest country of origin for new permanent residents after Mexico, Cuba, and mainland China. Close to 60,000 of the 1.1 million new LPRs were from India. Most Indians who obtain green cards do so through family reunification channels. In FY 2018, 59 percent of the 59,821 Indians who received a green card did so as either immediate relatives or other family members of U.S. citizens, while 38 percent received a green card through employment-based channels, at a rate almost three times higher than for all new LPRs (13 percent) (see Figure 7).
Figure 7. Immigration Pathways of Indian-Born and All Legal Permanent Residents in the United States, 2018
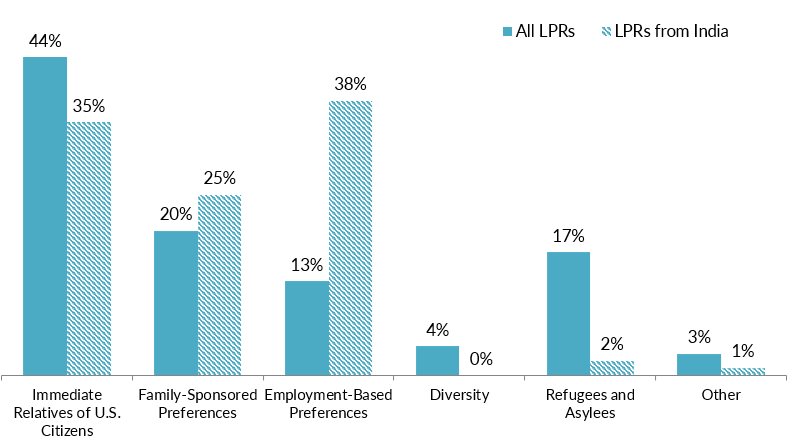
Notes: Family-sponsored: Includes adult children and siblings of U.S. citizens as well as spouses and children of green-card holders. Immediate relatives of U.S. citizens: Includes spouses, minor children, and parents of U.S. citizens. Diversity Visa lottery: The Immigration Act of 1990 established the Diversity Visa lottery program to allow entry to immigrants from countries with low rates of immigration to the United States. The law states that 55,000 diversity visas in total are made available each fiscal year. Individuals born in India are not eligible for the lottery.
Source: MPI tabulation of data from Department of Homeland Security (DHS), 2018 Yearbook of Immigration Statistics (Washington, DC: DHS Office of Immigration Statistics, 2020), available online.
Although the vast majority of Indian immigrants in the United States are legally present, approximately 296,000 were unauthorized in the 2012-16 period, according to Migration Policy Institute (MPI) estimates, comprising approximately 3 percent of the 11.3 million unauthorized population.
MPI also estimated that approximately 20,000 Indian unauthorized immigrants were immediately eligible for the Deferred Action for Childhood Arrivals (DACA) program when it was introduced in 2012. However, as of March 2020, only 2,220 Indian-born individuals were among the 643,600 active participants, according to U.S. Citizenship and Immigration Services (USCIS) data.
Indians have high health insurance coverage rates compared to both the overall immigrant and native-born populations. In 2019, just 5 percent of immigrants from India were uninsured, compared to 8 percent of the native born and 20 percent of the total foreign born. Indian immigrants were also more likely to be covered by private health insurance than the overall foreign- and U.S.-born populations (see Figure 8).
Figure 8. Health Coverage for Indian-Born Immigrants, All Immigrants, and the Native Born, 2019
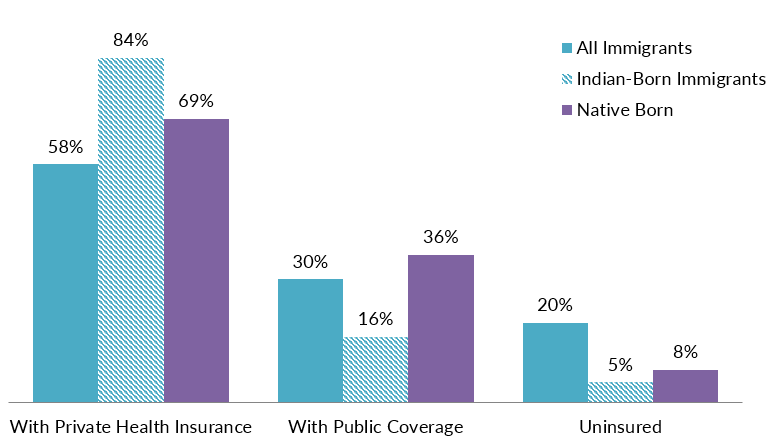
Note: The sum of shares by type of insurance is likely to be greater than 100 because people may have more than one type of insurance.
Source: MPI tabulation of data from the U.S. Census Bureau 2019 ACS.
The Indian diaspora in the United States is comprised of approximately 4.8 million individuals who were either born in India or reported Indian ancestry or race, according to tabulations from the U.S. Census Bureau 2018 ACS.
In 2019, Indians living abroad sent more than $83.1 billion in remittances to India via formal channels, according to World Bank estimates. Remittances to India have increased by 55 percent since 2010 and represented nearly 3 percent of the country’s gross domestic product (GDP) in 2019.
Figure 9. Annual Remittance Flows to India, 1990 to 2019
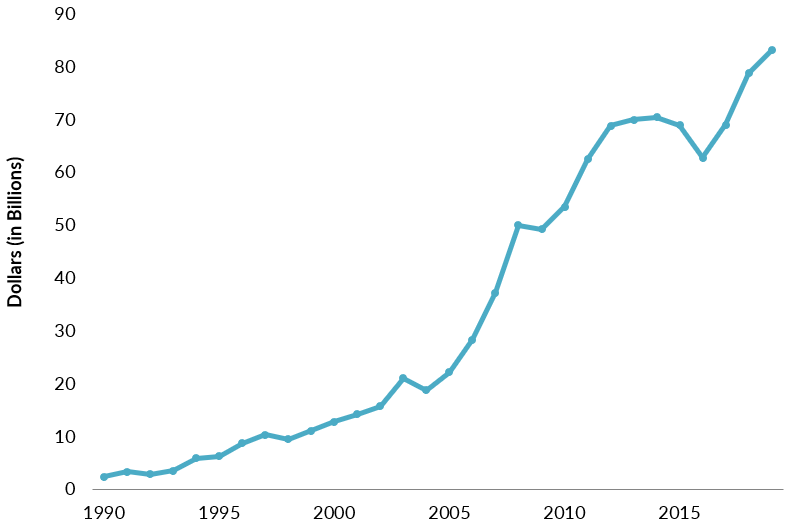
Note: The 2019 figure represents World Bank estimates.
Source: MPI tabulations of data from the World Bank Prospects Group, “Annual Remittances Data,” April 2020 update.
Click here to view an interactive chart showing annual remittances received and sent by India and other countries.
Sources
Garlough, Christine Lynn. 2008. Indian Americans. In Encyclopedia of Race, Ethnicity, and Society, ed. Richard T. Schaefer. Thousand Oaks, CA: SAGE Publications.
Gibson, Campbell J. and Kay Jung. 2006. Historical Census Statistics on the Foreign-born Population of the United States: 1850-2000. Working Paper no. 81, U.S. Census Bureau, Washington, DC, February 2006. Available online.
United Nations Population Division. N.d. International Migrant Stock by Destination and Origin. Accessed September 23, 2020. Available online.
U.S. Census Bureau. N.d. 2019 American Community Survey. Accessed October 6, 2020. Available online.
---. 2020. 2018 American Community Survey. Access from Steven Ruggles, Katie Genadek, Ronald Goeken, Josiah Grover, and Matthew Sobek. Integrated Public Use Microdata Series: Version 7.0 [dataset]. Minneapolis: University of Minnesota, 2020. Available online.
U.S. Citizenship and Immigration Services. 2020. Approximate Active DACA Recipients: Country of Birth as of March 31, 2020. Available online.
U.S. Department of Homeland Security (DHS) Office of Immigration Statistics. 2020. 2018 Yearbook of Immigration Statistics. Washington, DC: DHS Office of Immigration Statistics. Available online.
World Bank Prospects Group. 2020. Annual Remittances Data, April 2020 update. Available online.