

Immigrants from Iran in the United States

A woman holding an Iranian flag at sunset. (Photo: iStock.com/FTiare)
Although Iranians have lived in the United States in small numbers since the 1930s, U.S. government support of Shah Mohammad Reza Pahlavi and his subsequent overthrow in the Islamic Revolution of 1978 and 1979 helped drive Iranian emigration in the second half of the 20th century. From the late 1940s until the revolution, immigrant arrivals to the United States from Iran consisted mainly of international students along with professionals and tourists. Iranians accounted for 9 percent of all U.S. international students in school year (SY) 1974-75 and 18 percent in SY 1979-80—the largest group in both years. Immigration from Iran increased dramatically in the years following the Islamic Revolution and the 1980-88 Iran-Iraq War. These new arrivals included upper- and middle-class Iranians as well as religious and ethnic minorities such as Baháʼís and Armenians. At the same time, many Iranian students in the United States remained in the country after graduation.
Between 1980 and 2000, the Iranian immigrant population more than doubled from 122,000 to 283,000. This population growth continued into the 21st century, albeit at a slower pace, with 385,000 Iranian immigrants living in the United States in 2019. That year, Iranians made up less than 1 percent of the more than 44.9 million immigrants in the United States.
Figure 1. Iranian Immigrant Population in the United States, 1980-2019
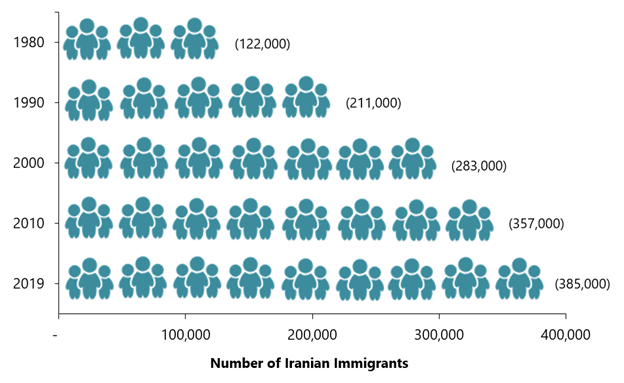
Sources: Data from U.S. Census Bureau 2010 and 2019 American Community Surveys (ACS), and Campbell J. Gibson and Kay Jung, "Historical Census Statistics on the Foreign-Born Population of the United States: 1850-2000" (Working Paper no. 81, U.S. Census Bureau, Washington, DC, February 2006), available online.
According to mid-2019 estimates from the United Nations Population Division, the United States is the most popular destination for Iranians living abroad. Canada is home to the next largest Iranian population (164,000), followed by Germany (127,000), the United Kingdom (90,000), and Turkey (83,000).
Click here to view an interactive map showing where migrants from Iran and other countries have settled worldwide.
Within the United States, more than half of all Iranian immigrants live in California and more than one-third live in the Los Angeles metropolitan area. Iranians’ primary pathways to U.S. permanent residence, also known as getting a green card, are through employment or humanitarian protection. Compared to the overall foreign-born population, Iranian immigrants are much more likely to have a college degree, higher household incomes, and greater English proficiency.
Using data from the U.S. Census Bureau (the most recent 2019 American Community Survey [ACS] as well as pooled 2015-19 ACS data), the Department of Homeland Security’s Yearbook of Immigration Statistics, and the World Bank, this Spotlight provides information on the Iranian immigrant population in the United States, focusing on its size, geographic distribution, and socioeconomic characteristics.
Click on the bullet points below for more information:
- Distribution by State and Key Cities
- English Proficiency
- Age, Education, and Employment
- Income and Poverty
- Immigration Pathways and Naturalization
- Unauthorized Immigrant Population
- Health Coverage
- Diaspora
- Remittances
Distribution by State and Key Cities
During the 2015-19 period, 54 percent of Iranian immigrants lived in California, with 29 percent in Los Angeles County alone. The next three states with the largest Iranian immigrant populations were Texas (8 percent), New York (5 percent), and Virginia (4 percent).
Figure 2. Top States of Residence for Iranians in the United States, 2015–19
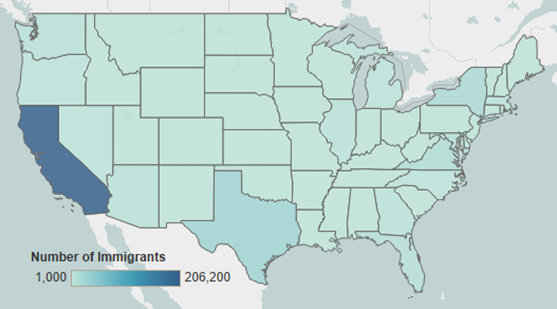
Note: Pooled 2015-19 ACS data were used to get statistically valid estimates at the state level for smaller-population geographies. Not shown are the populations in Alaska and Hawaii; for details, visit the Migration Policy Institute (MPI) Migration Data Hub for an interactive map showing geographic distribution of immigrants by state and county, available online.
Source: MPI tabulation of data from U.S. Census Bureau pooled 2015-19 ACS.
In terms of cities, the largest shares of Iranian immigrants lived in the greater Los Angeles (36 percent); Washington, DC (6 percent); New York (5 percent); and San Francisco (5 percent) metropolitan areas.
Figure 3. Top Metropolitan Areas of Residence for Iranians in the United States, 2015-19
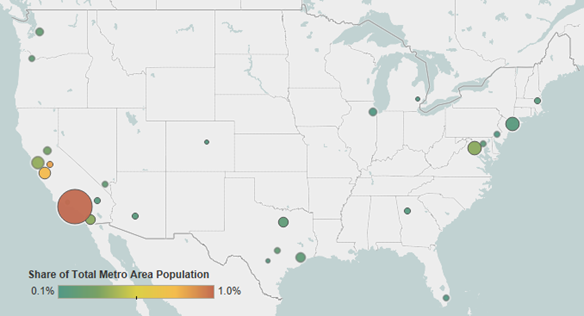
Note: Pooled 2015-19 ACS data were used to get statistically valid estimates at the metropolitan statistical-area level for smaller-population geographies.
Source: MPI tabulation of data from U.S. Census Bureau pooled 2015-19 ACS.
Click here for an interactive map that highlights the metropolitan areas with the highest concentrations of immigrants from Iran and other countries.
Table 1. Top Concentrations for the Foreign Born from Iran by U.S. Metropolitan Area, 2015-19
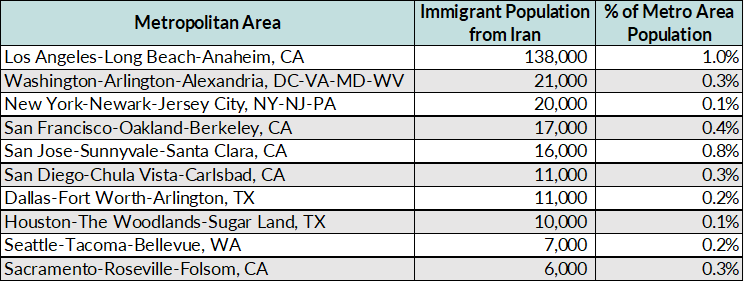
Source: MPI tabulation of data from the U.S. Census Bureau pooled 2015-19 ACS.
Iranian immigrants are less likely to be Limited English Proficient (LEP) compared to the overall foreign-born population. In 2019, 36 percent of Iranian immigrants ages 5 and over reported limited English proficiency, compared with 46 percent of all immigrants. Thirteen percent of Iranian immigrants reported speaking only English at home, as opposed to 16 percent of all immigrants.
Note: LEP refers to those who indicated on the ACS questionnaire that they spoke English less than “very well.”
Age, Education, and Employment
Iranian immigrants, as a group, are older than both the total foreign-born and U.S.-born populations. The median age for Iranians was 55 years, compared to 46 years for the overall foreign-born population and 37 years for the native born. In 2019, just 2 percent of Iranian immigrants were under age 18, compared to 25 percent of the U.S.-born population and 6 percent of the overall foreign-born population. Seventy percent of Iranian immigrants were between 18 and 64 years old, while 28 percent were age 65 or older.
Figure 4. Age Distribution of the U.S. Population by Origin, 2019
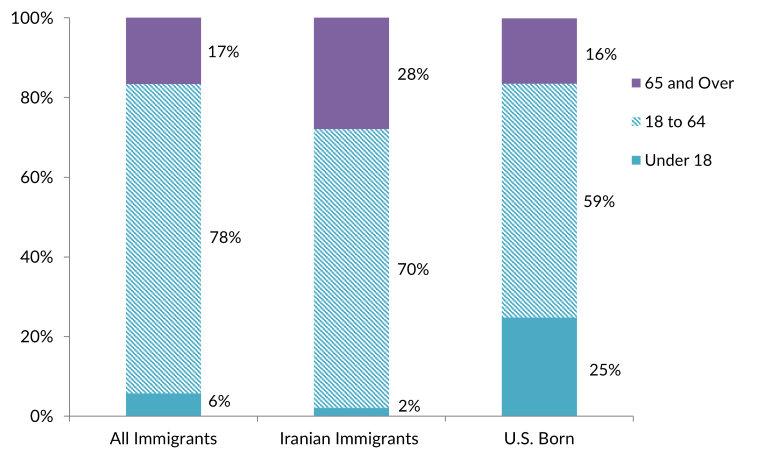
Note: Percentages may not add up to 100 as they are rounded to the nearest whole number.
Source: MPI tabulation of data from the U.S. Census Bureau 2019 ACS.
Iranian immigrants have much higher educational attainment relative to the U.S.-born and overall immigrant populations. In 2019, 59 percent of Iranians ages 25 or older reported having a bachelor’s degree or higher, compared to 33 percent of U.S.-born and immigrant adults. Only 7 percent of Iranian immigrants did not have a high school diploma or equivalent, compared to 26 percent of immigrants overall and 8 percent of the U.S. born.
The number of international students from Iran in the United States rose in the 1950s through the 1970s, peaking during school year (SY) 1979-80 (with Iranians representing 53,300, or 18 percent, of the 286,300 international students studying in the United States) before steeply declining in the years following the Islamic Revolution. The Iranian international student population bottomed out at 1,800 in SY 2000-01, but has slowly recovered and remained between 10,000 and 13,000 since SY 2013-14.
The majority of Iranian immigrant workers were in management, business, science, and arts occupations (62 percent), a much higher proportion than the U.S. born (41 percent) and all immigrants (35 percent). About 18 percent of Iranian-born workers were in sales and office occupations, followed by 9 percent in service occupations.
Figure 5. Employed Workers in the U.S. Civilian Labor Force (ages 16 and older) by Occupation and Origin, 2019
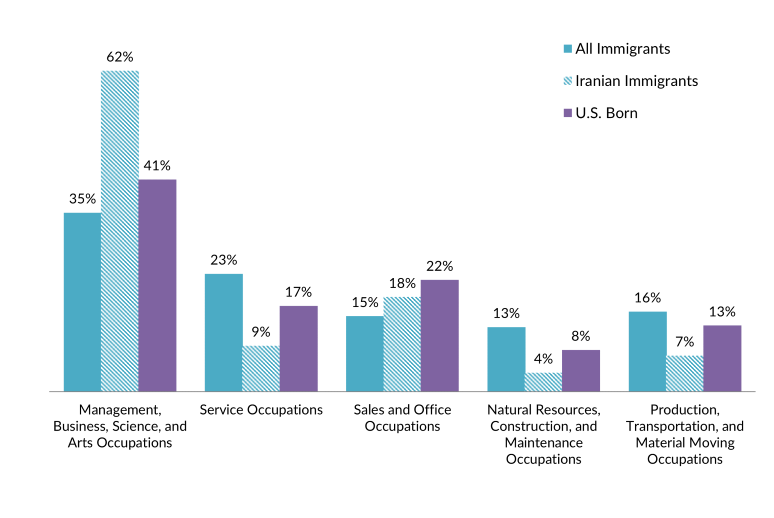
Note: Percentages may not add up to 100 as they are rounded to the nearest whole number.
Source: MPI tabulation of data from the U.S. Census Bureau 2019 ACS.
Iranian immigrants have significantly higher median household incomes relative to the overall immigrant and native-born populations. In 2019, Iranian immigrants reported a median household income of $79,000, compared to $64,000 and $66,000 for the total foreign-born and native populations, respectively.
In 2019, Iranian immigrants were as likely to be in poverty as the U.S.-born population (12 percent), a figure slightly lower than the 14 percent for all immigrants.
Immigration Pathways and Naturalization
Immigrants from Iran are more likely to be naturalized U.S. citizens than the overall foreign-born population. In 2019, 76 percent of Iranian immigrants were U.S. citizens, compared to 52 percent of all immigrants.
Iranian immigrants tend to have slightly longer years of residence in the United States than the overall immigrant population. Fifty-seven percent of Iranians entered the United States before 2000, compared to 51 percent of all immigrants. Twenty percent of Iranians entered between 2000 and 2009, and 23 percent entered the United States in 2010 or later.
Figure 6. Iranians and All Immigrants in the United States by Period of Arrival, 2019
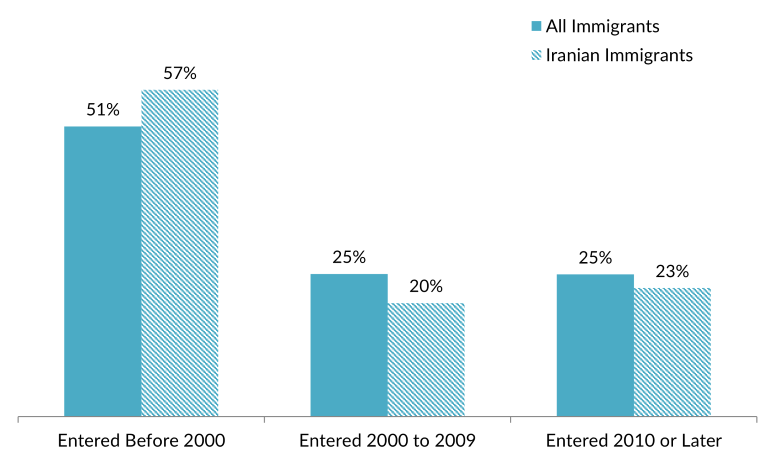
Note: Numbers are rounded to the nearest whole number and may not add to 100.
Source: MPI tabulation of data from the U.S. Census Bureau 2019 ACS.
The highest proportion of the 6,600 Iranian immigrants who became lawful permanent residents in 2019 did so through employment-based preferences (38 percent) and as refugees and asylees (32 percent). Twenty-seven percent of Iranian immigrants became permanent residents through family reunification channels.
Figure 7. Immigration Pathways of Iranian-Born and All Lawful Permanent Residents in the United States, 2019
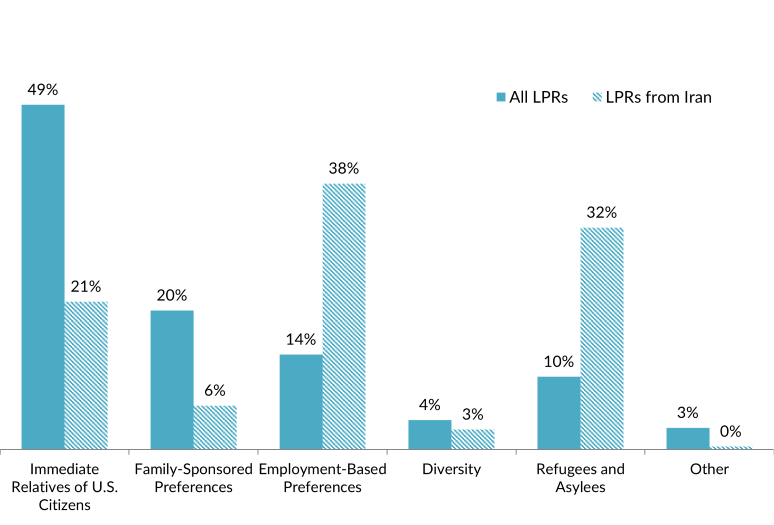
Notes: Immediate relatives of U.S. citizens include spouses, minor children, and parents of U.S. citizens. Family-sponsored preferences include adult children and siblings of U.S. citizens, and spouses and children of green-card holders. The Diversity Visa lottery refers to the program established by the Immigration Act of 1990 to allow immigrants from countries with low rates of immigration to enter the United States; the law states that 55,000 diversity visas in total are made available each fiscal year.
Source: MPI tabulation of data from the Department of Homeland Security (DHS), 2019 Yearbook of Immigration Statistics (Washington, DC: DHS Office of Immigration Statistics, 2020), available online.
Unauthorized Immigrant Population
The Migration Policy Institute (MPI) estimates that approximately 7,000 unauthorized immigrants from Iran resided in the United States as of 2018, accounting for less than 0.1 percent of the 11 million unauthorized immigrants in the country.
As of March 2021, approximately 50 unauthorized Iranian immigrant youth and young adults had Deferred Action for Childhood Arrivals (DACA) status, reflecting a small fraction of the 616,000 DACA recipients.
Click here to view the top origin countries of DACA recipients and their U.S. states of residence.
Iranian immigrants have levels of health insurance coverage close to those of the U.S.-born population. Iranians are less likely to lack health insurance than the total foreign-born population (6 percent versus 20 percent, respectively). Two-thirds (66 percent) of Iranian immigrants have private health insurance and 38 percent have public health insurance.
Figure 8. Health Coverage for Iranians, All Immigrants, and the U.S. Born, 2019
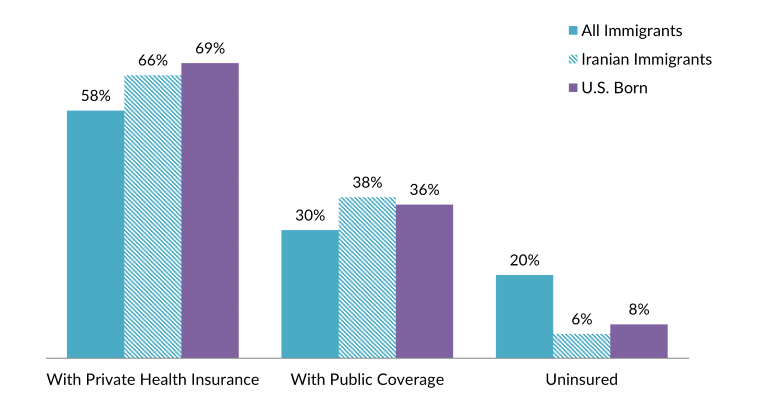
Note: The sum of shares by type of insurance is likely to be greater than 100 because people may have more than one type of insurance.
Source: MPI tabulation of data from the U.S. Census Bureau 2019 ACS.
The Iranian diaspora in the United States is comprised of more than 577,000 individuals who were either born in Iran or reported Iranian ancestry, according to tabulations from the U.S. Census Bureau 2019 ACS.
Click here to view the top 20 diaspora groups in the United States.
Global remittances to Iran peaked in the early and mid-1990s, reaching $1.6 billion in 1995, before dropping in the late 1990s. Iranians living abroad and others with connections to the country sent about $1.3 billion in remittances to Iran via formal channels in 2020, according to World Bank estimates. Remittances represented just 0.2 percent of Iran’s gross domestic product (GDP) in 2020.
Figure 9. Annual Remittance Flows to Iran, 1991-2020

Source: World Bank Prospects Group, “Annual Remittances Data,” May 2021 update, available online.
Sources
Bozorgmehr, Mehdi and Georges Sabagh. 1988. High Status Immigrants: A Statistical Profile of Iranians in the United States. Iranian Studies 21 (3-4): 5-36.
Gibson, Campbell J. and Kay Jung. 2006. Historical Census Statistics on the Foreign-Born Population of the United States: 1850-2000. Working Paper no. 81, U.S. Census Bureau, Washington, DC, February 2006. Available online.
Institute of International Education (IIE). 2020. International Students by Place of Origin, Selected Years, 1949/50 - 2019/20. Accessed July 8, 2021. Available online.
Modarres, Ali. 1998. Settlement Patterns of Iranians in the United States. Iranian Studies 31 (1): 31-49.
United Nations Population Division. N.d. International Migrant Stock by Destination and Origin. Accessed July 1, 2021. Available online.
U.S. Census Bureau. N.d. 2019 American Community Survey. Accessed July 5, 2021. Available online.
U.S. Citizenship and Immigration Services (USCIS). 2021. Count of Active DACA Recipients by Country of Birth as of March 31, 2021. Available online.
U.S. Department of Homeland Security (DHS), Office of Immigration Statistics. 2020. 2019 Yearbook of Immigration Statistics. Washington, DC: DHS Office of Immigration Statistics. Available online.
World Bank Prospects Group. 2021. Annual Remittances Data, May 2021 update. Available online.