

Korean Immigrants in the United States

A teacher leads a lesson on the Korean alphabet in a U.S. dual-language immersion class. (Photo: Allison Shelley for American Education: Images of Teachers and Students in Action)
The population of immigrants from the Korean peninsula in the United States is one of the rare large foreign-born groups to experience a stall in its growth, and even a decline, over the past decade, amid an aging population and booming economic opportunities and a demographic crunch in South Korea. Though the decline is far smaller than for the Mexican immigrant population in the United States, which shrank by almost 780,000 between 2010 and 2019, the Korean-born population fell from 1.1 million to 1,039,000 over the same period. By contrast, the overall immigrant population in the United States increased by 12 percent between 2010 and 2019.
Immigrants from the Korean peninsula, who come overwhelmingly from South Korea, represent the tenth largest immigrant population in the United States, making up slightly more than 2 percent of the 44.9 million immigrants in 2019, and are the fifth largest group from Asia.
Immigration from the Korean peninsula in the mid-20th century began in the aftermath of the Korean War, when more than 6,000 Korean women came as wives and fiancées of U.S. servicemen, a cohort sometimes known as the Korean War Brides. After the Immigration and Nationality Act of 1965 removed national-origin quotas strongly favoring European immigration, the Korean immigrant population grew significantly. Driven by political, economic, and military relations between South Korea and the United States in subsequent years, the population increased from just 11,000 in 1960 to 290,000 in 1980—an increase of 2,500 percent. The strong growth continued over the next two decades, with the population nearly doubling to 568,000 as of 2000 and again to a peak of 1.1 million immigrants in 2010 (see Figure 1).
Early waves of Koreans arriving in the United States were predominantly low-skilled agricultural workers, but more recent arrivals tend to be highly educated and earn high incomes compared to the overall immigrant and U.S.-born populations. South Koreans have consistently been among the top groups of international students in U.S. higher education institutions.
Figure 1. Korean Immigrant Population in the United States, 1980-2019
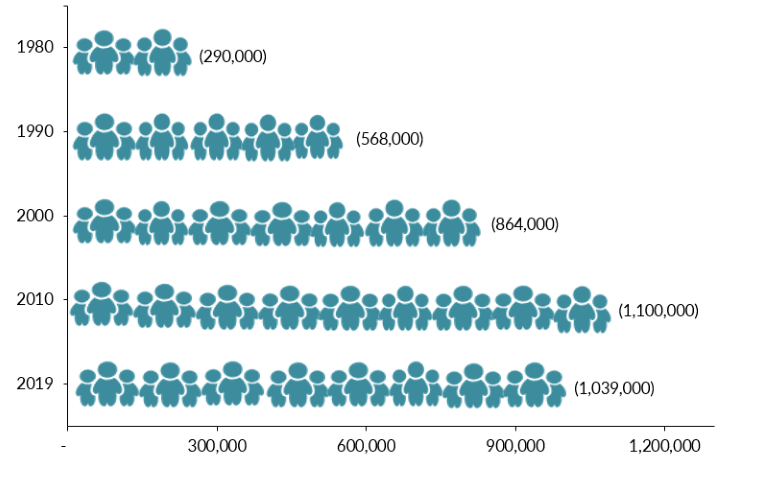
Source: Data from U.S. Census Bureau 2010 and 2019 American Community Surveys (ACS), and Campbell J. Gibson and Kay Jung, "Historical Census Statistics on the Foreign-born Population of the United States: 1850-2000" (Working Paper no. 81, U.S. Census Bureau, Washington, DC, February 2006), available online.
Although the Korean immigrant population has decreased slightly over the past several years, the United States remains home to the largest South Korean population in the world. Other top countries for South Korean immigrants are Japan (456,000), China (145,000), Canada (133,000), and Australia (123,000). Kazakhstan hosts the largest number of North Korean immigrants (65,000), followed by the United Kingdom and Russia (approximately 11,000 each) and the Philippines (6,000), according to mid-2020 estimates by the United Nations Population Division.
Click here to view an interactive map showing where migrants from the Korean peninsula and elsewhere have settled worldwide.
Most Korean immigrants in the United States are naturalized citizens, and the vast majority who have gained lawful permanent resident status (also known as holding a green card) have relied on sponsorship from an employer or immediate relative. Overall, compared to the total foreign-born population, Korean immigrants have higher incomes and educational attainment and are less likely to experience poverty or lack health insurance. However, they also have lower workforce participation rates than the overall immigrant population.
Using data from the U.S. Census Bureau (the 2019 American Community Survey [ACS] as well as pooled 2015-19 ACS data), the Department of Homeland Security’s 2020 Yearbook of Immigration Statistics, and World Bank annual remittance data, this Spotlight provides information on the Korean immigrant population in the United States, focusing on its size, geographic distribution, and socioeconomic characteristics.
Click on the bullet points below for more information:
- Distribution by State and Key Cities
- English Proficiency
- Age, Education, and Employment
- Income and Poverty
- Immigration Pathways and Naturalization
- Health Coverage
- Diaspora
- Remittances
Distribution by State and Key Cities
Almost half of all Korean immigrants resided in three states: California (30 percent), New York (8 percent), and New Jersey (7 percent). The top counties with Korean immigrants were Los Angeles County and Orange County in California, Bergen County in New Jersey, and Queens County in New York. Together, these four counties accounted for about 28 percent of the total Korean immigrant population in the United States.
Figure 2. Top States of Residence for Korean Immigrants in the United States, 2015-19
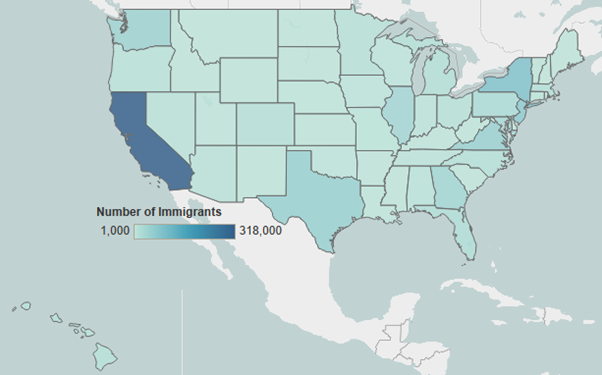
Note: Pooled 2015-19 ACS data were used to get statistically valid estimates at the state and metropolitan statistical area levels, for smaller-population geographies. Not shown is the population in Alaska, which is small in size; for details, visit the Migration Policy Institute’s (MPI) Migration Data Hub for an interactive map showing geographic distribution of immigrants by state and county, available online.
Source: MPI tabulation of data from U.S. Census Bureau pooled 2015-19 ACS.
Click here for an interactive map that shows the geographic distribution of immigrants by state and county. Select Korea from the dropdown menu to see which states and counties have the highest distributions of Korean immigrants.
In the 2015-19 period, nearly 40 percent of Korean immigrants were concentrated in the greater metropolitan areas of Los Angeles, New York, and Washington, DC.
Figure 3. Top Metropolitan Areas of Residence for Korean Immigrants in the United States, 2015-19
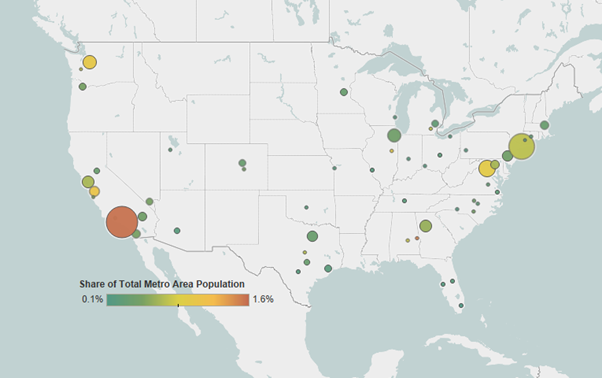
Source: MPI tabulation of data from the U.S. Census Bureau pooled 2015-19 ACS.
Click here for an interactive map that highlights the metropolitan areas with the highest concentrations of immigrant groups from Korea and elsewhere.
Table 1. Top Concentrations of Korean Immigrants by Metropolitan Area, 2015-19
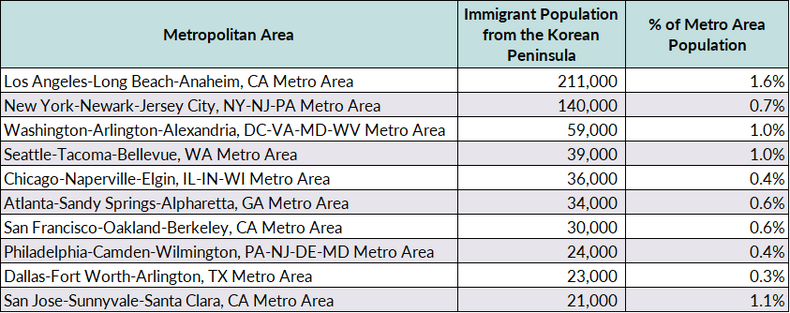
Source: MPI tabulation of data from the U.S. Census Bureau pooled 2015-19 ACS.
In 2019, 49 percent of Korean immigrants (ages 5 and older) reported having limited English proficiency, compared to about 46 percent of the total foreign-born population. However, a greater percentage of Korean immigrants reported speaking only English at home (20 percent) than the total immigrant population (16 percent).
Note: Limited English proficiency refers to those who indicated on the ACS questionnaire that they spoke English less than “very well.”
Age, Education, and Employment
Korean immigrants tend to be older than the overall foreign- and native-born populations. The median age of Korean immigrants was 49 in 2019, compared to 46 for the overall foreign-born population and 37 for the U.S. born. However, a greater share of Korean immigrants is of working age (between ages 18 and 64) than U.S.-born individuals, with 74 percent and 59 percent, respectively (see Figure 4).
Figure 4. Age Distribution of the U.S. Population by Origin, 2019
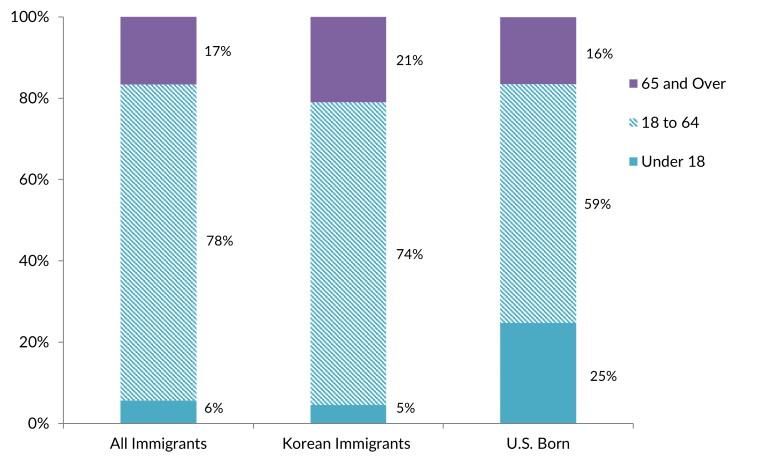
Source: MPI tabulation of data from the U.S. Census Bureau 2019 ACS.
Korean immigrants have high educational attainment compared to the overall foreign- and native-born populations. In 2019, 56 percent of Korean immigrants ages 25 or older held a bachelor’s degree or higher, compared to 33 percent of both the foreign- and U.S.-born populations.
South Korea has the third largest number of international students in the United States after China and India. In the 2020-21 school year, nearly 39,500 students from South Korea (and 2 students from North Korea) were enrolled in U.S. higher education institutions, according to the Institute of International Education, accounting for about 4 percent of the 914,000 foreign nationals studying in the United States.
In fiscal year (FY) 2021, South Koreans represented just under 1 percent (3,500) of the 407,000 H-1B petitions for high-skilled workers (initial and continuing employment) approved by U.S. Citizenship and Immigration Services (USCIS), the fourth largest nationality behind Indian nationals (who accounted for 73 percent of petitions), Chinese (12 percent), and Canadians (1 percent).
Korean immigrants participate in the civilian labor force at a lower rate (60 percent) than foreign-born individuals (67 percent) or the native born (62 percent). More than half of Korean immigrants with a job were employed in management, business, science, and arts occupations, compared to just 35 percent of all immigrants and 41 percent of natives. In contrast, far fewer Korean immigrants worked in natural resources, construction, and maintenance occupations (3 percent) and production, transportation, and material moving occupations (8 percent) than the other populations (see Figure 5).
Figure 5. Employed Workers in the U.S. Civilian Labor Force (ages 16 and older) by Occupation and Origin, 2019
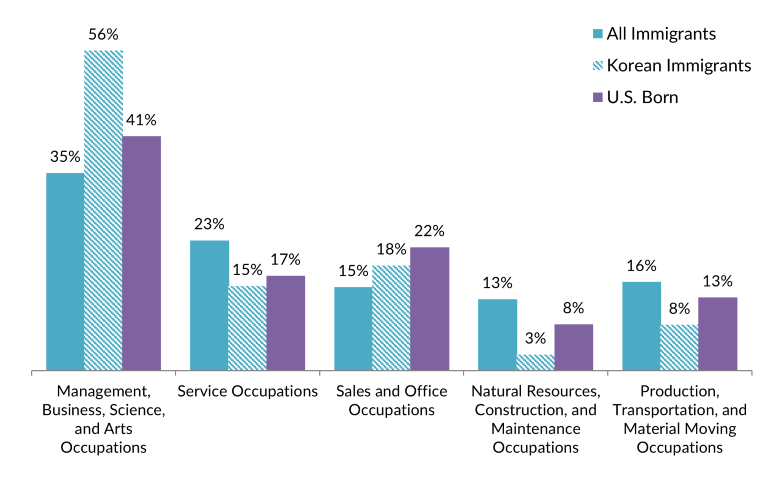
Source: MPI tabulation of data from the U.S. Census Bureau 2019 ACS.
Korean immigrants tend to have higher incomes than both the foreign- and native-born populations. In 2019, the median income of Korean immigrant households was nearly $72,000, compared to about $64,000 for all immigrant households and $66,000 for U.S.-born households.
In 2019, Korean immigrants experienced poverty at a rate comparable to that of U.S.-born individuals (with about 12 percent of each group living in poverty), but slightly less than immigrants overall (14 percent).
Immigration Pathways and Naturalization
A significant majority of Korean immigrants were naturalized U.S. citizens. Of the more than 1 million Korean immigrants in the United States in 2019, 66 percent (nearly 689,000) were naturalized citizens, compared to 52 percent of all immigrants.
Many Korean immigrants have been long settled. Sixty-one percent entered the United States before 2000 (see Figure 6).
Figure 6. Korean Immigrants and All Immigrants in the United States by Period of Arrival, 2019
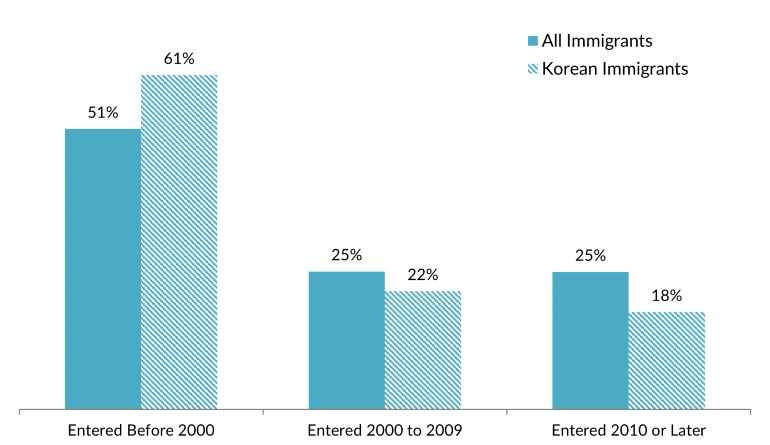
Source: MPI tabulation of data from the U.S. Census Bureau 2019 ACS.
In 2020, more than 16,200 Korean immigrants became lawful permanent residents (LPRs). Two-thirds (66 percent) obtained this status through employer sponsorship, and another 34 percent came via sponsorship by a family member who was a U.S. citizen or green-card holder. Almost no Korean immigrants were beneficiaries of the Diversity Visa Lottery or were humanitarian migrants (see Figure 7).
Figure 7. Immigration Pathways of Korean Immigrants and All Lawful Permanent Residents in the United States, 2020
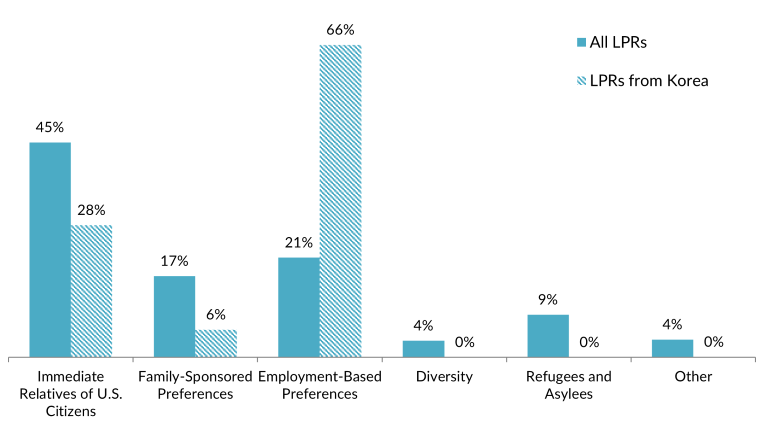
Notes: Immediate relatives of U.S. citizens include spouses, minor children, and parents of U.S. citizens. Family-sponsored preferences include adult children and siblings of U.S. citizens as well as spouses and children of green-card holders. The Diversity Visa lottery was established by the Immigration Act of 1990 to allow entry to immigrants from countries with low rates of immigration to the United States. The law states that 55,000 diversity visas in total are to be made available each fiscal year. Nationals of North Korea are eligible to apply for the most recent DV 2023 lottery, but nationals of South Korea are not.
Source: MPI tabulation of data from Department of Homeland Security (DHS), 2020 Yearbook of Immigration Statistics (Washington, DC: DHS Office of Immigration Statistics, 2022), available online.
There were approximately 173,000 Korean immigrants living in the United States without authorization as of 2019, according to Migration Policy Institute (MPI) estimates. They represented less than 2 percent of the estimated 11 million unauthorized immigrants in the country.
Click here for an interactive data tool showing top states and counties of residence for unauthorized immigrants in the United States by country or region of origin.
Approximately 5,700 unauthorized immigrants from South Korea were active participants in the Deferred Action for Childhood Arrivals (DACA) program, which provides temporary deportation relief and work authorization, as of December 2021, according to the most recent data from U.S. Citizenship and Immigration Services (USCIS). These individuals represented approximately 1 percent of the 611,500 DACA participants.
Click here for two interactive data tools showing MPI estimates of DACA-eligible unauthorized immigrant populations for top states and counties, and application rates by country of origin.
Korean immigrants were about half as likely to be uninsured as the overall immigrant population, but slightly more likely than the native-born population. In 2019, 69 percent of Korean immigrants held private health insurance, the same rate as the native-born population. By comparison, 58 percent of the entire immigrant population held private health insurance. Korean immigrants were slightly less likely than the U.S. born to have public health coverage (see Figure 8).
Figure 8. Health Insurance Coverage by Origin, 2019
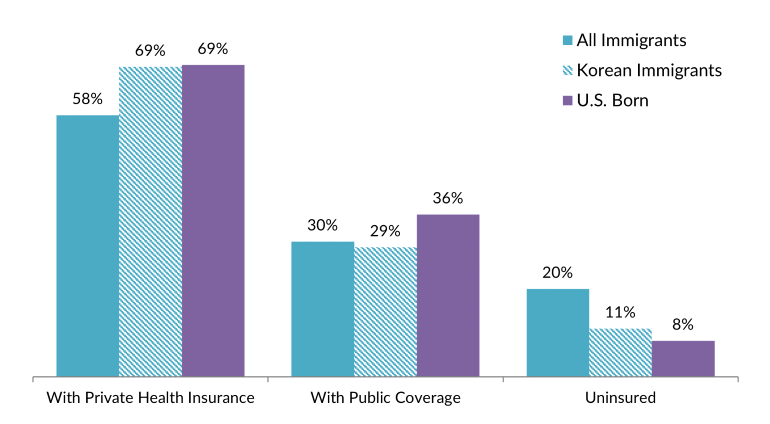
Note: The sum of shares by type of insurance is likely to be greater than 100 because people may have more than one type of insurance.
Source: MPI tabulation of data from the U.S. Census Bureau 2019 ACS.
The Korean diaspora in the United States is comprised of approximately 2 million individuals who were born in South Korea or North Korea or reported Korean ancestry or race, according to tabulations from the 2019 ACS, making it the 20th largest diaspora group in the United States.
Click here for a table showing the top 20 diasporas in the United States.
South Korea received $7.4 billion in global remittances via formal channels in 2020, up from $7.2 billion in 2019. Remittances accounted for 0.5 percent of South Korea’s gross domestic product (GDP). In 2020, remittances to South Korea were over three times larger than they were in 1990, according to data from the World Bank. (The World Bank does not maintain public data on remittances to North Korea.)
Figure 9. Annual Remittance Flows to South Korea, 1990-2020
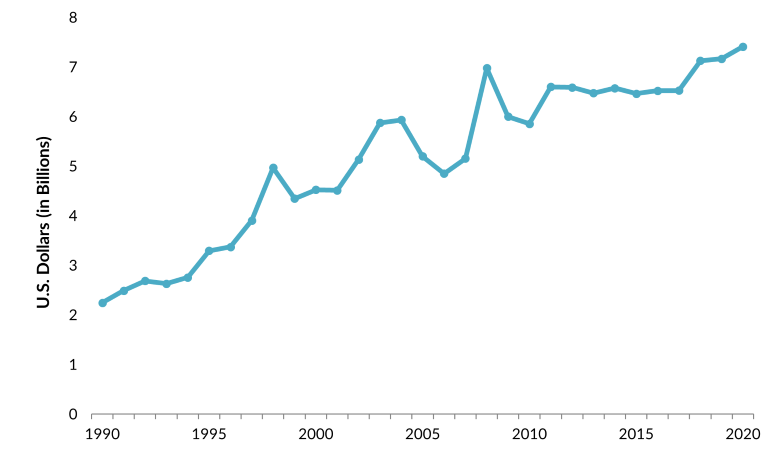
Note: The 2020 figure represents World Bank estimates.
Source: MPI tabulations of data from the World Bank Prospects Group, “Annual Remittances Data,” May 2021 update.
Visit the Migration Data Hub’s collection of interactive remittances tools, which track remittances by inflow and outflow, between countries, and over time.
Sources
Department of Homeland Security (DHS), Office of Immigration Statistics. 2022. 2020 Yearbook of Immigration Statistics. Washington, DC: DHS Office of Immigration Statistics. Available online.
Gibson, Campbell J. and Kay Jung. 2006. Historical Census Statistics on the Foreign-born Population of the United States: 1850-2000. Working Paper No. 81, U.S. Census Bureau, Washington, DC, February 2006. Available online.
Institute of International Education (IIE). 2021. Open Doors Report on International Educational Exchange. Washington, DC: IIE. Available online.
U.S. Census Bureau. 2020. 2019 American Community Survey. Accessed from Steven Ruggles, Katie Genadek, Ronald Goeken, Josiah Grover, and Matthew Sobek. Integrated Public Use Microdata Series: Version 11.0 [dataset]. Minneapolis: University of Minnesota. Available online.
---. 2020. 2019 American Community Survey. American FactFinder. Available online.
U.S. Citizenship and Immigration Services (USCIS). 2022. Characteristics of H-1B Specialty Occupation Workers: Fiscal Year 2021 Annual Report to Congress. Washington, DC: USCIS. Available online.
---. 2022. Count of Active DACA Recipients by Month of Current DACA Expiration as of December 31, 2021. Available online.
World Bank Prospects Group. 2021. Annual Remittances Data, May 2021 update. Available online.
Yu, Eui-Young. 1987. Korean-American Women: Demographic Profiles and Family Roles. In Korean Women in Transition: At Home and Abroad, eds. Eui-Young Yu and Earl H. Phillips. Los Angeles: Scholarly Resources Inc.