

Korean Immigrants in the United States

A Lunar New Year celebration in San Francisco, 2013. (Photo: --Mark--/Flickr)
Korean migration to the United States, which began in the early 20th century, has been motivated by a mix of political, military, and economic factors. As of 2013, approximately 1.1 million Korean immigrants (overwhelmingly from South Korea) resided in the United States, representing close to 3 percent of the 41.3 million foreign-born population.
Migration from the Korean peninsula to the United States occurred in three phases. The first wave (1903-05) comprised about 7,000 predominately uneducated male laborers employed on sugar plantations in Hawaii. The 1908 Gentleman’s Agreement between the United States and Japan curtailed the entry of U.S.-bound Japanese and Korean laborers (Korea was then a Japanese protectorate). Following the agreement, migration from Korea to the United States effectively halted with the exception of approximately 1,000 women, known as “picture brides,” who arrived between 1910 and 1924 to join prospective husbands. The Immigration Act of 1924 further restricted Korean (and other Asian) flows to the United States.
The second wave began in 1951 as a direct consequence of the Korean War and the U.S.-South Korean military alliance. The new arrivals were overwhelmingly young women and children of American servicemen, but also included war orphans, refugees, professionals, and students.
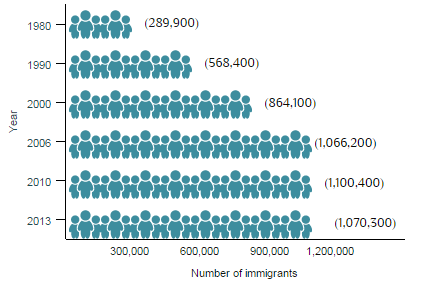
The U.S. Immigration Act of 1965, which emphasized family reunification and abolished national-origin quotas, marked the beginning of the third wave. Lack of job opportunities and political insecurity under military dictatorship prompted many Koreans to emigrate. The number of Korean immigrants living in the United States grew rapidly, more than tripling in the 1960s from 11,200 in 1960 to 38,700 in 1970. The Korean population increased even faster in the following decades, from 290,000 in 1980 to 568,400 in 1990 and 864,000 in 2000. A high proportion of third-wave Korean immigrants were well educated, emigrating to the United States in their prime working age to seek a better life, pursue education, and join family members.
|
Figure 1. Korean Immigrant Population in the United States, 1980-2013
|
|
Source: Data from U.S. Census Bureau 2006, 2010, and 2013 American Community Surveys (ACS), and Campbell J. Gibson and Kay Jung, "Historical Census Statistics on the Foreign-born Population of the United States: 1850-2000" (Working Paper no. 81, U.S. Census Bureau, Washington, DC, February 2006), www.census.gov/population/www/documentation/twps0029/twps0029.html. |
Today, South Korea sends the third most international students to the United States after China and India; more than 70,600 South Koreans studied in the United States in the 2012-13 school year. In recent years, Korean immigration to the United States has stagnated and declined due to improvement in the economic and political conditions in South Korea, with a small but growing number of Korean immigrants and their U.S.-born children returning to South Korea.
The majority of South Korean emigrants settle in the United States, with others heading to Japan (699,000), China (222,000), and Canada (136,000). Most North Korean emigrants settle in Kazakhstan (146,000), with others residing in Armenia (16,000), Uzbekistan (13,000), and Russia (10,000), according to mid-2013 estimates by the United Nations Population Division. Click here to view an interactive map showing where migrants from the Korean peninsula and other countries have settled worldwide.
Most Korean immigrants who obtain lawful permanent residence in the United States (also known as receiving a green card) qualify through employment sponsorship or as immediate relatives of U.S. citizens. Compared to the total foreign-born population, Korean immigrants were more likely to be college graduates, have higher incomes, and experience a lower poverty rate.
|
Definitions
|
|
|
Using data from the U.S. Census Bureau (the most recent 2013 American Community Survey [ACS] as well as pooled 2008-12 ACS data), the Department of Homeland Security’s Yearbook of Immigration Statistics, and World Bank annual remittance data, this Spotlight provides information on the Korean immigrant population in the United States, focusing on its size, geographic distribution, and socioeconomic characteristics.
Click on the bullet points below for more information:
- Distribution by State and Key Cities
- English Proficiency
- Educational and Professional Attainment
- Income and Poverty
- Immigration Pathways and Naturalization
- Health Coverage
- Diaspora
- Remittances
Distribution by State and Key Cities
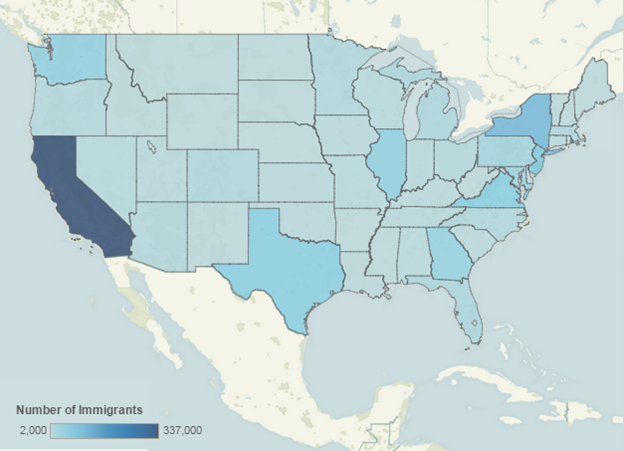
Most immigrants from Korea settled in California (31 percent), New York (10 percent), and New Jersey (6 percent). The top four counties with Korean immigrants were Los Angeles County and Orange County in California, Queens County in New York, and Bergen County in New Jersey. Together, the four counties accounted for about 29 percent of the total Korean immigrant population in the United States.
|
Figure 2. Top Destination States for Korean Immigrants in the United States, 2008-12
|
|
Source: Migration Policy Institute (MPI) tabulation of data from U.S. Census Bureau pooled 2008-12 ACS. |
Click here for an interactive map that shows the geographic distribution of immigrants by state and county. Select Korea from the dropdown menu to see which states and counties have the highest distributions of Korean immigrants.
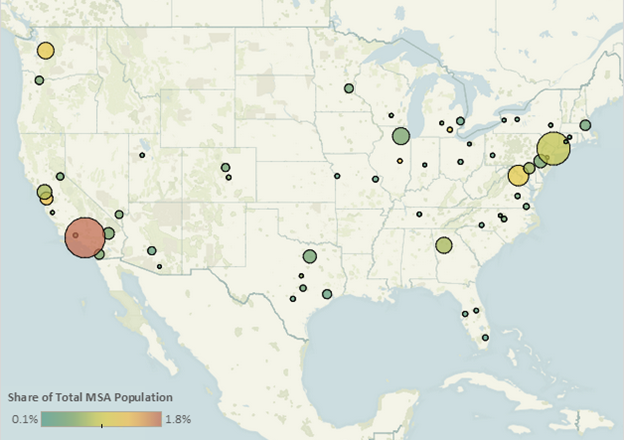
In the 2008-12 period, the U.S. cities with the greatest number of Korean immigrants were the Los Angeles, New York, and Washington D.C. metropolitan areas. These three metropolitan areas accounted for about 40 percent of Korean immigrants.
|
Figure 3. Top Destination Metropolitan Areas for Korean Immigrants in the United States, 2008-12
|
|
Source: MPI tabulation of data from the U.S. Census Bureau pooled 2008-12 ACS. |
|
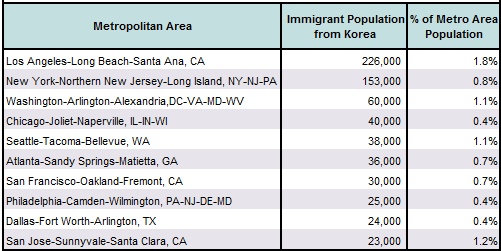
Table 1. Top Concentrations by Metropolitan Area for the Foreign Born from Korea, 2008-12
|
|
Source: MPI tabulation of data from the U.S. Census Bureau pooled 2008-12 ACS. |
Click here for an interactive map that highlights the metropolitan areas with the highest concentrations of immigrants. Select Korea from the dropdown menu to see which metropolitan areas have the highest concentrations of Korean immigrants.Source: MPI tabulation of data from the U.S. Census Bureau pooled 2008-12 ACS.
In 2013, about 53 percent of Korean immigrants (ages 5 and over) reported limited English proficiency, compared to 50 percent of the total foreign-born population.
Note: Limited English proficiency refers to those who indicated on the ACS questionnaire that they spoke English less than “very well.”
Educational and Professional Attainment
Korean immigrants had much higher levels of educational attainment compared to the overall foreign- and native-born populations. In 2013, 52 percent of Korean immigrants (ages 25 and over) had a bachelor’s degree or higher, compared to 28 percent of the total U.S. immigrant population and 30 percent of the native-born population.
The Korean immigrant population was slightly older than the overall immigrant population. The median age of Korean immigrants was 45 years, compared to 43 for the foreign-born population and 36 for the native-born population. In 2013, 77 percent of Korean immigrants were of working age (18 to 64), 16 percent were ages 65 and over, and 7 percent were under 18. In comparison, 80 percent of all immigrants in the United States were of working age, 14 percent were 65 and over, and 6 percent were under 18. Meanwhile, 60 percent of the native-born population was of working age, 14 percent was 65 and over, and 26 percent was under 18. Women accounted for a larger share of immigrants from Korea (57 percent) than among either the native or total foreign-born populations (about 50 percent each).
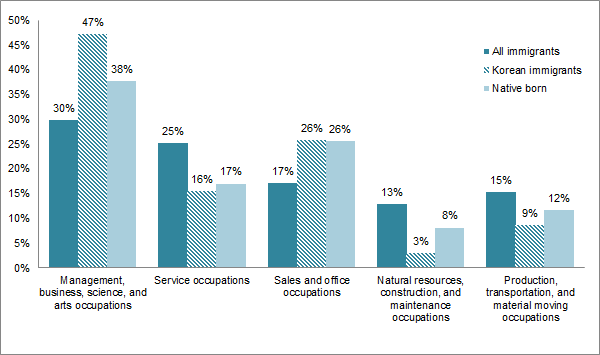
Korean immigrants participate in the labor force at a lower rate than the overall immigrant and native-born populations. In 2013, about 59 percent of Korean immigrants (ages 16 and over) were in the civilian labor force, compared to 67 percent and 63 percent of the overall foreign- and native-born populations respectively. Nearly half of all working-age Korean immigrants were employed in management, business, science, and arts occupations (47 percent), more than either foreign-born (30 percent) or native-born adults (38 percent). In contrast, Korean immigrants were less likely to be employed in natural resources, construction, and maintenance occupations (3 percent) or production, transportation, and material moving occupations (9 percent) compared to the other two groups.
|
Figure 4. Employed Workers in the Civilian Labor Force (ages 16 and older) by Occupation and Origin, 2013
|
|
Source: MPI tabulation of data from the U.S. Census Bureau 2013 ACS. |
Korean immigrants had higher incomes than the overall foreign- and native-born populations. In 2013, median household income among Korean immigrants was $55,800, compared to $48,100 and $53,000 for the immigrant and native-born populations, respectively.
The poverty rate among Korean immigrants was much lower than for the foreign-born population. In 2013, 11 percent of Korean immigrant families lived in poverty, compared to 18 percent and 10 percent for the foreign- and native-born populations, respectively.
Immigration Pathways and Naturalization
Sixty percent of the 1.1 million Korean immigrants in the United States in 2013 were naturalized U.S. citizens—much higher than the 47 percent naturalization rate among the overall immigrant population.
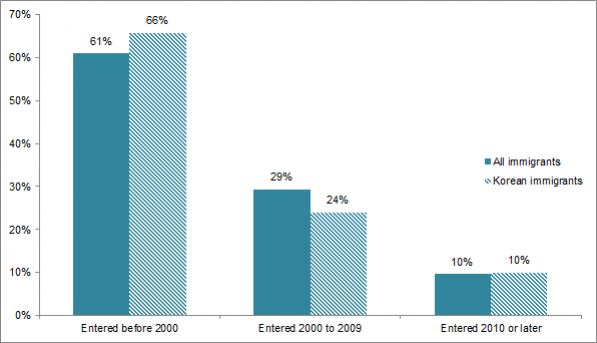
Most Korean immigrants (66 percent) arrived prior to 2000, followed by 24 percent who arrived between 2000 and 2009, and 10 percent in 2010 and after. Meanwhile, 61 percent of all immigrants to the United States arrived prior to 2000, 29 percent between 2000 and 2009, and 10 percent in 2010 or later.
|
Figure 5. Korean and All Immigrants in the United States by Period of Arrival, 2013
|
|
Source: MPI tabulation of data from the U.S. Census Bureau 2013 ACS. |
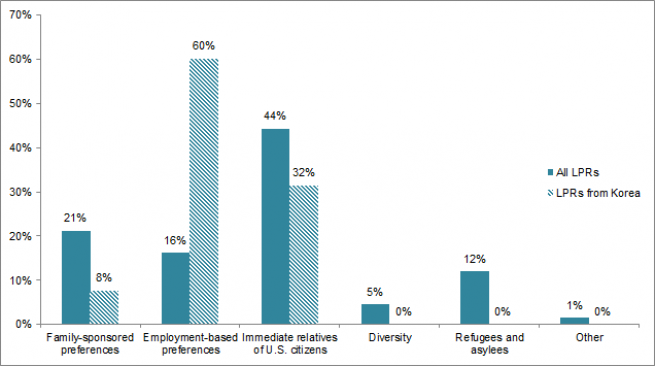
In 2013, the majority of Korean immigrants who became lawful permanent residents (LPRs) in the United States were sponsored either by employers (60 percent) or immediate relatives of U.S. citizens (32 percent). Korean immigrants were much less likely to get a green card via the Diversity Visa Lottery (less than 0.5 percent) compared to the overall LPR population (5 percent). Similarly, virtually no Koreans obtained LPR status as refugees, compared to 12 percent of the total LPR population.
|
Figure 6. Immigration Pathways of Korean Immigrants and All Immigrants in the United States, 2013
|
|
Notes: Family-sponsored: Includes adult children and siblings of U.S. citizens as well as spouses and children of green-card holders. Immediate relatives of U.S. citizens: Includes spouses, minor children, and parents of U.S. citizens. Diversity Visa Lottery: The Immigration Act of 1990 established the Diversity Visa Lottery to allow entry to immigrants from countries with low rates of immigration to the United States. The law states that 55,000 diversity visas are made available each fiscal year. Source: MPI tabulation of data from Department of Homeland Security (DHS), 2013 Yearbook of Immigration Statistics (Washington, DC: DHS Office of Immigration Statistics, 2014), www.dhs.gov/yearbook-immigration-statistics-2013-lawful-permanent-residents. |
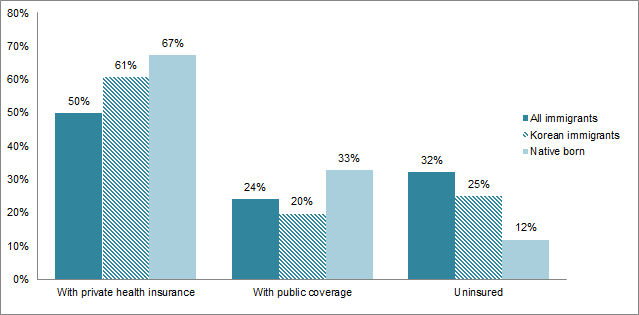
Korean immigrants were more likely to have private health insurance coverage (61 percent) and less likely to have public health coverage (20 percent) than the total foreign-born population. In addition, they were also less likely to be uninsured (25 percent) compared to the overall immigrant population (32 percent).
|
Figure 7. Health Coverage for Korean Immigrants, All Immigrants, and the Native Born, 2013
|
|
Note: The sum of shares by type of insurance is likely to be greater than 100 because people may have more than one type of insurance. Source: MPI tabulation of data from the U.S. Census Bureau 2013 ACS. |
The Korean diaspora population in the United States is comprised of approximately 1.8 million individuals who were either born on the Korean peninsula or reported Korean ancestry, according to tabulations from the U.S. Census Bureau pooled 2008-12 ACS.
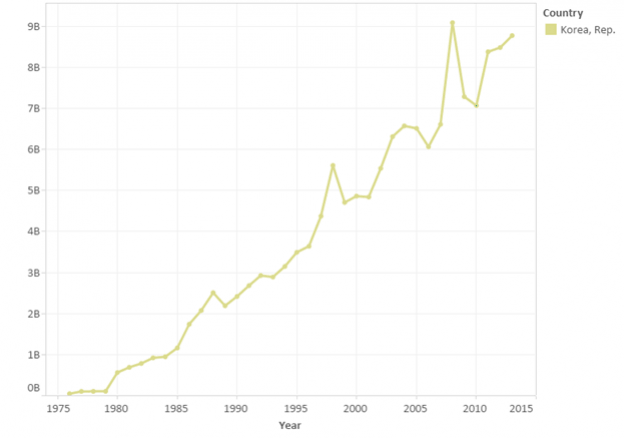
Global remittances sent to South Korea via formal channels equaled $8.8 billion in 2013, representing about 1 percent of the country’s gross domestic product (GDP), according to data from the World Bank. Remittances to South Korea have increased nearly four-fold since 1990.
|
Figure 8. Annual Remittance Flows to South Korea, 1979-2013
|
|
Source: MPI tabulations of data from the World Bank Prospects Group, “Annual Remittances Data,” October 2014 update. |
Visit the Data Hub’s collection of interactive remittances tools, which track remittances by inflow and outflow, between countries, and over time.
Editor's Note: This article was amended on March 23, 2015 to correct the statistics for private health insurance coverage depicted in Figure 7.
Sources
Choy, Bong-Youn. 1979. Koreans in America. Chicago: Nelson Hall.
Department of Homeland Security (DHS), Office of Immigration Statistics. 2014. 2013 Yearbook of Immigration Statistics. Washington, DC: DHS Office of Immigration Statistics. Available Online.
Gibson, Campbell J. and Kay Jung. 2006. Historical Census Statistics on the Foreign-born Population of the United States: 1850-2000. Working Paper no. 81, U.S. Census Bureau, Washington, DC, February 2006. Available Online.
Hurh, Won Moo. 1998. The Korean Americans. Westport: Greenwood Press.
Institute of International Education. 2014. 2013 Fast Facts. OpenDoors Data. Available Online.
Min, Pyong Gap. 2006. Korean Americans. In Asian Americans: Contemporary Trends and Issues, ed. Pyong Gap Min. Thousand Oaks, CA: Pine Forge Press.
U.S. Census Bureau. 2010. 1850-2000 Decennial Census and 2000-2012 ACS. Accessed from Steven Ruggles, J. Trent Alexander, Katie Genadek, Ronald Goeken, Matthew B. Schroeder, and Matthew Sobek. Integrated Public Use Microdata Series: Version 5.0 [Machine-readable database]. Minneapolis: University of Minnesota, 2010. Available Online.
———. 2014. 2013 American Community Survey. American FactFinder. Available Online.
World Bank Prospects Group. 2013. Annual Remittances Data, October 2014 update. Available Online.