

Mexican Immigrants in the United States

Click here for larger version of map.
Source Spotlights are often updated as new data become available. Please click here to find the most recent version of this Spotlight.
The 1980 census recorded the foreign born from Mexico as the largest immigrant group in the United States, and this group remains the largest today. In 2006, more than 11.5 million Mexican immigrants resided in the United States, accounting for 30.7 percent of all US immigrants and one-tenth of the entire population born in Mexico.
While Mexican immigrants are still settling in "traditional" destination states like California and Texas, over the last 10 to 15 years, the foreign born from Mexico, like other immigrant groups, have begun moving to "nontraditional" settlement areas. These include states in the South, such as Georgia and North Carolina, as well as Midwestern states, such as Nebraska and Ohio (for more information on immigrants by state, please see the 2006 ACS/Census Data Tool on the MPI Data Hub).
This spotlight focuses on the foreign born from Mexico residing in the United States, examining the population's size, geographic distribution, and socioeconomic characteristics using data from the US Census Bureau's 2006 American Community Survey (ACS) and 2000 Decennial Census, and the Department of Homeland Security's Office of Immigration Statistics (OIS).
Click on the bullet points below for more information:
Size and Distribution
- Mexican immigrants represented the largest single immigrant group residing in the United States in 2006.
- More than 83 percent of the Mexican born resided in just 10 states.
- More than seven in 10 immigrants residing in the state of New Mexico in 2006 were Mexican born.
- The size of the Mexican immigrant populations in South Dakota, Louisiana, Alaska, and Ohio more than doubled between 2000 and 2006.
Demographic and Socioeconomic Overview
|
|
||
|
- More than a quarter of all Mexican foreign born in the United States arrived in 2000 or later.
- Three-quarters of Mexican immigrants in 2006 were adults of working age.
- Men accounted for the majority of the Mexican-born population living in the United States in 2006.
- About one in five Mexican immigrants were naturalized US citizens in 2006.
- Nearly 75 percent of Mexican immigrants in 2006 were limited English proficient.
- Three in five Mexican immigrants had no high school degree.
- Mexican immigrant men were more likely to participate in the civilian labor force than foreign-born men overall and Mexican immigrant women.
- Forty percent of Mexican-born men were employed in construction, extraction, or transportation occupations.
Legal and Unauthorized Mexican Immigrant Population
- The Mexican born accounted for about 27 percent of all lawful permanent residents living in the United States in 2006.
- Almost nine in 10 Mexican-born lawful permanent residents were family-sponsored immigrants.
- Mexican-born lawful permanent residents accounted for nearly a third of all those eligible to naturalize as of 2006.
- In 2006, more than half of all unauthorized immigrants in the United States were from Mexico.
Size and Distribution
Mexican immigrants represented the largest single immigrant group residing in the United States in 2006.
There were 11.5 million foreign born from Mexico residing in the United States in 2006. The population has increased more than fivefold since 1980, when the decennial census counted 2.2 million Mexican immigrants. Up until 1980, the foreign born from Mexico ranked behind foreign-born groups from Europe and Canada in terms of size (see Table 1). The 2.2 million Mexican born in 1980 were almost similar in size compared to the next three origin groups combined: German born (849,384), Canadian born (842,859), and Italian born (831,922).
The share of the foreign born represented by Mexican immigrants doubled from 7.9 percent in 1970 to 15.6 percent in 1980 and then almost doubled again to 30.7 percent by 2006 (see Table 1; see also the pie charts showing the top 10 countries of birth of immigrants residing in the United States over time here).
|
|
||||||||||||||||||||||||||||||||||||||||||
|
||||||||||||||||||||||||||||||||||||||||||
More than 83 percent of the Mexican born resided in just 10 states.
California had the largest number of foreign-born residents from Mexico (4,396,435) in 2006, followed by Texas (2,339,715) and Illinois (724,845).
The remaining seven states with the largest numbers of Mexican immigrants include Arizona (608,645), Florida (303,345), Georgia (276,494), Colorado (254,844), North Carolina (254,830), Nevada (230,314), and New York (230,299). Together, these 10 states accounted for 83.3 percent (or 9,619,766) of all Mexican-born residents in the United States in 2006.
Los Angeles-Long Beach-Santa Ana, CA is the metropolitan area with the largest number of Mexican born (1,902,623 or 16.5 percent), followed by Chicago-Naperville-Joliet, IL-IN-WI (699,447 or 6.1 percent) and Dallas-Fort Worth-Arlington, TX (607,180 or 5.3 percent). These three metropolitan areas accounted for 27.9 percent of the 11.5 million Mexican immigrants in 2006.
The top 15 metropolitan areas for Mexican immigrants were home to more than 6.6 million Mexican immigrants in 2006 (see Map 1).
 |
Map 1. State Proportion of the Mexican Born Population in the United States (PDF) |
Please note: Due to compatibility issues, you may need to download the map to your computer in order for it to load properly.
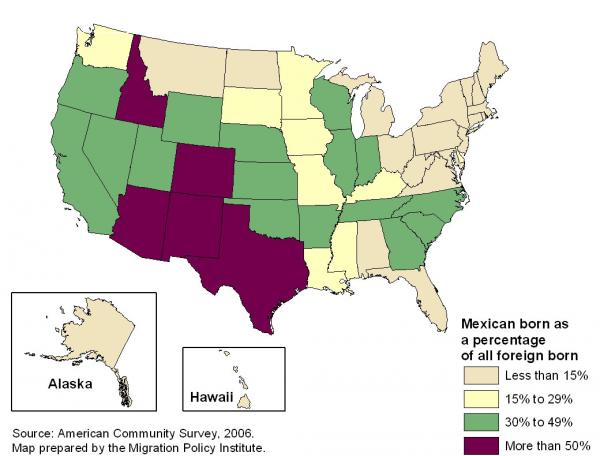
More than seven in 10 immigrants residing in the state of New Mexico in 2006 were Mexican born.
Mexican immigrants accounted for a large share of the total immigrant population in Western and Southwestern states (see Map 2). The Mexican foreign born made up 72.8 percent of all immigrants in New Mexico, 65.5 percent of all immigrants in Arizona, 62.5 percent of all immigrants in Texas, and 57.6 percent of all immigrants in Idaho.
By contrast, Mexican-born individuals accounted for only 1.3 percent of the immigrant populations of Maine and Massachusetts and less than 1 percent of Vermont's foreign-born population.
|
|
||
|
The size of the Mexican immigrant populations in South Dakota, Louisiana, Alaska, and Ohio more than doubled between 2000 and 2006.
The states that experienced the largest increases in their Mexican foreign-born populations between 2000 and 2006 included mainly states that had relatively smaller numbers of Mexican immigrants in 2000.
The top five states with the largest percent change in their Mexican immigrant populations were South Dakota (151.3 percent, from 1,399 in 2000 to 3,516 in 2006), Louisiana (130.6 percent, from 9,321 to 21,496), Alaska (129.7 percent, from 2,743 to 6,301), Ohio (110.1 percent, from 20,551 to 43,178), and New Jersey (86.9 percent, from 67,667 to 126,488).
Demographic and Socioeconomic Overview
More than a quarter of all Mexican foreign born in the United States arrived in 2000 or later.
Of the total 11.5 million Mexican foreign-born in the United States in 2006, 27.9 percent entered the country in 2000 or later, 34.1 percent between 1990 and 1999, 20.4 percent between 1980 and 1989, 11.5 percent between 1970 and 1979, and the remaining 6.0 percent entered prior to 1970.
Three-quarters of Mexican immigrants in 2006 were adults of working age.
Of the Mexican immigrants residing in the United States in 2006, 10.1 percent were minors (under age 18), 78.3 percent were of working age (between ages 18 and 54), and 11.6 percent were seniors (age 55 or older).
Of the foreign-born population in the United States in 2006, 8.1 percent were minors, 60.2 percent were of working age, and 22.1 percent were seniors.
Men accounted for the majority of the Mexican-born population living in the United States in 2006.
Of all Mexican immigrants residing in the country in 2006, 55.9 percent were men while women accounted for 44.1 percent.
About one in five Mexican immigrants were naturalized US citizens in 2006.
Among the Mexican foreign born, 21.7 percent were naturalized US citizens in 2006, compared to 42.0 percent among the overall foreign-born population.
Nearly 75 percent of Mexican immigrants in 2006 were limited English proficient.
Only 2.9 percent of the 11.4 million Mexican immigrants age 5 and older reported speaking "English only" while 22.7 percent reported speaking English "very well." In contrast, 74.5 percent reported speaking English less than “very well,” which is higher than the 52.4 percent reported among all foreign born age 5 and older.
(Note: The term limited English proficient refers to any person age 5 and older who reported speaking English "not at all," "not well," or "well" on their survey questionnaire. Individuals who reported speaking only English or speaking English "very well" are considered proficient in English).
Three in five Mexican immigrants had no high school degree.
In 2006, 60.2 percent of the 8.9 million Mexican-born adults age 25 and older had no high school diploma or the equivalent general education diploma (GED), compared to 32.0 percent among the 30.9 million foreign-born adults.
On the other end of the education continuum, only 5.0 percent of Mexican immigrants had a bachelor's or higher degree, compared to 26.7 percent among all foreign-born adults.
Mexican immigrant men were more likely to participate in the civilian labor force than foreign-born men overall and Mexican immigrant women.
Of Mexican-born men age 16 and older (5.9 million) in 2006, 85.7 percent were engaged in the civilian labor force compared to 79.3 percent of all foreign-born men. In contrast, Mexican foreign-born women age 16 and older (4.6 million) were less likely to be in the civilian labor force (50.2 percent) than foreign-born women overall (55.1 percent).
Forty percent of Mexican-born men were employed in construction, extraction, or transportation occupations.
Among the 4.9 million Mexican-born male workers age 16 and older employed in the civilian labor force, 40.2 percent reported working in construction, extraction, or transportation occupations. This is a higher percentage than among all foreign-born male workers (26.8 percent) (see Table 2).
Both Mexican foreign-born men and women were significantly less likely to be employed as managers, scientists, or engineers than foreign-born men and women overall, but they were more likely to be working in service or farming occupations.
|
|
|||||||||||||||||||||||||||||||||||||||||||||||||||||||||||||||||||||||||||||||||||||||||||||||||
|
|||||||||||||||||||||||||||||||||||||||||||||||||||||||||||||||||||||||||||||||||||||||||||||||||
Legal and Unauthorized Mexican Immigrant Population
The Mexican born accounted for about 27 percent of all lawful permanent residents living in the United States in 2006.
According to OIS data, the Mexican born accounted for 27.3 percent (3.3 million) of the 12.1 million lawful permanent residents (LPRs, also known as green card holders) living in the United States in 2006. The two next-largest LPR groups were the Filipino born (4.5 percent or 540,000) and Indian born (4.2 percent or 510,000).
In 2007, there were 148,640 Mexican born who were granted LPR status. They made up 14.1 percent of the 1.1 million foreign nationals who became LPRs in 2007.
Almost nine in 10 Mexican-born lawful permanent residents were family-sponsored immigrants.
Of the 148,640 Mexican-born LPRs in 2007, 58.8 percent (87,466) were immediate relatives of US citizens, 30.6 percent (45,422) were other family-sponsored immigrants, 8.0 percent (11,900) were employment-sponsored immigrants and their immediate family members, and 2.6 percent (3,852) were other categories of LPRs.
Mexican-born lawful permanent residents accounted for nearly a third of all those eligible to naturalize as of 2006.
Mexican-born LPRs are the largest group of permanent residents eligible to naturalize. According to OIS estimates, of the 8.3 million LPRs eligible to apply for citizenship as of 2006, 2.7 million (32.1) percent were born in Mexico.
OIS also reports that compared to LPRs from Asia and Europe, Mexican LPRs have been historically slower to naturalize.
In 2006, more than half of all unauthorized immigrants in the United States were from Mexico.
OIS has estimated that there were about 11.5 million unauthorized migrants in 2006; 6.6 million or 57.0 percent were Mexican born.
For information about ACS methodology, sampling error, and nonsampling error, click here.
Sources
Baker, Bryan. 2007. Trends in Naturalization Rates. December 2007. US Department of Homeland Security, Office of Immigration Statistics. Available online.
Hoefer, Michael, Nancy Rytina, and Christopher Campbell. 2007. Estimates of the Unauthorized Immigrant Population Residing in the United States: January 2006. August 2007. US Department of Homeland Security, Office of Immigration Statistics. Available online.
Rytina, Nancy. 2008. Estimates of the Legal Permanent Resident Population in 2006. February 2008. US Department of Homeland Security, Office of Immigration Statistics. Available online.
US Census Bureau. 2006 American Community Survey. Accessed from Steven Ruggles, Matthew Sobek, Trent Alexander, et al., Integrated Public Use Microdata Series: Version 3.0. Minneapolis, MN: Minnesota Population Center, 2004.
US Department of Homeland Security, Office of Immigration Statistics. 2007 Yearbook of Immigration Statistics, Table 3: Persons Obtaining Legal Permanent Resident Status by Region and Country of Birth: Fiscal Years 1998 to 2007. Available online.