

Mexican Immigrants in the United States
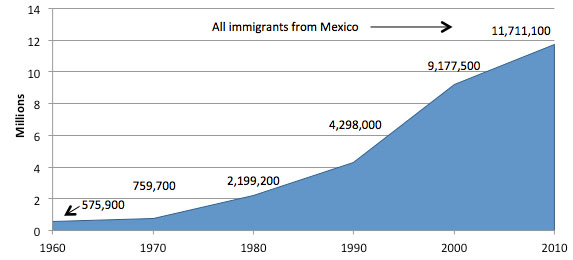
Over the past five decades, the single largest origin group of Latin American immigrants in the United States has been from Mexico. The number of Mexican immigrants living in the United States rose rapidly from 1960 to 2000—nearly tripling during the 1970s and doubling during both the 1980s and 1990s. The Mexican-born share of the U.S. immigrant population has steadily increased since 1960, topping out at 30 percent by 2000. However, the rates of growth of both the Mexican born's overall number and share have slowed considerably since the onset of the economic recession at the end of 2007.
Compared to other immigrant groups in the United States, Mexican immigrants were less likely to enter as refugees; more likely to become lawful permanent residents (LPRs) as immediate family members of U.S. citizens and LPRs; more likely to enter the United States without authorization; reported having lower levels of English proficiency and education; and were more likely to be of working age.
This article reports on a wide range of characteristics of Mexican immigrants residing in the United States, including the population's size, geographic distribution, admission categories, and demographic and socioeconomic characteristics. Data are from the U.S. Census Bureau's 2011 American Community Survey (ACS), the 2000 Decennial Census (as well as earlier censuses), and the Department of Homeland Security's (DHS) Office of Immigration Statistics (OIS).
Size and Geographic Distribution
- In 2011, nearly 11.7 million Mexican immigrants resided in the United States, representing close to 4 percent of the U.S. population.
- Over the past five decades, the Mexican born were the single largest origin group of Latin American immigrants in the United States.
- Over half of all Mexican immigrants resided in just two states: California and Texas.
- Over one-quarter of all Mexican-born immigrants lived in three major metropolitan areas: greater Los Angeles, Chicago, and Dallas.
|
Definitions
|
||
|
Modes of Entry and Legal Status
- In 2011, more than 143,000 Mexican-born immigrants were granted U.S. lawful permanent residency (LPR status, also known as obtaining a green card).
- Mexican nationals accounted for only 1 percent of persons granted asylum in 2011.
- More than 94,000 Mexican-born immigrants became U.S. citizens through naturalization in 2011.
- The share of Mexican-born immigrants who have naturalized (24 percent) is less than the 45 percent share of all U.S. immigrants who have naturalized.
- Over 80 percent of Mexican-born green card holders in 2011 were eligible to naturalize.
- In early 2011, 59 percent of all unauthorized immigrants in the United States were from Mexico.
Demographic and Socioeconomic Overview
- Mexican immigrant men outnumbered women in 2011.
- The foreign born from Mexico were more likely to be of working age than the U.S. born and foreign born overall.
- Less than one-third of all Mexican immigrants had strong English-language skills.
- As a group, Mexican-born adults were less likely to be university graduates compared to all immigrant adults.
- Mexican-born immigrants have generally mirrored the arrival patterns of the foreign born overall.
- Over 34 percent of employed Mexican-born men worked in construction, extraction, and transportation, while 39 percent of Mexican women worked in service and personal care occupations.
- The Mexican born were more likely to live in poverty in 2011 than the native or foreign born overall.
- About 7.2 million children under the age of 18 resided in a household with at least one immigrant parent born in Mexico.
Size and Geographic Distribution
In 2011, nearly 11.7 million Mexican immigrants resided in the United States, representing close to 4 percent of the U.S. population.
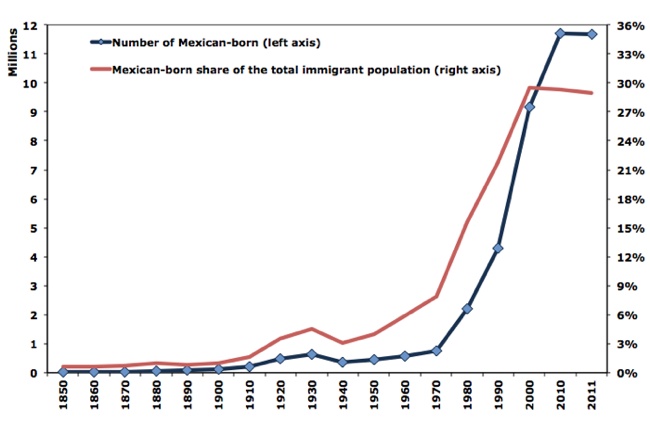
Mexican-born immigrants accounted for 29 percent (11.7 million) of the country's 40.4 million immigrants in 2011, and close to 4 percent of the U.S. population of 311.6 million. This population has grown 20 times its size since 1960, when about 576,000 Mexican immigrants resided in the country, or less than 6 percent of all immigrants living in the United States in that year.
As shown in Table 1, the single largest origin group from Latin America since 1960 has been from Mexico. From 1960 to 2011, the number of Mexican immigrants in the United States and their share of the U.S. immigrant population increased rapidly; however, the rate of change has slowed substantially since the onset of the economic recession in late 2007. Contrary to trends in the previous four decades, the Mexican-born share of all immigrants in the United States has not increased since 2000, instead remaining roughly around 29 percent.
|
Mexican Born Residing in the United States, 1850 to 2011
|
||
|
|
|
|||||||||||||||||||||||||||||||||||||||||||||||||||||
|
|||||||||||||||||||||||||||||||||||||||||||||||||||||
Over the past five decades, the Mexican born were the single largest origin group of Latin American immigrants in the United States.
The 11.7 million Mexican born (55 percent of the 21.2 million Latin Americans) comprised the largest immigrant group from Latin America, ahead of those from the Caribbean (18 percent, or 3.8 million), Central America (15 percent, or 3.1 million), and South America (13 percent, or 2.7 million). Although their share has fluctuated somewhat since 1960, the Mexico born have remained the single largest origin group of Latin American immigrants in the United States (see Table 1).
|
|
||
|
Over half of all Mexican immigrants resided in two states: California and Texas.
California had the largest number of Mexican immigrants in 2011 (4.3 million, or 37 percent of the nation's 11.7 million Mexican born), followed by Texas (2.5 million, or 21 percent).
Other states with Mexican-born populations greater than 500,000 were Illinois (711,000, or 6 percent) and Arizona (512,000, or 4 percent).
Mexican-born immigrants account for a large proportion of the total immigrant population in many states. Around 71 percent of New Mexico's immigrant population (151,000 out of 211,000) were born in Mexico, as were 60 percent (2.5 million out of 4.2 million) in Texas; and 59 percent (512,000 out of 872,000) in Arizona.
Over one-quarter of all Mexican-born immigrants lived in three major metropolitan areas: greater Los Angeles, Chicago, and Dallas.
In 2011, the greater Los Angeles metropolitan area had the largest number of Mexican immigrants, with about 1.7 million (15 percent of Mexican born in the United States). The greater Chicago area was second with 684,000 (6 percent). The greater Dallas area was third with 610,000 (5 percent).
Other metropolitan areas with Mexican-born populations greater than 300,000 were Houston, TX (595,000, or 5 percent); Riverside, CA (543,000, or 5 percent); Phoenix, AZ (349,000, or 5 percent); San Diego, CA (336,000, or 3 percent); and New York, NY (331,000, or 3 percent).
Modes of Entry and Legal Status
Note: This section is based on data from the Department of Homeland Security (DHS), unless stated otherwise. DHS data refer to the U.S. government's fiscal year, October 1 through September 30. Thus, "2011" refers to October 1, 2010 through September 30, 2011.
In 2011, more than 143,000 Mexican-born immigrants were granted U.S. lawful permanent residency (LPR status, also known as obtaining a green card).
In 2011, 143,446 Mexican immigrants obtained green cards, accounting for 14 percent of the 1.1 million immigrants granted LPR status. The foreign born from Mexico gained LPR status mostly through family reunification. About 89 percent obtained green cards through family relationships, 6 percent through employment, and 5 percent through other routes, including a small number of refugees or asylees.
About 59 percent of all Mexican immigrants granted LPR status in 2011 qualified as the immediate family member (spouse, unmarried child under 21, or parent) of a U.S. citizen, compared to 43 percent of all immigrants. Less than 0.5 percent of all Mexican-born immigrants received green cards as refugees or asylees, compared to 16 percent of all immigrants.
Read more about immigrants who became LPRs in 2011 in Green Card Holders and Legal Immigration to the United States.
Mexican nationals accounted for only 1 percent of persons granted asylum in 2011.
Only 294 Mexican nationals (1 percent of 24,988 individuals) received asylum in 2011. From 2002 through 2011, Mexican nationals accounted for 1 percent (1,685) of the 260,951 individuals granted asylum. No Mexican nationals were reported as refugee arrivals in 2011 data.
Read more about Refugees and Asylees in the United States.
More than 94,000 Mexican-born immigrants became U.S. citizens through naturalization in 2011.
In 2011, 94,783 Mexican-born immigrants were naturalized in the United States, representing 14 percent of the 694,193 new U.S. citizens.
The share of Mexican-born immigrants who have naturalized (24 percent) is less than the 45 percent share of all U.S. immigrants who have naturalized.
According to the 2011 ACS, about 24 percent of Mexican immigrants were naturalized U.S. citizens – nearly half the share of immigrants overall (45 percent).
Over 80 percent of Mexican-born green card holders in 2011 were eligible to naturalize.
DHS' Office of Immigration Statistics (OIS) estimates that nearly 2.7 million Mexican-born LPRs, or about 80 percent of the total 3.3 million Mexican-born LPRs, were eligible to naturalize in 2011. The Mexican born accounted for about 31 percent of the total 8.5 million LPRs eligible to naturalize in 2011.
For more, see OIS' Estimates of the Lawful Permanent Resident Population in 2011.
In early 2011, 59 percent of all unauthorized immigrants in the United States were from Mexico.
OIS estimated that in January 2011, 6.8 million (59 percent) of the approximately 11.5 million unauthorized migrants were born in Mexico.
For more, see OIS' Estimates of the Unauthorized Immigrant Population Residing in the United States: January 2011.
Demographic and Socioeconomic Overview
Note: This section is based on the authors' analysis of 2011 American Community Survey (ACS) data.
Mexican immigrant men outnumbered women in 2011.
Of all Mexican immigrants residing in the United States in 2011, 53 percent were men and 47 percent women. By contrast, gender distributions were more balanced among the native born and overall foreign born (about 49 percent male and 51 percent female for both groups).
The foreign born from Mexico were more likely to be of working age than the native born and foreign born overall.
Of the Mexican born residing in the United States in 2011, 88 percent were of working age (16 through 64 years old), compared with 63 percent of the native born and 82 percent of all immigrants. Among Mexican immigrants, only 7 percent were older than 64, compared to 13 percent of the native- and foreign-born populations.
Less than one-third of all Mexican immigrants have strong English-language skills.
In 2011, 4 percent of Mexican immigrants ages 5 and older reported speaking only English; 26 percent reported speaking English "very well;" In contrast, 18 percent of all Mexican immigrants reported not speaking English at all, 22 percent reported speaking English "well," and 30 percent reported speaking English, but "not well."
Overall, about 71 percent of Mexican immigrants were Limited English Proficient (LEP), meaning that they reported speaking English less than "very well." In contrast, 51 percent of all immigrants reported limited English proficiency in 2011.
Note: In the American Community Survey, respondents who reported that they spoke a language other than English at home were asked to self-assess their English-speaking abilities with the options of "not at all," "not well," or "well," and "very well."
As a group, Mexican-born adults were less likely to be university graduates compared to all immigrant adults.
In 2011, only 5 percent of Mexican-born adults ages 25 and older had a bachelor's degree or higher, which is substantially lower than the 27 percent share of immigrant adults and the 29 percent share of all U.S.-born adults.
In addition, 59 percent of Mexican-born adults had no high school or GED diploma, compared to 31 percent of immigrants overall and 11 percent of native-born adults. The share of the Mexican born who reported their highest educational attainment as a high school diploma, some college credits, or an associate's degree (35 percent) was lower than that of the native born (61 percent) and the foreign born overall (41 percent).
Mexican-born immigrants have generally mirrored the arrival patterns of the foreign born overall.
In 2011, approximately 34 percent of the 11.7 million Mexican immigrants in the United States had entered after 2000; 31 percent arrived between 1990 and 1999; 19 percent entered between 1980 and 1989; and 16 percent entered prior to 1980.
This arrival pattern generally mirrored that of immigrants in the United States overall: 36 percent had arrived after 2000; 27 percent arrived between 1990 and 1999; 18 percent entered between 1980 and 1989; and 19 percent entered prior to 1980.
Over 34 percent of employed Mexican-born men worked in construction, extraction, and transportation, while 39 percent of Mexican women worked in service and personal care occupations.
Mexican-born male workers appear to be more highly concentrated in a few occupational groups than immigrant men overall (see Table 2). The top three occupational groups employed 78 percent of the 4.5 million Mexican-born male workers ages 16 to 64, including 34 percent in construction, extraction, and transportation; 25 percent in service and personal care; and 18 percent in manufacturing, installation, and repair. While the same three occupational groups were the top three for immigrant men overall, they employed only 57 percent of the 12.9 million immigrant male workers.
Among the 2.3 million Mexican-born female workers ages 16 to 64, 39 percent reported working in service and personal care occupations; 14 percent in manufacturing, installation, and repair; and 12 percent in administrative support. The top three occupation groups for the 9.6 million immigrant women overall were somewhat different: 27 percent in service and personal care; 13 percent in administrative support; and 11 percent in management, business, and financial occupations.
|
|
|||||||||||||||||||||||||||||||||||||||||||||||||||||||||||||||||||||||||||||||||||||||||||||||||
|
|||||||||||||||||||||||||||||||||||||||||||||||||||||||||||||||||||||||||||||||||||||||||||||||||
The Mexican born were more likely to live in poverty in 2011 than the native or foreign born overall.
In 2011, a larger share of Mexican immigrants (29 percent) lived in households with an annual income below the official federal poverty line than the native born (15 percent) and immigrants overall (20 percent).
About 7.2 million children under the age of 18 resided in a household with at least one immigrant parent born in Mexico.
The 7.2 million children with at least one Mexican-born parent represented 42 percent of the overall population of children from immigrant households (17.1 million children). Similar to the overall population of children from immigrant households, the vast majority of children in Mexican immigrant families were born in the United States (about 87 percent for the overall population, and 89 percent of those in Mexican immigrant families).
Note: Includes only children who reside with at least one parent who is foreign born. Excludes families with U.S.-born parents with foreign adopted children.
For more information about ACS data and methodology, click here.
Sources
U.S. Census Bureau. 2011. 2011 American Community Survey (ACS), Table B05006, Place of Birth for the Foreign-Born Population. Available online.
U.S. Department of Homeland Security, Office of Immigration Statistics. 2011. 2011 Yearbook of Immigration Statistics, various tables. Available online.
Authors' analysis of the U.S. Census Bureau's 2011 ACS. Accessed from Steven Ruggles, J. Trent Alexander, Katie Genadek, Ronald Goeken, Matthew B. Schroeder, and Matthew Sobek. Integrated Public Use Microdata Series: Version 5 [Machine-readable database]. Minneapolis, MN: Minnesota Population Center [producer and distributor], 2010. Available online.