

Mexican Immigrants in the United States

Archway welcoming people to Little Village, a Chicago neighborhood that is home to many Mexican Americans. (Photo: Eric Allix Rogers)
After four decades of strong growth, the Mexican immigrant population in the United States hit a turning point in 2010. While the overall number of immigrants in the country increased every year between 2010 and 2017, the number of Mexicans first flattened out and then started a slow decline in 2014. Between 2016 and 2017, the Mexican immigrant population shrunk by about 300,000, from 11.6 million to 11.3 million. Nonetheless, Mexicans are still the largest foreign-born group in the country, accounting for 25 percent of the 44.5 million immigrants as of 2017.
For a long time, migration from Mexico to the United States has been largely driven by low-skilled, unauthorized workers seeking economic opportunity. However, in recent years, migration patterns have changed due to factors including the improving Mexican economy, stepped-up U.S. immigration enforcement, and the long-term drop in Mexico’s birth rates. More Mexican immigrants have returned to Mexico than have migrated to the United States, and apprehensions of Mexicans at the U.S.-Mexico border are at a 40-year low. Mexico is also no longer the top origin country among the most recent immigrants to the United States. In addition, newer immigrants from Mexico are more likely to be college graduates and have stronger English skills than those who arrived in prior decades.
Figure 1. Mexican Immigrant Population in the United States, 1980–2017
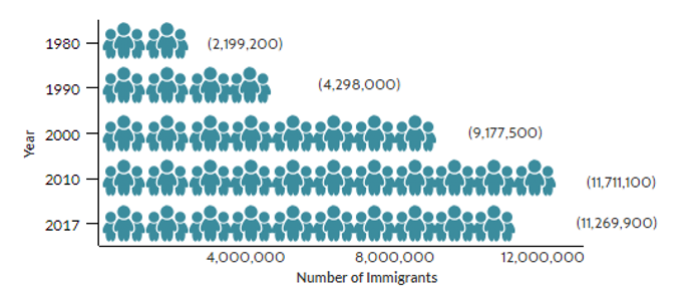
Sources: Data from U.S. Census Bureau 2010 and 2017 American Community Surveys (ACS); Campbell J. Gibson and Kay Jung, "Historical Census Statistics on the Foreign-Born Population of the United States: 1850–2000" (Working Paper no. 81, U.S. Census Bureau, Washington, DC, February 2006), available online.
Click here to view an interactive chart highlighting Mexican migration trends over time.
The United States is by far the top destination for Mexican emigrants, though others have settled in Canada (81,000), Spain (49,000), Germany (18,000), and Guatemala (18,000), according to mid-2017 estimates by the United Nations Population Division. Click here to view an interactive map showing where migrants from Mexico and other countries have settled worldwide.
Compared to the overall foreign-born population in the United States, Mexicans on average are more likely to be Limited English Proficient (LEP), have lower levels of education, experience poverty, and lack health insurance. Most Mexicans in the United States who obtain lawful permanent residence—also known as receiving a green card—do so through family ties.
Using data from the U.S. Census Bureau (the most recent 2017 American Community Survey [ACS] as well as pooled 2012–16 ACS data) and the Department of Homeland Security’s Yearbook of Immigration Statistics, this Spotlight provides information on the Mexican population in the United States, focusing on its size, geographic distribution, and socioeconomic characteristics.
Click on the bullet points below for more information:
- Distribution by State and Key Cities
- English Proficiency
- Age, Education, and Employment
- Income and Poverty
- Immigration Pathways and Naturalization
- Health Coverage
- Diaspora
- Remittances
Distribution by State and Key Cities
In the 2012–16 period, most immigrants from Mexico lived in California (37 percent), Texas (22 percent), or Illinois (6 percent). The four counties with the most Mexicans were Los Angeles County in California, Harris County in Texas, Cook County in Illinois, and Orange County in California. Together, these counties account for about 23 percent of the Mexican immigrant population in the United States.
Figure 2. Top States of Residence for Mexicans in the United States, 2012–16
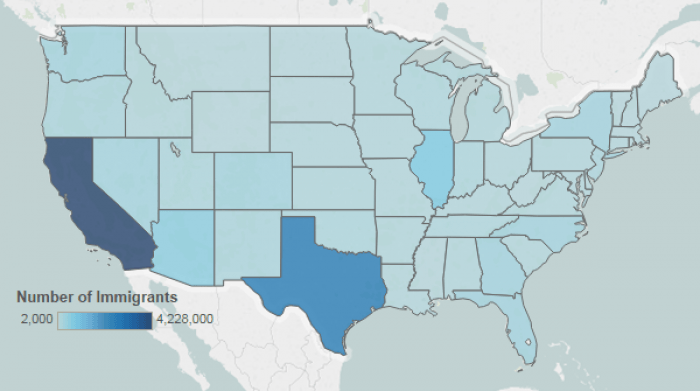
Note: Pooled 2012–16 ACS data were used to get statistically valid estimates at the state level for smaller-population geographies. Not shown are the populations in Alaska and Hawaii, which are small in size; for details, visit the Migration Policy Institute (MPI) Data Hub to view an interactive map showing geographic distribution of immigrants by state and county, available online.
Source: MPI tabulation of data from U.S. Census Bureau pooled 2012–16 ACS.
As of 2012–16, the U.S. cities with the largest number of Mexicans were the greater Los Angeles, Chicago, and Houston metropolitan areas. About 26 percent of Mexicans in the United States lived in these three metro areas.
Figure 3. Top Metropolitan Areas of Residence for Mexicans in the United States, 2012–16
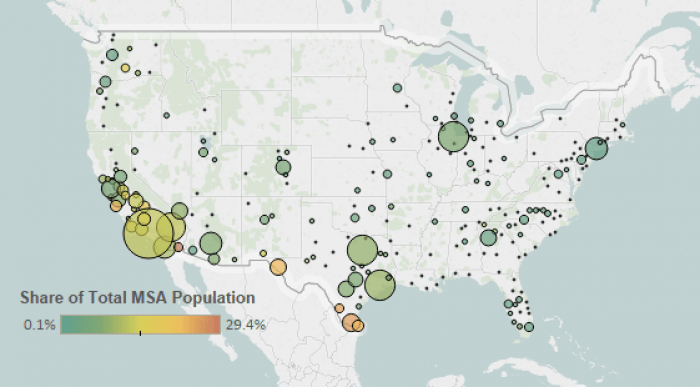
Note: Pooled 2012–16 ACS data were used to get statistically valid estimates at the metropolitan statistical-area level for smaller-population geographies. Not shown are the populations in Alaska and Hawaii, which are small in size.
Source: MPI tabulation of data from U.S. Census Bureau pooled 2012–16 ACS.
Table 1. Top Concentrations of Mexicans by Metropolitan Area, 2012–16
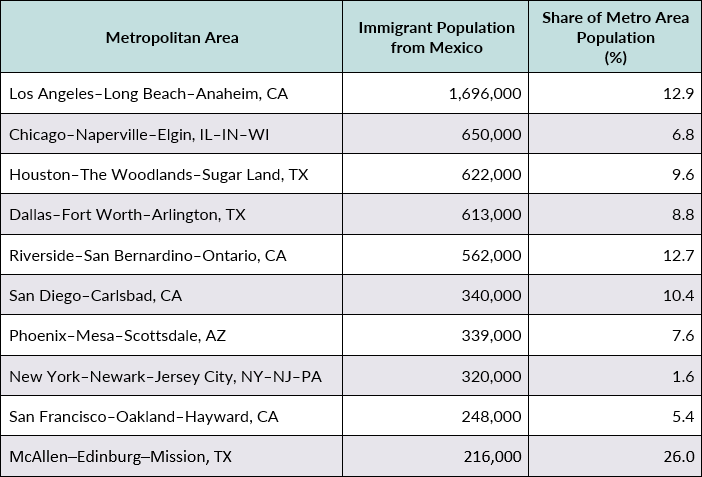
Source: MPI tabulation of data from the U.S. Census Bureau pooled 2012–16 ACS.
Click here for an interactive map that highlights the metropolitan areas with the highest concentrations of immigrants from Mexico and other countries.
Mexican immigrants are less likely to be proficient in English than the overall foreign-born population. In 2017, 67 percent of Mexicans reported limited English proficiency, compared to 48 percent of all immigrants. Approximately 4 percent of Mexican immigrants reported speaking only English at home, versus 16 percent of the overall U.S. foreign-born population.
Note: Limited English Proficient refers to those who indicated on the ACS questionnaire that they spoke English less than “very well.”
Age, Education, and Employment
On average, Mexican immigrants are slightly younger than the overall foreign-born population but much older than the native-born population. In 2017, the median age of Mexicans in the United States was 43 years, compared to 45 years for all immigrants and 36 years for the U.S. born. Mexican immigrants are more likely than the native- and overall foreign-born populations to be of working age (18 to 64; see Figure 4).
Figure 4. Age Distribution of the U.S. Population by Origin, 2017
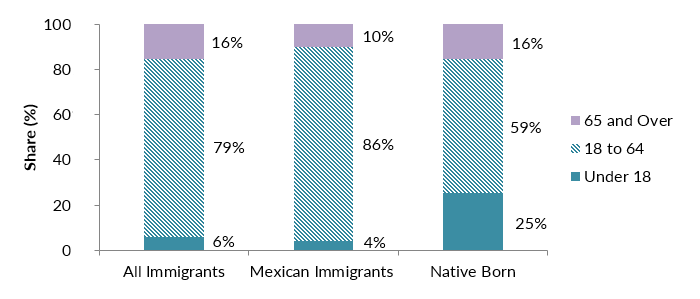
Note: Numbers may not add up to 100 as they are rounded to the nearest whole number.
Source: MPI tabulation of data from the U.S. Census Bureau 2017 ACS.
Mexican immigrants ages 25 and over have much lower educational attainment compared to both the native- and overall foreign-born populations. In 2017, about 55 percent of Mexican adults in the United States lacked a high school diploma, versus 28 percent of all immigrant adults and 9 percent of the native born. Approximately 7 percent of Mexican immigrants had a bachelor's degree or higher, compared to about 32 percent of the U.S. born and 31 percent of all immigrants.
Mexicans participate in the labor force at a higher rate than both the native- and overall foreign-born populations. About 69 percent of Mexican immigrants ages 16 and over were in the civilian labor force in 2017, compared to 66 percent of all immigrants and 62 percent of the native born. Mexicans are much more likely to be employed in natural resources, construction, and maintenance occupations; service occupations; and production, transportation, and material moving occupation than the other two groups of workers (see Figure 5).
Figure 5. Employed Workers in the Civilian Labor Force (ages 16 and older) by Occupation and Origin, 2017
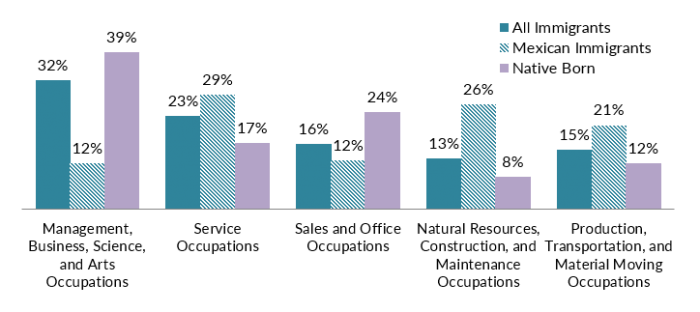
Source: MPI tabulation of data from the U.S. Census Bureau 2017 ACS.
On average, Mexicans have lower incomes than the overall foreign- and native-born populations. In 2017, households headed by a Mexican immigrant had a median income of $44,700, compared to $56,700 and $60,800 for all immigrant and U.S.-born households, respectively.
In 2017, approximately 21 percent of Mexican immigrant families were living in poverty, a higher rate than for the native born (9 percent) and for immigrant families overall (14 percent).
Immigration Pathways and Naturalization
Mexicans are less likely to be naturalized U.S. citizens than immigrants overall, mainly due to the presence of a large unauthorized immigrant population ineligible for U.S. citizenship. In 2017, about 31 percent of Mexican immigrants were naturalized citizens, compared to 49 percent of the total foreign-born population.
Compared to the overall immigrant population, Mexicans are more likely to have arrived nearly a decade or more ago. The largest share, approximately 60 percent, arrived prior to 2000, followed by 29 percent between 2000 and 2009, and 11 percent in 2010 or later (see Figure 6).
Figure 6. Mexicans and All Immigrants in the United States by Period of Arrival, 2017
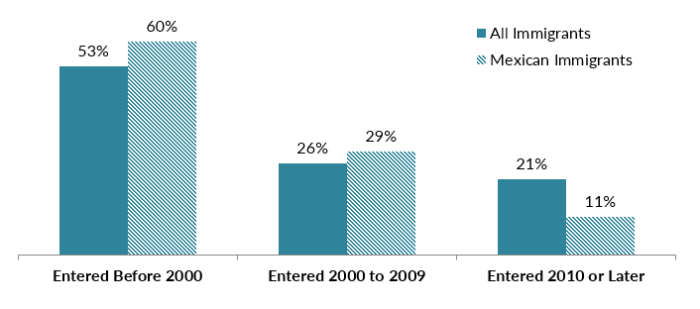
Note: Numbers may not add up to 100 as they are rounded to the nearest whole number.
Source: MPI tabulation of data from the U.S. Census Bureau 2017 ACS.
Most Mexicans who obtain green cards do so through family reunification channels. In fiscal year (FY) 2017, 87 percent of the roughly 170,600 Mexicans who became lawful permanent residents (LPRs) did so as either immediate relatives or other family members of U.S. citizens or LPRs, a much higher share than the 66 percent of new LPRs from all countries. Mexican immigrants were much less likely to gain green cards via employment pathways (3 percent) compared to the overall LPR population (12 percent; see Figure 7).
Figure 7. Immigration Pathways of Mexican Immigrants and All Immigrants in the United States, 2017
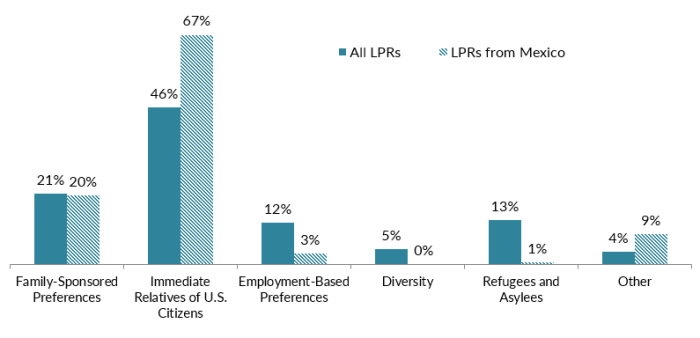
Notes: Family-sponsored preference: Includes adult children and siblings of U.S. citizens as well as spouses and children of green-card holders. Immediate relatives of U.S. citizens: Includes spouses, minor children, and parents of U.S. citizens. Diversity Visa lottery: The Immigration Act of 1990 established the Diversity Visa lottery program to allow entry to immigrants from countries with low rates of immigration to the United States. The law states that 55,000 diversity visas in total are to be made available each fiscal year. Individuals born in Mexico are not eligible for the lottery.
Source: MPI tabulation of data from Department of Homeland Security (DHS), 2017 Yearbook of Immigration Statistics (Washington, DC: DHS Office of Immigration Statistics, 2018), available online.
Mexicans represent the largest unauthorized immigrant group in the United States. The Migration Policy Institute (MPI) estimates that as of 2016, approximately 6 million (53 percent) of the estimated 11.3 million unauthorized immigrants in the United States were from Mexico.
Mexico is also the largest origin country among beneficiaries of the Deferred Action for Childhood Arrivals (DACA) program, which provides temporary deportation relief and work authorization. As of May 31, 2018, there were 560,020 Mexicans participants in the DACA program—representing 80 percent of the 702,250 active DACA recipients, according to U.S. Citizenship and Immigration Services (USCIS).
A greater share of Mexican immigrants is uninsured compared to both the overall foreign- and U.S.-born populations. In 2017, 37 percent of Mexican immigrants were uninsured, versus 7 percent of the native born and 20 percent of all immigrants (see Figure 8).
Figure 8. Health Coverage for Mexicans, All Immigrants, and the Native Born, 2017
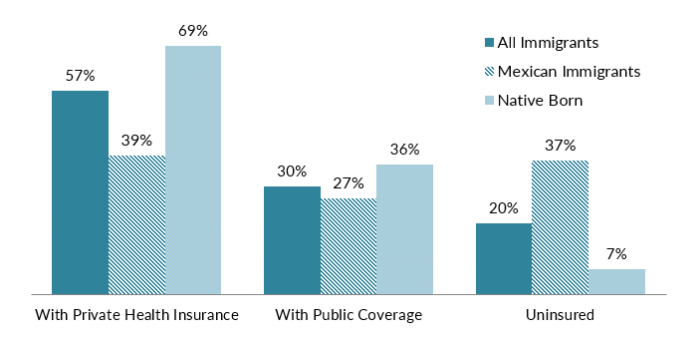
Note: The sum of shares by type of insurance is likely to be greater than 100 because people may have more than one type of insurance.
Source: MPI tabulation of data from the U.S. Census Bureau 2017 ACS.
The Mexican diaspora in the United States is comprised of approximately 37.7 million individuals who were either born in Mexico or reported Mexican ancestry or Hispanic origin, according to tabulations from the U.S. Census Bureau 2016 ACS.
In 2017, Mexicans living abroad, whether in the United States or another country, sent approximately U.S. $30.6 billion in remittances to Mexico via formal channels, according to World Bank data. Remittances have been on the rise since they dipped during the Great Recession in 2007–09. As of 2017, these remittances represented about 3 percent of the country’s gross domestic product (GDP).
Figure 9. Annual Remittance Flows to Mexico, 1981–2017
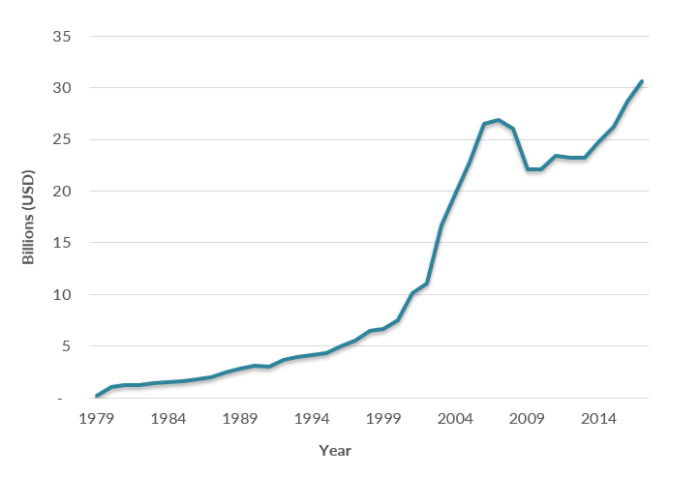
Note: The 2017 figure represents World Bank estimates.
Source: MPI tabulations of data from the World Bank Prospects Group, “Annual Remittances Data,” April 2018 update.
Sources
Gibson, Campbell and Kay Jung. 2006. Historical Census Statistics on the Foreign-Born Population of the United States: 1850–2000. Working Paper No. 81, U.S. Census Bureau, Washington, DC, February 2006. Available online.
Gonzalez-Barrera, Ana. 2015. More Mexicans Leaving than Coming to the U.S. Washington, DC: Pew Research Center. Available online.
Sáenz, Rogelio. 2015. A Transformation in Mexican Migration to the United States. National Issue Brief No. 86, University of New Hampshire, Carsey School of Public Policy, Durham, NH, Summer 2015. Available online.
United Nations Population Division. N.d. International Migrant Stock by Destination and Origin. Accessed September 23, 2018. Available online.
U.S. Census Bureau. N.d. 2017 American Community Survey (ACS). American FactFinder. Accessed September 17, 2018. Available online.
---. 2017. 2016 American Community Survey. Access from Steven Ruggles, Katie Genadek, Ronald Goeken, Josiah Grover, and Matthew Sobek. Integrated Public Use Microdata Series: Version 7.0 [dataset]. Minneapolis: University of Minnesota. Available online.
U.S. Citizenship and Immigration Services (USCIS). 2018. DACA Population Data. Data table, May 31, 2018. Available online.
---. 2018. Approximate Active DACA Recipients as of May 31, 2018. Data table, May 31, 2018. Available online.
U.S. Department of Homeland Security (DHS), Office of Immigration Statistics. 2018. 2017 Yearbook of Immigration Statistics. Washington, DC: DHS Office of Immigration Statistics. Available online.
World Bank. 2018. Annual Remittances Data, April 2018 update. Available online.
---. N.d. Personal Remittances, Received (% of GDP). Accessed August 18, 2018. Available online.