

Middle Eastern and North African Immigrants in the United States

An Egyptian woman works as a travel agent in New York City. In 2016, Egyptians were the second-largest immigrant group from the Middle East and North Africa (MENA) region in the United States. (Photo: Ben Piven)
Migration from the Middle East and North Africa (MENA) region to the United States began in the late 1800s and picked up in recent decades, driven largely by political turmoil in the region and economic opportunities abroad. In 2016, nearly 1.2 million immigrants from the MENA region lived in the United States, accounting for roughly 3 percent of the country’s approximately 44 million immigrants.
From the late 1800s to the mid-1920s, MENA immigrants arriving in the United States consisted primarily of Arab Christians from the Ottoman province of Syria (comprising modern-day Lebanon, Israel, and Syria), fleeing war and worsening economic prospects. By 1920, the United States was home to at least 50,000 immigrants from the province, largely poorly educated and employed in low-skilled occupations. The 1924 Johnson-Reed Immigration Act put in place general immigration quotas and restricted all arrivals from Asia, effectively ending this wave.
The 1948 Arab-Israeli War and revolutions in Egypt and Iraq in the 1950s triggered the second wave of MENA migration. In part a result of the restrictive U.S. quota system, immigrants arriving during this period were highly educated elites from countries including Egypt, Iraq, and Syria.
The 1965 Immigration Act removed the national-origin quota system and opened the United States to immigration from regions other than Europe, ushering in the third wave of migration from the MENA region. Post-1965 arrivals consisted of a wider mix of people seeking family unification, education and employment opportunities, and safety from war and persecution. MENA immigrants arriving during this time had similarly high education levels as those in the second wave, but were far more numerous. Further, a much higher share was Muslim.
Between 1980 and 2010, the size of the MENA immigrant population increased four-fold, from 223,000 to 861,000 (see Figure 1). From 2010 to 2016, the population increased another 36 percent, to 1,167,000.
Figure 1. MENA Immigrant Population in the United States, 1980 to 2016
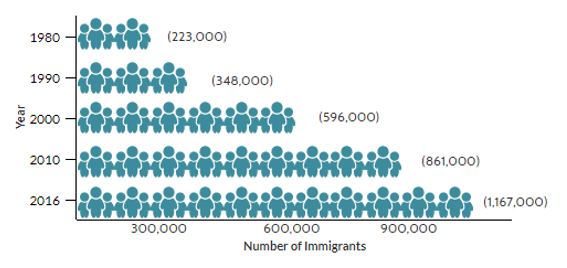
Sources: Data from U.S. Census Bureau 2010 and 2016 American Community Surveys (ACS), and Campbell J. Gibson and Kay Jung, "Historical Census Statistics on the Foreign-born Population of the United States: 1850-2000" (Working Paper no. 81, U.S. Census Bureau, Washington, DC, February 2006), available online.
Since 2010, humanitarian migration from war-torn countries in the region, such as Syria and Yemen, as well as ongoing family reunification have driven the uptick in MENA arrivals to the United States. In 2015, the Obama administration pledged to increase resettlement of Syrian refugees, and slightly more than 18,000 Syrians were resettled in the United States between January 2011 and December 2016 (including more than 15,000 in 2016 alone). Overall, more than 11 million people have fled Syria or been internally displaced since the outbreak of the civil war in 2011. While Yemen’s civil war beginning in 2015 has also driven widespread displacement, the United States accepted just 61 refugees from Yemen between 2011 and 2016.
The Trump administration made several changes early in 2017 affecting inflows of MENA immigrants. Through a series of executive orders, the administration barred the entry of nationals from several Muslim-majority countries; lowered the fiscal year (FY) 2017 refugee ceiling to 50,000 from the 110,000 level set by President Obama; and temporarily suspended resettlement of refugees. While these changes have faced ongoing legal challenges, refugee admissions have slowed considerably: In calendar year 2017, about 33,400 refugees were resettled in the United States—just one-third of the total resettled in 2016. The number of Syrian refugee arrivals fell from about 15,500 in 2016 to roughly 3,000 in 2017.
Of the total 23.9 million MENA migrants worldwide in 2015, more than half (53 percent, or 12.6 million) remained within the region. Top destinations beyond the region include France (2.9 million), Turkey (1.6 million), the United States (911,000), Spain (779,000), and Italy (726,000), according to mid-2015 estimates from the United Nations Population Division. However, international settlement patterns vary considerably by country of origin. Of the 5 million Syrians abroad in 2015, 31 percent lived in Turkey, 25 percent in Lebanon, and 14 percent in Jordan, with just 1 percent in the United States. Meanwhile, an equal share—15 percent—of Lebanese migrants lived in the United States and Saudi Arabia in 2015.
- Click here to view an interactive map showing where migrants have settled worldwide. Select a country of origin from the dropdown menu.
The MENA population in the United States is very diverse. Approximately 70 percent of MENA immigrants are from the Middle East, and around 30 percent are from North Africa (see Table 1). Overall, Iraq is the top country of origin, followed by Egypt and Lebanon.
Table 1. Distribution of MENA Immigrants by Country of Origin, 2016
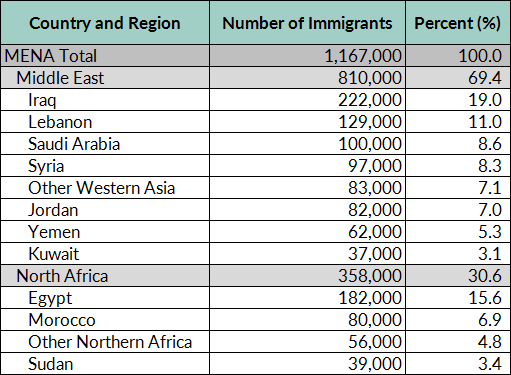
Source: MPI tabulation of data from the U.S. Census Bureau 2016 ACS.
- Click here for an interactive chart showing changes in the number of immigrants in the United States over time, by country of birth.
In 2016, about half of MENA immigrants who obtained lawful permanent residence in the United States (LPR status, also known as getting a green card) did so as immediate relatives of U.S. citizens or through other family-sponsored channels—a rate far lower than for the immigrant population overall. Another 30 percent arrived through humanitarian channels, versus 13 percent of all new green-card holders in 2016. Compared to the overall foreign- and U.S.-born populations, MENA immigrants are on average significantly better educated, but are much less likely to be employed, and have lower household incomes. Although many MENA countries share a similar religious and linguistic background, socioeconomic characteristics vary greatly by origin group.
Using data from the U.S. Census Bureau (the most recent 2016 American Community Survey [ACS] and pooled 2012-16 ACS data), the Department of Homeland Security’s Yearbook of Immigration Statistics, and World Bank annual remittance data, this Spotlight provides information on the MENA population in the United States, focusing on its size, geographic distribution, and socioeconomic characteristics.
Click on the bullet points below for more information:
- Distribution by State and Key Cities
- Language Diversity and English Proficiency
- Age, Education, and Employment
- Income and Poverty
- Immigration Pathways and Naturalization
- Health Coverage
- Diaspora
- Remittances
Distribution by State and Key Cities
Slightly more than half of immigrants from the MENA region have settled in five states: California (20 percent), Michigan (10 percent), New York (9 percent), and Texas and New Jersey (about 6 percent each). The top five counties by concentration in the 2012-16 period were Los Angeles County, CA; Wayne County, MI; Cook County, IL; San Diego County, CA; and Kings County, NY. Together, these counties accounted for 21 percent of the total MENA population in the United States.
Figure 2. Top States of Residence for MENA Immigrants in the United States, 2012-16
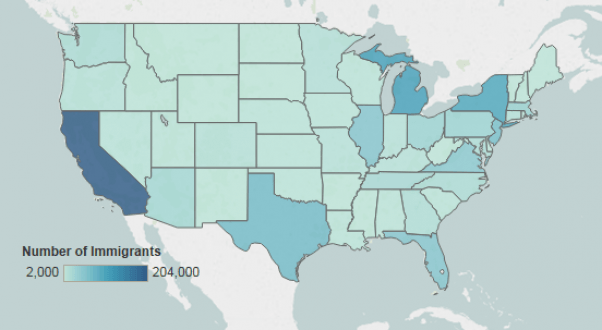
Note: Pooled 2012-16 ACS data were used to get statistically valid estimates at the state level for smaller-population geographies. Not shown are MENA populations in Alaska and Hawaii, which are small in size; for details, visit the Migration Policy Institute (MPI) Data Hub for an interactive map showing geographic distribution of immigrants by state and county, available online.
Source: MPI tabulation of data from U.S. Census Bureau pooled 2012-16 ACS.
In the 2012-16 period, the greater New York, Detroit, and Los Angeles metropolitan areas were home to the largest number of MENA immigrants. These three metro areas accounted for 31 percent of all such immigrants.
Figure 3. Top Metropolitan Areas of Residence for MENA Immigrants in the United States, 2012-16
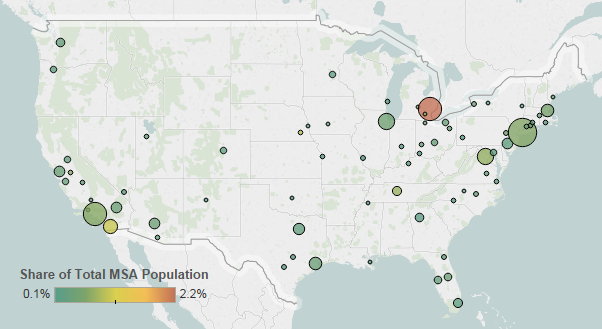
Note: Pooled 2012-16 ACS data were used to get statistically valid estimates at the metropolitan statistical-area level for smaller-population geographies.
Source: MPI tabulation of data from U.S. Census Bureau pooled 2012-16 ACS.
Table 2. Top Concentrations by Metropolitan Area for MENA Immigrants, 2012-16
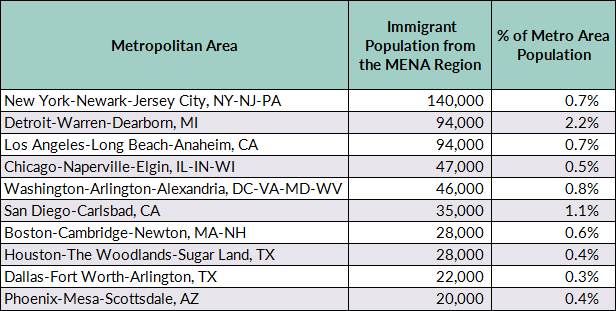
Source: MPI tabulation of data from the U.S. Census Bureau pooled 2012-2016 ACS.
- Click here for an interactive map that highlights the metropolitan areas with the highest concentrations of immigrants. Select individual MENA countries or others from the dropdown menu.
Language Diversity and English Proficiency
More than 75 percent of MENA immigrants in 2015 spoke either Arabic or Near East Arabic dialect, while 11 percent reported speaking only English. Speakers of French and Armenian accounted for about 3 percent each.
Compared to the overall foreign-born population, MENA immigrants were more likely to be proficient in English but less likely to speak English at home. In 2016, 41 percent of MENA immigrants ages 5 and over reported limited English proficiency (LEP), compared to 49 percent of the overall immigrant population. Approximately 11 percent of MENA immigrants spoke only English at home, versus 16 percent of all immigrants.
English proficiency varied significantly by country of origin: Less than 15 percent of immigrants from the United Arab Emirates were LEP, versus roughly half of Iraqis and Syrians, and 62 percent of Yemenis.
Note: Limited English proficiency refers to those who indicated on the ACS questionnaire that they spoke English less than “very well.”
Age, Education, and Employment
In 2016, MENA immigrants overall were younger than the total foreign-born population but older than the native-born population. The median age of MENA immigrants was 39 years—compared to 44 for the immigrant population overall and 36 for the U.S.-born population. Seventy-six percent of MENA immigrants were of working age (18 to 64), 12 percent were ages 65 and over, and another 12 percent were under 18. MENA immigrants were more likely than the native born but less likely than the overall foreign born to be of working age (see Figure 4).
Figure 4. Age Distribution of the U.S. Population by Origin, 2016
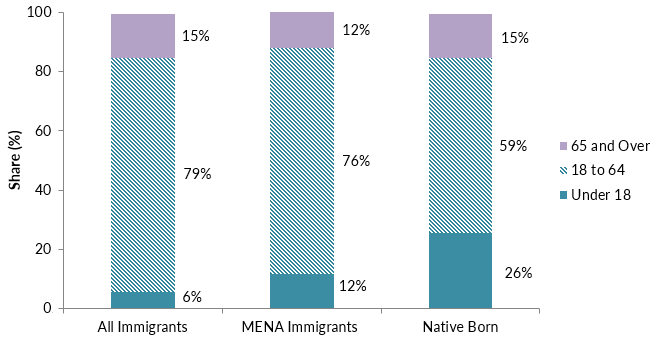
Note: Numbers may not add up to 100 as they are rounded to the nearest whole number.
Source: MPI tabulation of data from the U.S. Census Bureau 2016 ACS.
Overall, MENA immigrants have much higher educational attainment compared to the total foreign- and native-born adult populations. In 2016, 43 percent of MENA immigrants (ages 25 and over) had a bachelor’s degree or higher, compared to 30 percent of the total immigrant population and 32 percent of the native born. Almost all immigrant-origin groups from the MENA region were more likely to be college-educated than the overall foreign-born population, with the exception of Yemenis. The college graduate share was particularly high among immigrants from the United Arab Emirates (83 percent), Egypt (63 percent), Libya (60 percent), and Saudi Arabia and Kuwait (about 56 percent each), while just 16 percent of Yemenis had a bachelor’s degree or beyond.
Many students from the MENA region choose to study in the United States. In the 2016-17 school year, Saudi Arabia was the fourth top origin country among international students in the United States (after China, India, and South Korea), accounting for 5 percent (or 52,600) of the 1.1 million students during this period, according to the Institute of International Education (IIE). Kuwait was also on the list of the top 20 sending countries in 2016-17: About 9,900 Kuwaiti students studied in the United States that year. For the first time in more than a decade, the number of Saudi students declined compared to the previous year (by 14 percent), largely because the Saudi government scaled back its scholarship programs. Overall, enrollment declined by 8 percent among students from the Middle East, and increased by 3 percent for those from North Africa, according to IIE data.
Quick Facts on Syrian Immigrants
- Number in the U.S. in 2016: 97,000
- Increase since 2000: 77 percent (+42,000)
- Individuals who reported Syrian ancestry, whether immigrant or U.S. born: 180,000
- Share who were naturalized U.S. citizens: 61 percent
- Top three states: California (31 percent of the total), New York (9 percent), and New Jersey (7 percent)
- Share (ages 25 and older) with no high school education: 25 percent
- Share (ages 25 and older) with a college degree: 33 percent
- Share (ages 16 and older) in the civilian labor force: 54 percent
- Employed as physicians, surgeons, dentists, or other medical practitioners: 4,300 (11 percent of the working-age, employed Syrian population)
Click here for a Spotlight offering data on Syrian refugees in the United States.
Source: U.S. Census Bureau 2016 ACS.
MENA immigrants overall and women in particular participated in the labor force at a much lower rate. In 2016, about 57 percent of MENA immigrants ages 16 and over were in the civilian labor force, compared to 66 percent of all immigrants and 62 percent of the native born.
Meanwhile, 41 percent of female MENA immigrants were in the civilian labor force, compared to 56 percent of immigrant women overall and 59 percent of U.S.-born women, a disparity possibly attributable to the more conservative culture in many Muslim countries. Male MENA immigrants participated in the labor force at a lower rate that immigrant men overall but a higher rate than U.S.-born men: Seventy percent, compared to 77 percent of immigrant men and 66 percent of native-born men. However, just 25 percent of Saudi men were in the civilian labor force.
MENA immigrants were more likely to be employed in management, business, science, and arts occupations or sales and office occupations than the overall foreign-born population (see Figure 5).
Figure 5. Employed Workers in the Civilian Labor Force (ages 16 and older) by Occupation and Origin, 2016
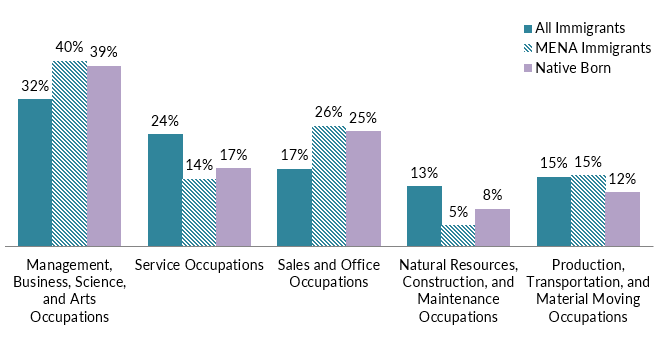
Note: Numbers may not add up to 100 as they are rounded to the nearest whole number.
Source: MPI tabulation of data from the U.S. Census Bureau 2016 ACS.
Occupations varied considerably by country of origin. More than half of employed immigrants from the United Arab Emirates, Libya, Saudi Arabia, and Egypt worked in management, business, science, and arts occupations, while a majority of employed Yemenis worked in sales and office occupations.
MENA immigrants had significantly lower incomes compared to the total foreign- and native-born populations. In 2016, the median income of households headed by an MENA immigrant was $45,000, compared to $54,000 and $58,000 for all immigrant and U.S.-born households, respectively.
In 2015, 27 percent of MENA immigrant families lived in poverty, a much higher rate compared to both overall immigrant (17 percent) and U.S.-born families (14 percent).
Immigration Pathways and Naturalization
In 2016, 58 percent of MENA immigrants in the United States were naturalized U.S. citizens, compared to 49 percent of all immigrants. Of all MENA groups, Lebanese had the highest naturalization rate, at 79 percent, followed by about 66 percent of those from Egypt, Jordan, and Morocco, compared to just 19 percent—the lowest rate—for Saudis.
MENA immigrants were more likely to have entered the United States since 2010 than the overall immigrant population. Thirty-nine percent of MENA immigrants arrived prior to 2000, while 25 percent arrived between 2000 and 2009, and 36 percent in 2010 or later (see Figure 6).
Meanwhile, 69 percent of immigrants from Lebanon entered before 2000, as did roughly 45 percent of those from Egypt, Jordan, and Syria. About 44 percent of immigrants from Sudan arrived between 2000 and 2009. In contrast, immigration from Saudi Arabia, the United Arab Emirates, and Libya is much more recent: Of all immigrants from these countries, 74 percent, 59 percent, and 53 percent, respectively, arrived since 2010.
Figure 6. MENA Immigrants and All Immigrants in the United States by Period of Arrival, 2016
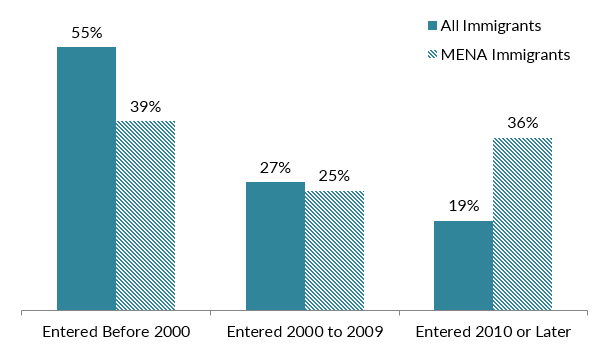
Note: Numbers may not add up to 100 as they are rounded to the nearest whole number.
Source: MPI tabulation of data from the U.S. Census Bureau 2016 ACS.
The number of MENA immigrants obtaining green cards nearly doubled in the past decade—increasing from fewer than 40,000 in FY 2007 to more than 73,000 in FY 2016. The largest share of new MENA green-card holders in 2016, 26 percent, was from Iraq, followed by 18 percent from Yemen, and 16 percent from Egypt. At the lower end of the spectrum, nationals of Bahrain and Oman each received fewer than 150 green cards.
Most immigrants from the MENA region who obtained green cards did so through family preferences—though were far less likely to come via the family route than immigrants overall. In 2016, 37 percent gained LPR status as immediate relatives of U.S. citizens and another 14 percent through other family-based channels, as compared to 48 percent and 20 percent respectively for immigrants overall. MENA immigrants were more likely to become LPRs through the refugee and asylum channel or the Diversity Visa lottery program than the overall LPR population (see Figure 7).
Figure 7. Immigration Pathways of MENA Immigrants and All Immigrants in the United States, 2016
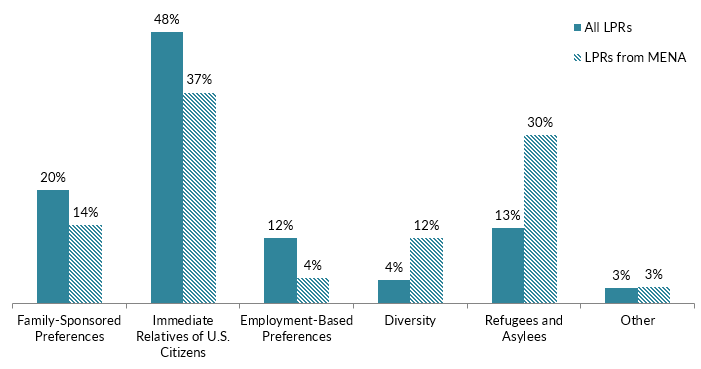
Notes: Family-sponsored: Includes adult children and siblings of U.S. citizens as well as spouses and children of green-card holders. Immediate relatives of U.S. citizens: Includes spouses, minor children, and parents of U.S. citizens. Diversity Visa lottery: The Immigration Act of 1990 established the Diversity Visa lottery program to allow entry to immigrants from countries with low rates of immigration to the United States. The law states that 55,000 diversity visas in total are made available each fiscal year.
Source: MPI tabulation of data from Department of Homeland Security (DHS), 2016 Yearbook of Immigration Statistics (Washington, DC: DHS Office of Immigration Statistics, 2017), available online.
Immigration pathways varied by country. For instance, 79 percent of Iraqis received their LPR status through humanitarian channels, as did 33 percent of Sudanese and 30 percent of Syrians. Similarly, while just 4 percent of all MENA immigrants became green-card holders via employment preferences, 45 percent of immigrants from Bahrain did so, as did 30 percent of immigrants from Oman, and 28 percent of those from the United Arab Emirates. Meanwhile, the Diversity Visa lottery accounted for 57 percent of new Algerian LPRs and 40 percent of Sudanese.
In terms of health-insurance coverage, MENA immigrants fell between the native- and overall foreign-born populations: In 2016, 12 percent of MENA immigrants were uninsured versus 7 percent of the U.S. born and 20 percent of the total immigrant population.
MENA immigrants were more likely than the other two groups to be covered by public health insurance. Yemenis and Iraqis had the highest share of public health insurance coverage—64 percent and 59 percent, respectively—among all MENA groups.
Figure 8. Health Coverage for MENA Immigrants, All Immigrants, and the Native Born, 2016
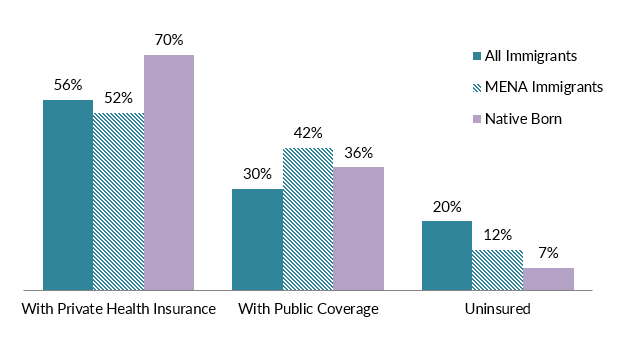
Note: The sum of shares by type of insurance is likely to be greater than 100 because people may have more than one type of insurance.
Source: MPI tabulation of data from the U.S. Census Bureau 2016 ACS.
The MENA diaspora population in the United States is comprised of approximately 2.4 million individuals who were either born in the MENA region or reported MENA ancestry, according to tabulations from the 2016 ACS.
In 2017, MENA countries received nearly $50 billion in remittances from abroad; these receipts have increased five-fold since 1990.
Figure 9. Annual Remittance Flows to the MENA Region, 1975 to 2017
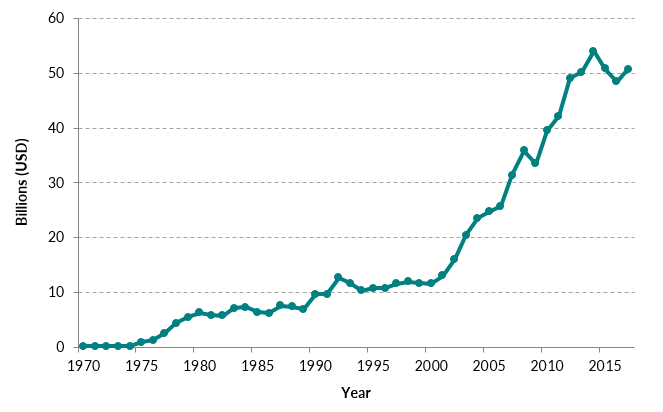
Source: MPI tabulations of data from the World Bank Prospects Group, “Annual Remittances Data,” October 2017 update.
- Visit the Data Hub’s collection of interactive remittances tools, which track remittances by inflow and outflow, between countries, and over time.
Sources
Foad, Hisham S. 2013. Waves of Immigration from the Middle East to the United States. Social Science Research Network, December 2013. Available online.
Institute of International Education (IIE). 2017. Open Doors Fast Facts 2017. Washington, DC: IIE. Available online.
---. 2017. Open Doors 2017 Regional Fact Sheet: Middle East and North Africa. Washington, DC: IIE. Available online.
Gibson, Campbell J. and Emily Lennon. 1999. Historical Census Statistics on the Foreign-born Population of the United States: 1850-1990. Working Paper No. 29, U.S. Census Bureau, Washington, DC, February 1999. Available online.
Orfalea, Gregory. 2006. The Arab Americans: A History. Northampton, MA: Olive Branch Press.
U.S. Census Bureau. N.d. 2016 American Community Survey. American FactFinder. Accessed January 5, 2018. Available online.
---. 2017. 2016 ACS. Accessed from Steven Ruggles, J. Trent Alexander, Katie Genadek, Ronald Goeken, Matthew B. Schroeder, and Matthew Sobek. Integrated Public Use Microdata Series: Version 5.0 [Machine-readable database]. Minneapolis: University of Minnesota, 2010. Available online.
U.S. Department of Homeland Security (DHS) Office of Immigration Statistics. 2017. 2016 Yearbook of Immigration Statistics. Washington, DC: DHS Office of Immigration Statistics. Available online.
World Bank Prospects Group. 2017. Annual Remittances Data, October 2017 Update. Available online.