

Naturalized Citizens in the United States

New U.S. citizens take an oath during a naturalization ceremony. (Photo: U.S. National Archives)
Naturalization is perhaps the most powerful marker of immigrants’ integration, as they take the fullest step towards participation in the civic life of their new country by becoming citizens. In the United States, naturalized citizens have the same privileges and responsibilities as U.S.-born citizens, including the right to vote and similar access to government benefits and public-sector jobs. They also receive the ability to sponsor immediate family members for immigration and cannot be deported.
More than 613,700 immigrants naturalized during fiscal year (FY) 2020, fewer than at any other point in the last decade. This decline may be partly due to impacts of the COVID-19 pandemic, including delayed oath ceremonies; the FY 2020 number represented a 27 percent decline from the 843,600 naturalizations the prior year, which marked the largest number since FY 2008 (see Figure 1). Notably, trends for new naturalized citizens do not necessarily follow those for new lawful permanent residents (LPRs). Overall, there were 23.2 million naturalized U.S. citizens in the United States in 2019, the most recent reporting available, making up 52 percent of the overall immigrant population, which stood at 44.9 million.
Figure 1. New Naturalizations and New Lawful Permanent Residents, FY 1980-2020
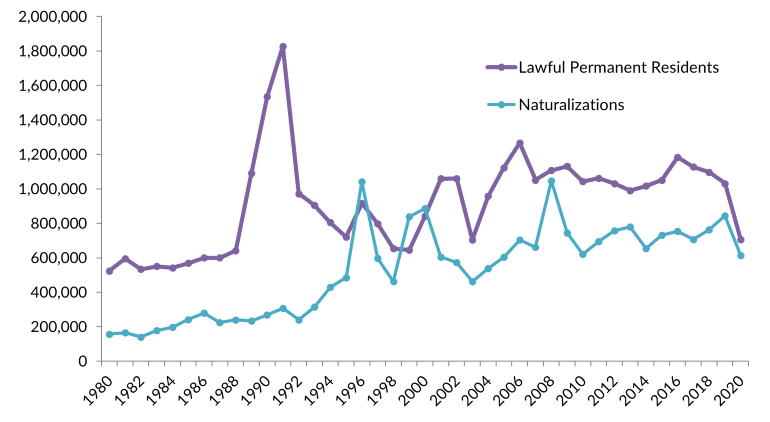
Source: MPI tabulation of data from U.S. Department of Homeland Security (DHS), Yearbook of Immigration Statistics (Washington, DC: DHS Office of Immigration Statistics, various years), available online; DHS, “Legal Immigration and Adjustment of Status Report Fiscal Year 2020, Quarter 4,” accessed July 30, 2021.
In recent years, institutional factors such as processing times and case backlogs have affected the number of annual naturalizations, as have financial constraints in meeting the citizenship application fee of $725 and immigrants’ personal decisions about whether to apply. While the number of new naturalized citizens has fluctuated each year, processing wait times have increased. The average processing time for N-400 applications for naturalization increased to 11.5 months in FY 2021, up from 9.1 months in FY 2020 and about 10 months in FY 2019.
In order to become a citizen, applicants must meet a set of requirements outlined in the Immigration and Nationality Act. These include maintaining lawful permanent residence, also known as getting a green card, for several years (generally five, though a green-card holder married to a U.S. citizen can naturalize after three years), proving basic proficiency in English and knowledge of U.S. history and government, and passing a background check to demonstrate good moral character. In addition to legal benefits, naturalized citizens also tend to have better economic outcomes than other immigrants, including higher incomes and rates of homeownership.
Using the most recent available data from the U.S. Department of Homeland Security (DHS) Office of Immigration Statistics, the U.S. Census Bureau (the most recent 2019 American Community Survey [ACS]), and other sources, this Spotlight provides information on new naturalized citizens in the United States, including historical trends, characteristics of naturalized citizens, and the population potentially eligible for naturalization.
Note: Yearly data on new naturalized citizens are for the federal fiscal year, which runs from October 1 through September 30 of the given year.
Click on the bullet points below for more information:
- Historical Trends
- Naturalized Citizens’ Countries of Birth
- States and Cities of Residence
- Time as Lawful Permanent Residents
- Military Naturalizations
- Socioeconomic Characteristics of Naturalized Citizens
- Naturalization-Eligible Population
The number of applications for naturalization has varied in recent years. U.S. Citizenship and Immigration Services (USCIS) received nearly 967,800 petitions for naturalization in FY 2020, the most recent year for which full data were available, more than the 830,600 filed in FY 2019 but slightly fewer than the 986,900 applications in FY 2017. Additionally, 97,800 naturalization petitions were denied in FY 2019, a 6 percent increase from the 92,600 denied in FY 2018. Applicants can be denied citizenship if they cannot prove the required length of permanent residence, are found to lack allegiance to the United States, are determined to have bad moral character, or fail the required English language or U.S. civics test.
When President Donald Trump was in office, his administration’s restrictive immigration policies were credited with motivating immigrants to seek citizenship to fully secure their status. The administration sought to nearly double the fees for applying for naturalization (from $725 to $1,170), eliminate most fee waivers for low-income applicants, and impose a more difficult and time-consuming civics test. The fee proposal was blocked by a U.S. district court judge, and the Biden administration reinstated the earlier civics test shortly after taking office in early 2021.
There were 942,700 pending naturalization cases at the end of FY 2020, an increase from 647,600 at the end of FY 2019 and 738,100 at the end of FY 2018.
Click here for an interactive data tool showing the annual number of naturalizations in the United States since FY 1910.
Naturalized Citizens’ Countries of Birth
Of the slightly more than 613,700 immigrants who naturalized in FY 2020, the largest share was from Mexico (13 percent, or 82,400 people) (see Figure 2). The next top counties of birth were India (45,900), the Philippines (32,400), Cuba (30,400), China (25,900), and Vietnam (21,800). People born in these six countries accounted for 39 percent of all naturalizations that year. The Dominican Republic (18,200), Canada (13,400), Jamaica (12,900), and El Salvador (12,300) rounded out the top 10 countries of birth for new U.S. citizens.
Figure 2. Top Countries of Birth for New Naturalized U.S. Citizens, FY 2020
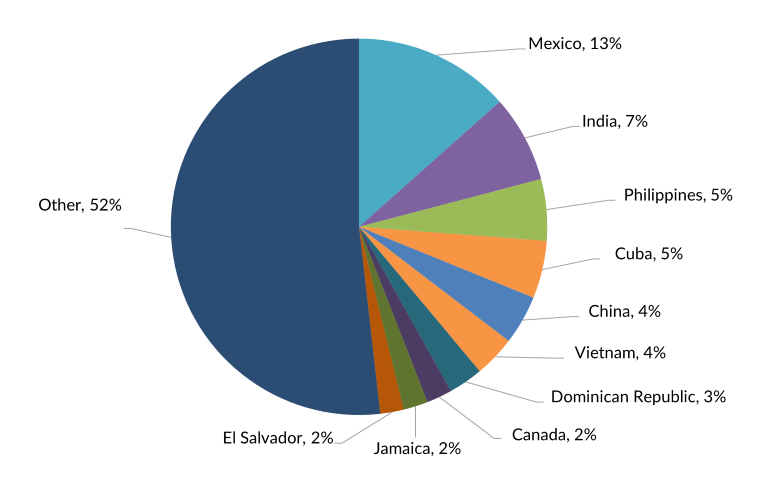
Source: DHS, “Legal Immigration and Adjustment of Status Report Fiscal Year 2020, Quarter 4.” Accessed July 30, 2021.
States and Cities of Residence
More than half of citizens who naturalized in FY 2019 lived in four states: California, Texas, Florida, and New York (see Table 2). Altogether, 70 percent of all new naturalized citizens in FY 2019 lived in just 10 states (see Table 1).
Table 1. Top 10 States of Residence of New Naturalized Citizens, FY 2019
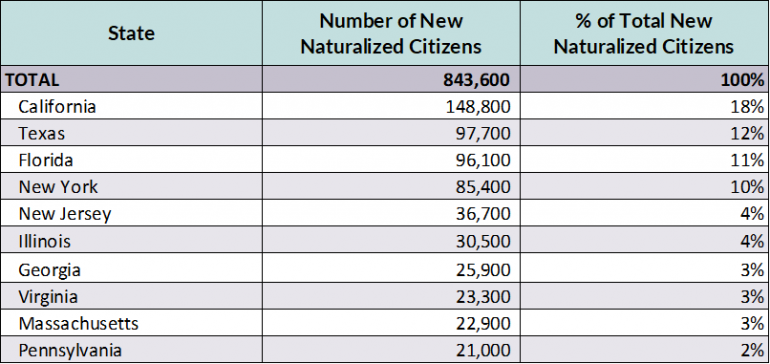
Source: DHS, Yearbook of Immigration Statistics 2019 (Washington, DC: DHS Office of Immigration Statistics, 2020), available online.
More than one-quarter of citizens who naturalized in FY 2019 resided in three metropolitan areas: greater New York City (108,000 or 13 percent), Miami (60,600, 7 percent), and Los Angeles (56,900, 7 percent). Nearly half (49 percent) of all new naturalized U.S. citizens in FY 2019 lived in these cities or the greater Houston, Washington, DC, Dallas (4 percent each), Chicago (3 percent), Atlanta, San Francisco, or Boston (2 percent each) areas.
Time as Lawful Permanent Residents
In FY 2019, the median period between when individuals gained a green card and when they were naturalized was eight years. This number has not changed since FY 2017, but was a one-year increase over the FY 2012-16 period. The increase may reflect the growing backlog of applications and subsequent processing delays since 2016.
The amount of time individuals spend with LPR status before naturalizing varies by country and region of birth. LPRs from North America and Oceania tend to wait longer before they naturalize (10 years) compared to those from Africa (6 years).
Figure 3. Median Years in Lawful Permanent Resident Status for Individuals Naturalized as U.S. Citizens in FY 2019, by Region of Origin

Source: John Teke, U.S. Naturalizations: 2019 (Washington, DC: DHS Office of Immigration Statistics, 2020), available online.
In addition to institutional factors such as growing processing times and delays due to security checks, individual decisions also play a role in the length of time immigrants spend as LPRs before naturalizing. Would-be applicants’ inability to pay the $640 application fee plus the $85 biometric fee can contribute to longer times as LPRs, so can challenges attaining the required level of English language proficiency. Immigrants may also wait to naturalize because of the tradeoffs involved in gaining U.S. citizenship, which may include losing rights or property in their origin country.
Serving in the U.S. armed forces offers immigrants an expedited path to citizenship, which has long been used to encourage them to enlist. In FY 2020, 4,500 foreign-born members of the U.S. military naturalized, roughly the same number as in FY 2019 (4,400).
During peacetime, noncitizens are eligible to naturalize after one year of military service. However, Section 329 of the Immigration and Nationality Act grants the president the power to designate periods of conflict during which noncitizen servicemembers are eligible for naturalization immediately. President George W. Bush designated September 11, 2001 as the start of a period of hostilities, and this designation has remained in place ever since. As a result, noncitizen military personnel serving on or after that date have been eligible for expedited citizenship.
Between the start of FY 2002 (which began on October 1, 2001) and the end of FY 2020, approximately 139,000 foreign-born members of the U.S. armed services became citizens. Between FY 2016 and FY 2020, close to 41 percent of the 30,000 military naturalizations were of persons born in the Philippines (11 percent), Mexico (9 percent), China (8 percent), South Korea (7 percent), or Jamaica (7 percent).
Military Accessions Vital to the National Interest Program
In 2008, the Defense Department authorized the Military Accessions Vital to the National Interest (MAVNI) program to fill key recruitment shortages by allowing certain noncitizens without LPR status—including, after expansion in 2014, some beneficiaries of the Deferred Action for Childhood Arrivals (DACA) program for unauthorized young people—with skills in health care and critical languages to join the military in exchange for expedited U.S. citizenship. Coupled with the designation of a period of hostilities after 9/11, MAVNI recruits initially enjoyed a relatively quick path to citizenship after enlisting.
However, heightened vetting procedures introduced in September 2016 created substantial delays. Since then, MAVNI recruits have been subjected to background checks as intensive as those for top secret security clearances; similar though slightly less rigorous background checks were established for LPRs in 2017. These measures effectively suspended the MAVNI program and appear to have contributed to fewer military servicemembers being naturalized since 2016.
Click here to read a policy brief on the role of noncitizens in the U.S. military and recent changes in military naturalizations.
Socioeconomic Characteristics of Naturalized Citizens
Naturalized citizens are, on average, better educated than noncitizens. Thirty-seven percent of naturalized adults (ages 25 and older) had at least a bachelor’s degree as of 2019, compared to 27 percent of noncitizen and 33 percent of native-born adults. At the same time, 19 percent of naturalized immigrant adults had not completed high school, a smaller share than noncitizens (35 percent) but larger than the rate for U.S. born (8 percent).
Naturalized citizens also fare comparatively well on several important economic metrics. Median earnings for naturalized men and women ($56,800 and $46,000, respectively) were higher than median earnings for noncitizens ($38,600 for men and $30,600 for women) and on par with those of U.S.-born individuals ($55,500 and $44,600). Median household income for naturalized citizens ($72,500) was higher than that of households headed by noncitizens ($53,100) and the U.S. born ($66,000).
Finally, naturalized citizens have notably higher homeownership rates than noncitizens, similar to the native born: 66 percent of naturalized immigrants and the U.S. born lived in owned housing units in 2019, compared to 35 percent of noncitizens.
Click here for a Migration Policy Institute (MPI) report examining the economic effects of citizenship for immigrants in the United States.
Naturalization-Eligible Population
An estimated 9.1 million LPRs were eligible to apply to become citizens as of January 2019, based on how long they had held LPR status. Mexico was far and away the top country of origin of LPRs potentially eligible to naturalize in 2019, accounting for an estimated 2.5 million or 27 percent. Other top origin countries were China (with 490,000 LPRs), the Philippines (370,000) Cuba (350,000), and the Dominican Republic (340,000).
The top states of residence for green-card holders potentially eligible to naturalize in 2019 were California, New York, Texas, Florida, New Jersey, and Illinois (see Table 2). These six states were home to more than two-thirds of all LPRs eligible to naturalize.
Table 2. Top States of Residence of Lawful Permanent Residents (LPRs) Potentially Eligible to Naturalize, 2019
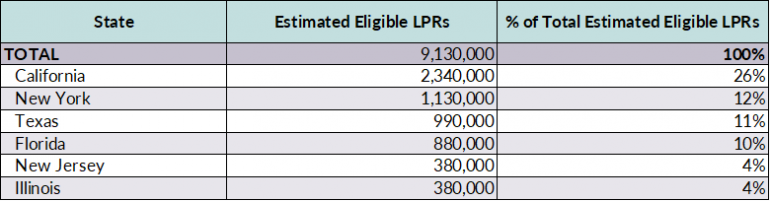
Source: Bryan Baker, Estimates of the Lawful Permanent Resident Population in the United States and the Subpopulation Eligible to Naturalize: 2015-2019 (Washington, DC: DHS Office of Immigration Statistics, 2019), available online.
Sources
Amuedo-Dorantes, Catalina and Mary J. Lopez. 2018. Impeding or Accelerating Assimilation? Immigration Enforcement and Its Impact on Naturalization Patterns. Discussion Paper No. 1814, Centre for Research and Analysis of Migration, University College London, London. Available online.
Baker, Bryan. 2019. Estimates of the Lawful Permanent Resident Population in the United States and the Subpopulation Eligible to Naturalize: 2015-2019. Washington, DC: U.S. Department of Homeland Security (DHS), Office of Immigration Statistics. Available online.
Boyd, Jason and Greg Chen. 2019. USCIS Processing Delays Have Reached Crisis Levels under the Trump Administration. Policy Brief, American Immigration Lawyers Association, Washington, DC, January 2019. Available online.
Chishti, Muzaffar, Austin Rose, and Stephen Yale-Loehr. 2019. Noncitizens in the U.S. Military: Navigating National Security Concerns and Recruitment Needs. Washington, DC: Migration Policy Institute. Available online.
Economist. 2019. The Trump Administration Is Driving up Citizenship Applications. Economist, January 22, 2019. Available online.
Hackman, Michelle. 2020. Federal Judge Temporarily Blocks Immigration Fee Increases. Wall Street Journal, September 29, 2020. Available online.
Straut-Eppsteiner, Holly. 2021. U.S. Naturalization Policy. Washington, DC: Congressional Research Service. Available online.
Teke, John. 2018. U.S. Naturalizations: 2017. Washington, DC: DHS Office of Immigration Statistics. Available online.
U.S. Census Bureau. N.d. 2019 American Community Survey—Table S0501: Selected Characteristics of the Native and Foreign-Born Populations. Accessed November 3, 2021. Available online.
U.S. Citizenship and Immigration Services (USCIS). 2021. Military Naturalization Statistics. Updated March 3, 2021. Available online.
---. 2020. Number of Form N-400, Application for Naturalization, by Category of Naturalization, Case Status, and USCIS Field Office Location. Available online.
---. N.d. Historical National Median Processing Time (in Months) for All USCIS Offices for Select Forms by Fiscal Year. Accessed November 3, 2021. Available online.
U.S. Citizenship and Immigration Services Ombudsman. 2018. Annual Report 2018. Washington, DC: DHS. Available online.
U.S. Department of Homeland Security (DHS), Office of Immigration Statistics. 2020. Yearbook of Immigration Statistics. Updated October 27, 2020. Available online.