

Refugees and Asylees in the United States

A Burundian refugee family outside their home in Boise, Idaho. (Photo: Giuseppe Saitta/IRC)
Fewer than 1 percent of formally recognized refugees worldwide are resettled annually, with about 125,600 individuals departing to resettlement countries in 2016. The United States has historically led the world in terms of refugee resettlement, and today remains the top resettlement country. In fiscal year (FY) 2016, the United States resettled 84,994 refugees. Beyond accepting refugees for resettlement from countries of first asylum, the United States also grants humanitarian protection to asylum seekers who present themselves at U.S. ports of entry or claim asylum from within the country; in FY 2015 (the most recent data available), the United States granted asylum to 26,124 individuals.
Global mass displacement reached a record high of 65.3 million people by the end of 2015, according to the United Nations High Commissioner for Refugees (UNHCR). Approximately 21.3 million of these individuals were refugees, 40.8 million were internally displaced persons (IDPs), and 3.2 million were asylum seekers. The ongoing civil war in Syria alone has led 4.9 million Syrians to seek refuge in neighboring countries, most notably Turkey and Lebanon, and caused 6.6 million to be internally displaced.
In response to the worsening global humanitarian crisis, the Obama administration increased the number of refugees the United States accepts annually, from 85,000 in fiscal year (FY) 2016 to 110,000 in FY 2017. Since assuming office in January 2017, President Donald Trump has issued executive orders to cut the refugee admission ceiling for FY 2017 from 110,000 to 50,000, and to suspend the refugee resettlement program for 120 days. These policy changes have been challenged in federal court and are presently blocked from implementation. So far this fiscal year, more than 42,000 refugees have been resettled.
Using the most recent data available, including refugee arrival figures from the State Department and asylum data from the Department of Homeland Security’s 2015 Yearbook of Immigration Statistics, this Spotlight examines characteristics of the U.S. refugee and asylee populations, including top countries of origin and top states for resettled refugees. It also provides the numbers of refugees and asylees who have become lawful permanent residents (LPRs), which refugees (but not asylees) are required to do within a year of arrival.
Note: All yearly data are for the government's fiscal year (October 1 through September 30).
Click on the bullet points below for more information:
- Refugee Admission Ceiling
- Refugee Arrivals and Countries of Origin
- Top Refugee-Receiving States
- Religious Composition of Refugees
- Age and Gender for Top Refugee Groups
- Asylees
- Adjusting to Lawful Permanent Resident Status
The number of persons who may be admitted as refugees each year is established by the President in consultation with Congress. At the beginning of each fiscal year, the President sets the number of refugees to be accepted from five global regions, as well as an unallocated reserve if a country goes to war or more refugees need to be admitted regionally. In the case of an unforeseen emergency, the total and regional allocations may be adjusted.
Once granted U.S. protection, refugees and asylees are authorized to work and may also qualify for assistance (including cash and medical, housing, educational, and vocational services) to facilitate their economic and social integration into the society.
After the most recent peak of 142,000 refugees admitted for resettlement in 1993 (largely a response to the Balkan wars), the annual admission ceiling steadily declined. In 2008, the ceiling was raised by 10,000 to accommodate an expected increase in refugees from Iraq, Iran, and Bhutan. From 2008 to 2011, the annual ceiling remained at 80,000; it was reduced to 76,000 in 2012, and further reduced to 70,000 in 2013, where it remained until 2016 (see Figure 1).
Figure 1. Annual Refugee Resettlement Ceiling and Number of Refugees Admitted, FY 1980-2017*
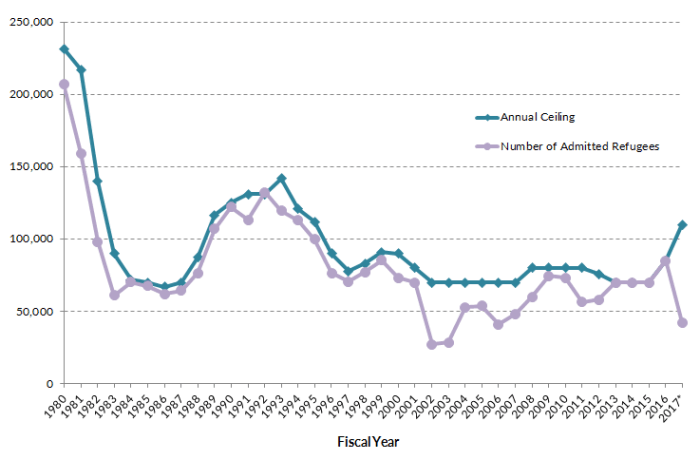
* Data for FY 2017 are partial and refer to resettlement between October 1, 2016 and April 30, 2017.
Source: U.S. Department of State, Bureau of Population, Refugees, and Migration, “Proposed Refugee Admissions for Fiscal Year,” various years, and Migration Policy Institute (MPI) analysis of Worldwide Refugee Admissions Processing System (WRAPS) data from the State Department, Bureau of Population, Refugees, and Migration, available online.
The Obama administration’s increase to 85,000 resettlement places for FY 2016 and 110,000 for FY 2017 marked the largest yearly increases in refugee admissions since 1990. The proposed ceiling for FY 2017 would include 40,000 resettlement places for refugees from the Near East and South Asia (up 4,000 from 2016); 12,000 from East Asia (down 1,000); 35,000 from Africa (up 10,000); 5,000 from Latin America and the Caribbean (up 2,000); and 4,000 from Europe and Central Asia (no change). The unallocated reserve also increased from 6,000 in 2016 to 14,000 in 2017.
However, in Executive Order 13780 (“Protecting the Nation from Foreign Terrorist Entry into the United States”), the Trump administration reduced the 110,000 admission ceiling for FY 2017 to 50,000. The executive order also suspends the refugee resettlement program for 120 days, to enhance vetting procedures for refugee admission, and grants state and local jurisdictions a role in the process of determining refugee placement in their jurisdictions.
In the first seven months of FY 2017 (October 1, 2016 through April 30, 2017), 42,414 refugees were admitted, only a few thousand short of the executive order’s new ceiling of 50,000 (see Figure 1). At the time of this writing although the revised executive order was blocked nationwide by a federal court before it took effect, refugee arrivals had dropped significantly since its signing compared to the same period last year: 2,070 refugees arrived in March 2017 compared to 6,229 during the same month a year earlier, and 3,316 in April 2017 compared to 5,857 in April 2016.
While the confusion over the executive order and its injunction likely contributed to the decline in admissions, there was another, less-noted reason. When Congress included budget constraints in a temporary spending measure in fall 2016, the State Department introduced weekly quotas on refugee admissions, which it then lifted in May 2017 when lawmakers passed a bill to fund the government through FY 2017. Without the weekly quotas, the admission numbers are likely to increase; however, refugee advocates remain concerned about future flows because security vetting of prospective refugees has slowed and the Trump administration may again try to significantly curtail U.S. resettlement efforts.
Click here for a fact sheet on U.S. refugee resettlement.
Click here for a fact sheet on the revised executive order on refugee resettlement and travel ban.
Refugee Arrivals and Countries of Origin
In FY 2016, 84,994 individuals arrived in the United States as refugees, according to data from the State Department’s Worldwide Refugee Admissions Processing System (WRAPS). This represents a 22 percent increase from the 69,933 admitted in FY 2015 (see Figure 2).
Figure 2. U.S. Refugee Arrivals by Region of Nationality, FY 2000-17*
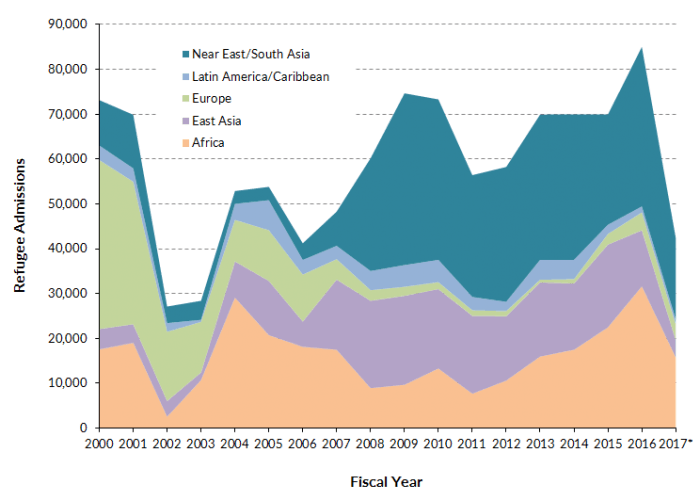
* Data for FY 2017 are partial and refer to resettlement between October 1, 2016 and April 30, 2017.
Notes: Eligible family members granted follow-to-join refugee status are included in the refugee admissions data. In contrast, Special Immigrant Visa (SIV) recipients who received refugee program reception and placement benefits are not included in the data.
Source: MPI analysis of State Department WRAPS data.
Nearly 80 percent of the 42,400 refugees admitted in the first seven months of FY 2017 were from Africa or Near East/South Asia. Nationals of the Democratic Republic of Congo (DRC), Iraq, and Syria were the top three origin groups, representing 46 percent (19,509 individuals) of all arrivals (see Table 1). Somalia, Burma, Ukraine, Bhutan, Iran, Eritrea, and Afghanistan rounded out the top ten.
Table 1. Top Ten Origin Countries of Refugee Arrivals, FY 2015-17*
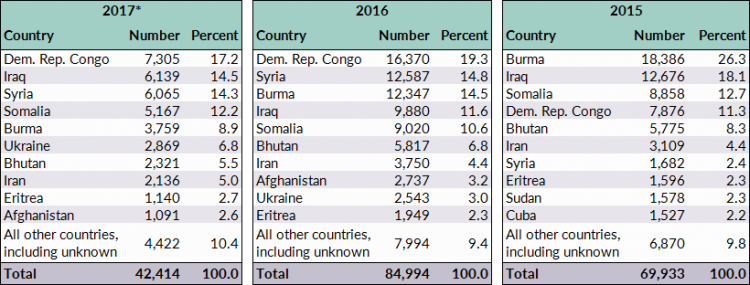
* Data for FY 2017 are partial and refer to resettlement between October 1, 2016 and April 30, 2017.
Source: MPI analysis of State Department WRAPS data.
Compared to previous years, the flow of refugees from Burma (also known as Myanmar) has declined moderately, from 26 percent in 2015, to 15 percent in 2016 and 9 percent so far in 2017. Over the past decade, Burmese refugees have been the largest group resettled to the United States, representing 23 percent (163,451) of the 708,354 refugees admitted since 2007. Iraqis were next at 20 percent (141,787 individuals), followed by the Bhutanese at 13 percent (92,685 refugees).
Figure 3. Number of Admitted Burmese and All Other Refugees, FY 2007-17*
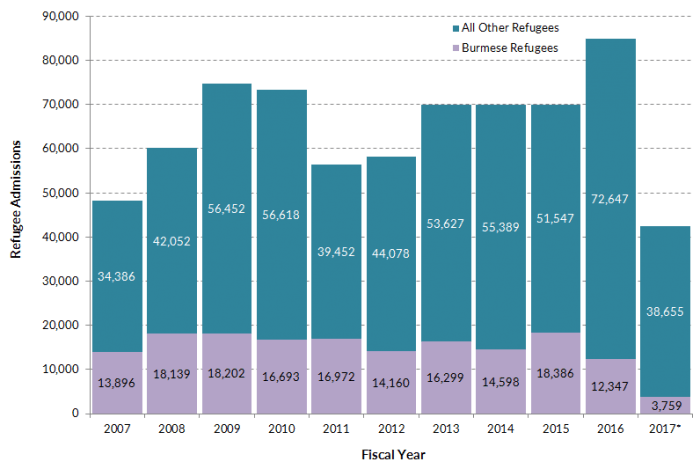
* Data for FY 2017 are partial and refer to resettlement between October 1, 2016 and April 30, 2017.
Source: MPI analysis of State Department WRAPS data.
Meanwhile, flows of refugees from Syria, DRC, and Ukraine have increased significantly. Between 2015 and 2017, the share of Syrians among the total increased from 2 percent to 15 percent; of DRC refugees, from 11 percent to 17 percent; and of Ukrainians, from 2 percent to 7 percent (see Table 1).
Click here to read an article on Syrian refugees resettled in the United States.
Amid widespread gang violence in Central America, admission of refugees from this region has been relatively low, despite the establishment and expansion of the Central American Minors (CAM) program. In December 2014, the Obama administration established an in-country refugee and parole program in El Salvador, Guatemala, and Honduras for children under age 21 whose parents are lawfully present in the United States. On July 26, 2016, the administration announced the expansion of the program to include additional eligible family members. However, admissions have been low: Parents have filed some 11,000 applications, but just more than 2,400 individuals were admitted to the United States as of February 22, 2017, according to the New York Times.
Click here to read a report on in-country processing in Central America.
During the first seven months of FY 2017, roughly consistent with prior years, top initial resettlement states were California (10 percent, or 4,183 individuals) and Texas (9 percent, or 3,871 individuals). Other major receiving states included New York (6 percent, or 2,402), and 5 percent for each of the following states: Washington (2,210), Ohio (2,152), Michigan (2,121), and Arizona (1,913). Fifty-five percent of all refugees were resettled in the top ten states (see Figure 4).
Figure 4. Refugee Arrivals by Initial State of Residence, FY 2017*
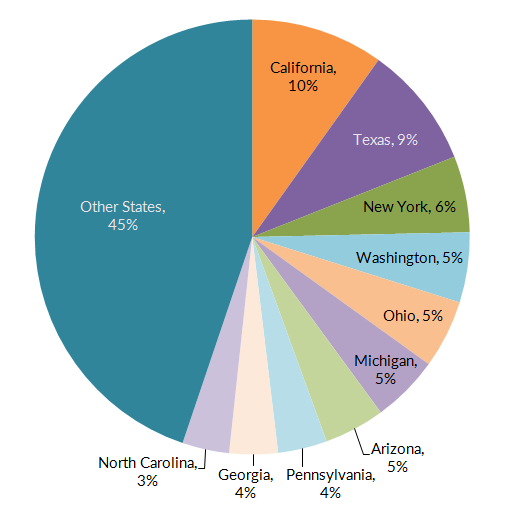
* Data for FY 2017 are partial and refer to resettlement between October 1, 2016 and April 30, 2017.
Source: MPI analysis of State Department WRAPS data.
States also differ quite significantly by country of origin of refugees resettled. For instance, although Burmese refugees have been the largest group admitted to the United States since 2007, they represented the top group in just 23 states, of the 49 states and the District of Columbia in which resettlement occurs (Wyoming is the exception). Twelve states, including California and Michigan, resettled more Iraqis than any other group in the past decade; meanwhile, Florida and Nevada received more Cuban refugees than other groups (see Figure 5).
Figure 5. Largest Resettled Refugee Groups by State of Initial Resettlement, FY 2007-17*
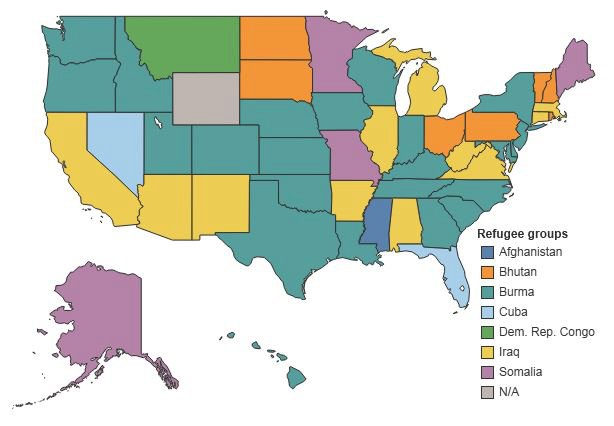
* Data for FY 2017 are partial and refer to resettlement between October 1, 2016 and April 30, 2017.
Source: MPI analysis of State Department WRAPS data.
Arriving refugees are placed in different communities based on factors including family ties, refugee needs, and receiving community language services, health care, education, housing availability, cost of living, and job opportunities.
Since 2015, citing concerns ranging from limited federal funding and use of local resources to potential national security threats, states and localities have become increasingly vocal about playing a greater role in the resettlement process and having a choice of how many refugees should be placed in their communities, if any at all. In 2016, Texas, Kansas, New Jersey, and Maine announced their intention to withdraw from the federal refugee resettlement program, after which basic refugee services would instead be administered through local resettlement agencies, as already occurs in a number of other states.
Note: the figures presented here do not account for secondary migration of refugees who move between states after they are initially resettled.
Religious Composition of Refugees
Overall, the United States admitted more Christian refugees in the past decade than Muslim ones. Between October 2007 and April 2017, 329,412 Christian refugees entered the United States, representing 47 percent of the 708,354 refugees resettled during this period. In comparison, 32 percent, or 229,883 refugees admitted during the period, were Muslim.
FY 2016 marked the first time since 2007 when the United States resettled more Muslim refugees than Christians. In that year, 84,944 refugees were admitted; of these, 46 percent (38,900) were Muslim and 44 percent (37,521) were Christian (see Figure 6). More than half of Muslim refugees were from Syria (32 percent) or Somalia (23 percent), or 12,486 and 9,012 refugees respectively. Other top groups included those from Iraq (20 percent, 7,853), Burma (8 percent, 3,145), and Afghanistan (7 percent, 2,664).
Figure 6. Religious Composition of Refugees Admitted to the United States, FY 2007-17*
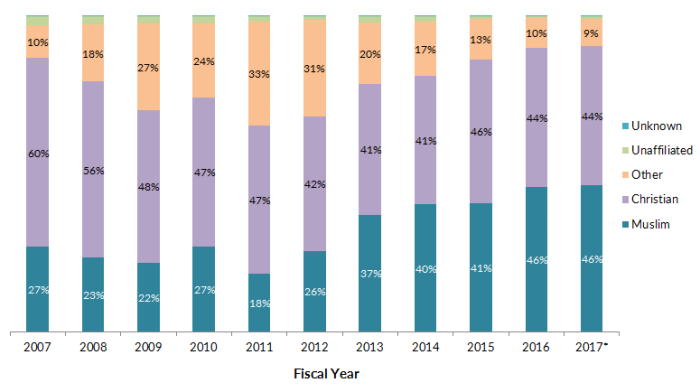
* Data for FY 2017 are partial and refer to resettlement between October 1, 2016 and April 30, 2017.
Source: MPI analysis of State Department WRAPS data.
During the first seven months of FY 2017, the religious composition of newly entering refugees largely followed the pattern of the previous fiscal year, and it remains unclear how enhanced vetting called for by the Trump administration could affect future Muslim refugee admissions.
Age and Gender for Top Refugee Groups
The U.S. refugee resettlement program focuses on the most vulnerable populations and those with the best prospects for long-term integration. Individuals with critical medical conditions or disabilities and families with young children are typically prioritized for resettlement. In FY 2017, children under age 14 and women made up 67 percent of refugees from Iraq and Burma, and 71 percent of refugees from the DRC, Somalia, and Syria.
In FY 2015 (the most recent data available), 26,124 persons were granted asylum either affirmatively or defensively, a 12 percent increase from the 23,374 gaining asylum in 2014, according to the Department of Homeland Security (DHS) Yearbook of Immigration Statistics. Of these, 68 percent (17,878) were granted asylum affirmatively, while the remaining 32 percent, or 8,246 cases, were granted asylum defensively.
An additional 7,116 individuals who resided outside the United States were approved for derivative follow-to-join status as immediate family members of principal asylum applicants. (Note: this number reflects travel documents issued to these family members, not their arrival to the United States.)
Nationals of China, El Salvador, and Guatemala accounted for 40 percent (10,447 persons) granted affirmative or defensive asylum status in FY 2015 (see Table 2). Notably, the number of Syrians who received asylum status grew from 60 in 2011 to 364 in 2012, and more than doubled to 974 in 2015. A significant number of applications are still under review due to processing backlogs.
Table 2. Affirmative, Defensive, and Total Asylees by Country of Nationality, 2015
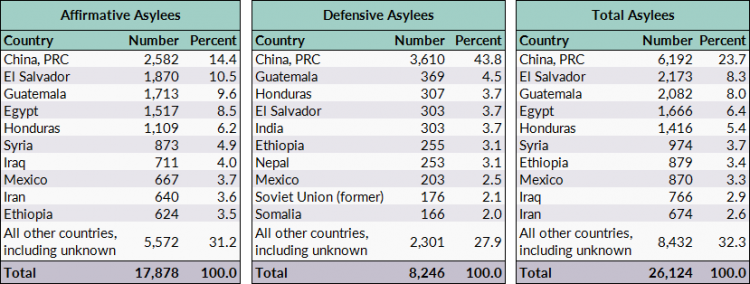
Source: Department of Homeland Security (DHS), Office of Immigration Statistics, 2015 Yearbook of Immigration Statistics, available online.
Adjusting to Lawful Permanent Resident Status
In 2015, 151,995 refugees and asylees adjusted their status to lawful permanent residence, of which 78 percent (118,431) were refugees and the remainder, 33,564, were asylees (see Figure 7).
Figure 7. Refugees and Asylees Granted Lawful Permanent Residence, FY 2001-15
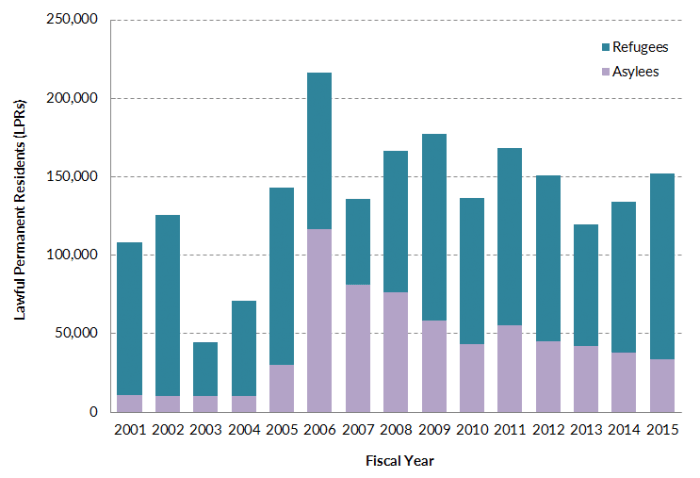
Source: DHS, Office of Immigration Statistics, Yearbook of Immigration Statistics, various years.
Refugees must apply for lawful permanent resident (LPR) status—also known as getting a green card—one year after being admitted to the United States. Asylees become eligible to adjust to LPR status also after one year of residence, but are not required to do so. As lawful permanent residents, refugees and asylees have the right to own property, attend public schools, join certain branches of the U.S. armed forces, and travel internationally without an entry visa, and may apply for U.S. citizenship five years after being admitted as a refugee.
Until 2005, there was an annual limit of 10,000 on the number of asylees authorized to adjust to LPR status. The REAL ID Act eliminated that cap. No annual limit exists on the number of refugees eligible to adjust to LPR status.
Sources
Capps, Randy and Michael Fix. 2015. Ten Facts about U.S. Refugee Resettlement. Washington, DC: Migration Policy Institute. Available online.
Chishti, Muzaffar and Sarah Pierce. 2016. U.S. Meets 2016 Syrian Refugee Admission Goal; Opposition to New Resettlement Mounts. Migration Information Source, September 28, 2016. Available online.
Harris, Gardiner. 2017. U.S. Quietly Lifts Limit on Number of Refugees Allowed In. The New York Times, May 26, 2017. Available online.
Hoffman, Meredith. 2017. Far Fewer Refugees Entering US Despite Travel Ban Setbacks 2017. Associated Press, May 10, 2017. Available online.
Pierce, Sarah and Doris Meissner. 2017. Revised Trump Executive Order and Guidance on Refugee Resettlement and Travel Ban. Washington, DC: Migration Policy Institute. Available online.
Park, Haeyoun and Larry Buchanan. 2017. Refugees Entering the U.S. Already Face a Rigorous Vetting Process. The New York Times, January 29, 2017. Available online.
Robles, Frances and Kirk Semple. 2017. Trump’s New Ban Leaves Few Spots for Refugees, Even the Hunted. The New York Times, March 7, 2017. Available online.
State of Maine, Office of Governor Paul R. LePage. 2016. Maine Withdraws from Federal Refugee Program. Press release, Office of Governor Paul R. LePage, October 17, 2016. Available online.
United Nations High Commissioner for Refugees (UNHCR). 2016. Global Trends: Forced Displacement in 2015. Geneva: UNHCR. Available online.
---. N.d. Resettlement. Accessed June 5, 2017. Available online.
U.S. Department of Homeland Security (DHS). 2016. U.S. Expands Initiatives To Address Central American Migration Challenges. Washington, DC: DHS. Available online.
DHS, Office of Immigration Statistics. 2016. 2015 Yearbook of Immigration Statistics. Washington, DC: DHS, Office of Immigration Statistics. Available online.
U.S. Department of State, Bureau of Population, Refugees, and Migration. N.d. Refugee Processing Center - Admissions & Arrivals. Accessed May 12, 2017. Available online.
U.S. Department of State, Department of Homeland Security, and Department of Health and Human Services. 2016. Proposed Refugee Admissions for Fiscal Year 2017: Report to the Congress. Washington, DC: Department of State. Available online.
Zong, Jie and Jeanne Batalova. 2017. Syrian Refugees in the United States. Migration Information Source, January 12, 2017. Available online.