

Slowing U.S. Population Growth Could Prompt New Pressure for Immigration Reform

Two men talk during a retiree luncheon. (Photo: Luke Burns/U.S. Army)
The 2020 decennial census revealed a near-record decline in U.S. population growth over the last decade. Between 2010 and 2020 the population grew just 7.4 percent—the second-lowest rate of any decade since the country’s first census in 1790, and just a hair faster than the record-low 7.3 percent growth rate during the 1930s, amid the Great Depression.
One important component of this overall slower growth is reduced immigration, which had been a significant driver of recent U.S. population increase. Legal immigration has remained more or less steady, but the number of unauthorized immigrants has shrunk since 2007. Particularly notable is the decline in the Mexican-born population—especially those who are unauthorized—which is a trend that is both sharp and underappreciated.
Slowed immigration has considerable implications for the future U.S. labor market, changes in the composition of the foreign-born population, and its distribution across the states. These dynamics could potentially affect public perceptions of immigration and may open the political space for engaging in long postponed but much-needed reforms to U.S. policy. Indeed, advocates for greater immigration already are using the census findings to help further their case that immigration will be important for continued economic growth and vitality for the United States.
The 2020 Census: Decline in Population Growth
As was the case during when population growth was at its lowest during the Great Depression, poor economic conditions have in recent years contributed to lower U.S. birthrates. In this regard, the United States is following the trend of most other industrialized nations, where fertility rates are below the replacement rate of 2.1 births per woman needed to maintain a stable population. The “baby boom” years saw U.S. fertility rate exceed three births per woman, but the rate fell below replacement during the 1970s and never fully recovered. During the 1990s and 2000s, the U.S. fertility rate rebounded to just shy of the replacement rate, according to UN figures. But unemployment spiked and incomes fell during the 2007-09 Great Recession, leading to a decline in fertility. Even when employment and incomes rebounded in the early 2010s, fertility did not; the rate fell to less than 1.9 on average from 2010 through 2015. Following the COVID-19 pandemic and accompanying severe economic hardship, preliminary data suggest U.S. fertility dropped below 1.7 births per women in 2020.
Without sustained birth rates above 2.1, societies shrink and the average age rises. This leads to a higher ratio of retirees to active workers, which reduces support for an aging population by straining the tax base and Social Security and Medicare systems. Although these programs have faced long-term financial threats, the United States has so far escaped the worst-case scenario of a declining labor force. Instead, the nation has experienced substantial labor force growth in recent decades, almost exclusively due to immigration—at least until the 2007-09 recession. Indeed, even with its current low birth rate, the United States finds itself with a demographic edge over China, Japan, Russia, and many European countries, which are experiencing more rapid aging and have had below-replacement fertility rates for longer periods of time.

Slowdown in Immigration Accompanies Drop in Birth Rates
The United States experienced sustained high immigration during the 1990s and 2000s, increasing the foreign-born population by 11.3 million and 8.9 million, respectively (see Figure 1). Alongside rebounding fertility, immigration fueled strong overall population growth.
Figure 1. U.S. Foreign-Born Population, 1850-2019
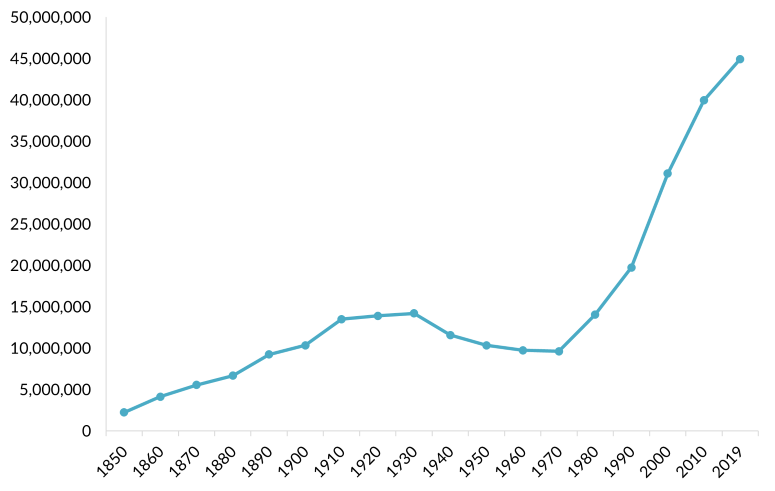
Sources: Migration PoIicy Institute (MPI) analysis of data from the 1970, 1980, 1990, and 2000 U.S. Decennial Censuses and the 2010 and 2019 American Community Surveys (ACS); Gibson, Campbell J. and Emily Lennon, “Historical Census Statistics on the Foreign-Born Population of the United States: 1850 to 1990” (Working Paper no. 29, U.S. Census Bureau, Washington, DC, February 1999), available online.
But the 2007-09 recession hit the job market for immigrants especially hard, reducing the economic incentive for migration. Between 2010 and 2019, the U.S. foreign-born population grew by less than 5 million, and in 2018 and 2019 it grew by just 400,000—a far cry from the much higher growth during the 1990s and 2000s. Under President Donald Trump, the United States reduced the number of refugee admissions, enacted additional vetting requirements for other legal immigrants, barred entry of certain country nationals, and made it increasingly difficult for people to seek asylum at the U.S.-Mexico border, all of which contributed to slowing the increase in the foreign-born population despite record-low U.S. unemployment. Data for 2020 were not available as of this writing (the census did not record whether individuals are U.S.- or foreign-born), but sustained border closures, further restrictions on legal immigration, and dramatic slowdowns in visa processing at U.S. consulates overseas during the pandemic suggest the foreign-born population grew at an even slower rate, or perhaps even declined.
Still, the slowdown in immigration was not experienced evenly among all immigrant groups. Legal immigration remained largely unchanged until the pandemic, but illegal immigration declined after the 2007-09 recession. The nation’s largest immigrant nationality group, Mexicans, also declined substantially in population since the recession. Additionally, more foreign-born residents come from Asia and, albeit at a slower rate, Africa than in the past; arrivals of new Chinese and Indian immigrants have exceeding the number coming from Mexico since 2013. Newer immigrants, including those from Mexico, also tend to be better educated and hold higher-skilled jobs. Thus, not only has the immigrant population grown more slowly, but its composition has also changed.
Drop in Unauthorized Migration—not Legal Immigration—Drives the Slowdown
Legal permanent immigration to the United States (i.e., the number of individuals receiving green cards) remained mostly unchanged from fiscal year (FY) 2010 through FY 2019 because family ties largely determine immigration. This population of lawful permanent residents (LPRs) is constantly increasing, although some groups have statutory caps, leading to years-long backlogs. Because demand for green cards far outstrips availability, the number issued each year tends not to fluctuate much due to economic conditions. Between FY 2000 and FY 2019, the number of green cards issued annually exceeded 1 million except for FY 2003, FY 2004, and FY 2013. There was, however, a slowdown in green-card processing during the pandemic, as U.S. Citizenship and Immigration Services (USCIS) and consulates overseas shut or reduced their operations.
Temporary admissions of nonimmigrants such as international students, exchange visitors, and temporary workers increased from about 5 million in FY 2010 to 6.6 million in FY 2019, although such admissions rose very little after FY 2016. (Many nonimmigrants stay for less than a year, so the total in the country during any given year is substantially lower.) International student admissions fell after 2016, while nonimmigrant worker admissions rose slowly from FY 2016 to FY 2019 as the labor market improved and more workers renewed their visas. As with green cards, nonimmigrant visa processing slowed considerably during 2020 due to pandemic-related restrictions and processing slowdowns.
Unauthorized immigration, however, slowed considerably over the past decade. Though estimates vary slightly among researchers, the pattern is clear: the number of unauthorized immigrants rose rapidly from about a population of about 3 million in the late 1980s to about 8 million in 2000 and to about 12 million in 2007. Then, by all accounts, the population declined; the Migration Policy Institute (MPI) has estimated that there are approximately 11 million unauthorized immigrants in the United States, which is in the middle of most recent estimates ranging from 11.4 million to 10.4 million during the 2018-19 period.
Migrants were apprehended at the border seeking to enter illegally more than 900,000 times in every year from FY 1990 through FY 2006, but this number dropped to the range of 300,000 to 500,000 during most of the past decade. (An increasing share of unauthorized immigrants overstay their visas rather than cross the border illegally, but there has not been enough growth in this population to make up for the drop in border apprehensions.) Recent improvements in border security have increased apprehension rates and reduced the number of migrants who try to cross again illegally after being apprehended.
Unauthorized migration—which in recent years has predominantly originated in Mexico, El Salvador, Guatemala, and Honduras—is a product both of push and pull factors. Migration can be an exit strategy from harsh economic, political, and security conditions in these origin countries. It is also driven by family connections and better job opportunities in the United States. However, job opportunities for unauthorized workers fell precipitously during the 2007-09 recession, with the greatest increase in unemployment among Latino immigrant workers. Even when the economy rebounded after that recession, the unauthorized population did not return to its previous size.
Mexican-Origin Immigrants See Substantial Decline
Mexicans comprise the single largest immigrant group in the United States, accounting for nearly half of unauthorized immigrants and one-quarter of the total foreign-born population. The total number of Mexican immigrants—whether legally present or unauthorized—rose dramatically from 1970 to 2007, when it peaked around 11.7 million (see Figure 2).
Figure 2. Mexican-Born Population Residing in the United States, 1960-2019
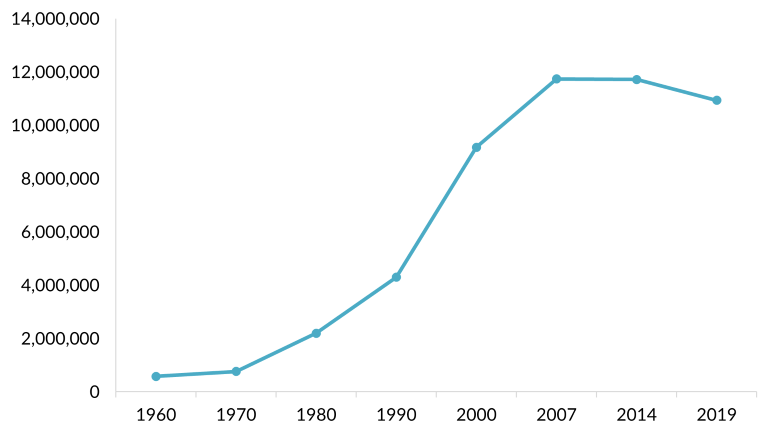
Source: Migration Policy Institute analysis of data from the Decennial U.S. Census of Population and Housing (Census), 1960-2000, and American Community Survey (ACS), 2007, 2014, and 2019.
Like the overall unauthorized population, growth in the number of immigrants from Mexico stalled after the Great Recession, fluctuating up and down until 2014 and then falling to 10.9 million in 2019. This drop was entirely driven by an approximately 2 million-person drop in the Mexican unauthorized population, which fell from approximately 7.5 million in 2007 to 5.5 million in 2018, according to MPI’s estimates. Mexican unauthorized immigrants are among the most susceptible to short-term economic changes. They have tended to fill lower-skilled jobs in sectors that were greatly affected by the 2007-09 recession, for instance construction, and in those affected by the pandemic, such as hospitality, entertainment, and retail trade.
The lawfully present Mexican immigrant population (including both green-card holders and temporary nonimmigrants) has continued to grow slightly in recent years, following the patterns described above for all legal immigrants.
Shift in Immigrant Origins May Affect Distribution of Immigrant Populations Across States
The 2020 census revealed notable trends at the state level, which may have roots in changing immigration trends. The long-term decline in share of the overall U.S. population in the Northeast and Midwest continued, alongside gains in the Southeast and Mountain West, but at a slower pace than in previous decades.
There are political consequences to this shift. Due to these population changes, California for the first time lost a seat in the U.S. House of Representatives. Pre-census population projections had led to expectations that Texas would gain two seats and that Arizona would gain one; instead, Texas gained just one seat, and Arizona gained none. These three states together accounted for 56 percent of the nationwide Mexican unauthorized immigrant population in 2018, according to MPI calculations. It is possible that Mexican immigrants and their children were undercounted in the 2020 census due to fears they would be questioned about their citizenship, as well as relatively minor and late investment in census outreach in Arizona and Texas. This possible undercounting may have affected the registered population growth in these states.
The geographic distribution patterns of other immigrants from Latin America—such as Central American migrants who have arrived in large numbers at the U.S.-Mexico border—have not followed the same pattern as Mexicans. In particular Salvadorans, who account for the largest group of Central American immigrants, tend to be somewhat less concentrated in the Southwest and more represented on the East Coast.
Moreover, Asian immigrants who have dominated recent flows have tended to favor coastal metropolitan areas and not necessarily the Southwestern and Southeastern states that benefited from rapid Mexican immigration during the 1990s and early 2000s. Thus, if the slowdown in Mexican immigration persists alongside rising arrivals from Asia, as is expected, this could contribute to slower growth in the Sun Belt. From 2010 to 2019, the share of the U.S. immigrant population living in the 20-state “heartland” region between the Appalachians and the Rockies increased from 24 percent to 31 percent.
Demand for Immigrant Labor in the Aftermath of the Pandemic?
Geographic patterns aside, the slowdown in immigration, particularly unauthorized immigration from Mexico, has implications for future U.S. labor force and economic growth. Mexican immigrants have filled important roles in sectors that experienced worker shortages before COVID-19 and have been again as the nation emerges from the pandemic. Even though there were 10 million fewer U.S. jobs in April than there were before the pandemic, there were only 1.1 unemployed workers for every job opening—near a historic low.
In the restaurant industry, for example, there were 15 percent fewer workers than before the pandemic, and employers have struggled to hire for rapidly growing demand as the nation reopens. Shortages of agricultural workers preceded the pandemic but became more acute during it, when seasonal farmworkers on H-2A visas had difficulty entering the country due to border restrictions. The number of temporary workers on H-2A visas has generally increased in recent years, as the number of unauthorized immigrant agricultural workers has declined. More broadly, barriers such as lack of child care, fear of the coronavirus, low wages, and poor working conditions are deterring some U.S.-born workers from returning to their old jobs. Resulting shortages may drive demand for more immigrant workers.
Perhaps not coincidentally, arrests of Mexicans illegally crossing the U.S. border have risen in recent months, although most have been expelled under a public-health order implemented at the start of the pandemic. It is too early to tell whether the number of unauthorized immigrants from Mexico will rebound significantly as the labor market improves or when the public-health order is withdrawn. Notwithstanding recent difficulties related to the pandemic and an uptick in violent crime, longer-term trends in Mexico suggest emigration will decline, as the country’s birth rate continues to fall, its labor market improves, and educational opportunities expand.
The Biden administration’s multitrillion-dollar recovery proposals would dramatically increase federal investment in infrastructure such as roads, transportation, and utility systems, while also expanding availability of child care, preschool, and community college. If passed, these plans would generate substantial additional demand for workers in construction, manufacturing, education, child care, and related services, which are sectors that have often relied on immigrants including large numbers from Mexico.
Implications for Reforms to the U.S. Immigration System
President Joe Biden has endorsed legislation that would gradually legalize most of the 11 million unauthorized immigrants in the country—a central but hotly debated element of most immigration reform debates over the last 20 years. Opponents of legalization have frequently argued that controlling illegal immigration—especially from Mexico—should come first. Evidence that the number of unauthorized immigrants is shrinking may help address their concerns. At the same time, it appears that immigrant workers will be in higher demand due the slowdown in overall population growth. These factors could combine to provide a more compelling argument that legalizing unauthorized migrants would benefit the U.S. labor market.
Proponents of reform have also argued for increasing legal pathways for employment-based immigration. New census data and demands on the labor market might support their case. Aside from legalization, pressures in the short term could support expanding the existing H-2A and H-2B programs for agricultural and other low-skilled workers. Such proposals have been on the table for years and have at times garnered bipartisan support. These programs could target Central American migrants who, absent legal migration channels, have primarily entered the United States illegally and sought asylum. Opening up a portion of these temporary work programs to Central Americans could help address labor shortages in the United States while also reducing pressure on the Southwest border.
If there is a sustained longer-term demand for lower-skilled immigrant workers, then these temporary admissions could lead to pathways for permanent residence. MPI has proposed a new “bridge visa” allowing workers on temporary stays to apply for permanent residence with their employers’ support or if they demonstrate a consistent employment history in the United States. If they do not apply to become a permanent resident, then the bridge visa would remain temporary and the worker would leave the country when it expires.
Finally, any reformed immigration system should have a built-in flexibility to respond to changing labor market conditions. MPI has recommended that the federal government develop an expert body to guide Congress in setting immigration levels on a periodic basis. This guidance could be based on careful monitoring of census and workforce data to ensure that the number of admitted workers matches labor market demand. Under this mechanism, immigration levels could be reduced when another crisis emerges such as the 2007-09 recession or the COVID-19 pandemic.
Whatever the trajectory of specific economic sectors, demographic changes revealed by the 2020 census suggest there may be the political space to expand the number of legal immigrants in coming years, if only to maintain the current size of the U.S. labor force. Given a falling birth rate, the United States may otherwise continue to experience labor shortages that lead to rising inflation, slower economic growth, and a shrinking tax base to support an aging population. This is a demographic trap into which nations such as Japan, China, and several European countries have fallen. The United States may be able to escape this fate if it builds on its history of immigrant integration and more actively views foreign-born workers as one important component of the solution to U.S. worker shortages.
Sources
Capps, Randy, Julia Gelatt, Ariel G. Ruiz Soto, and Jennifer Van Hook. 2020. Unauthorized Immigrants in the United States: Stable Numbers, Changing Origins. Washington, DC: Migration Policy Institute (MPI). Available online.
Chishti, Muzaffar and Jessica Bolter. 2021. Border Challenges Dominate, But Biden’s First 100 Days Mark Notable Under-the-Radar Immigration Accomplishments. Migration Information Source, April 26, 2021. Available online.
Chishti, Muzaffar, Julia Gelatt, and Doris Meissner. 2021. Rethinking the U.S. Legal Immigration System: A Policy Road Map. Washington, DC: MPI. Available online.
Frey, William H. 2020. The Past Decade’s Foreign-Born Population Gains Will Be the Smallest Since the 1970s. Washington, DC: Brookings Institution. Available online.
---. 2021. Census 2020: First Results Show Near Historically Low Population Growth and A First-Ever Congressional Seat Loss for California. Washington, DC: Brookings Institution. Available online.
Hamilton, Brady E., Joyce A. Martin, and Michelle J.K. Osterman. 2021. Births: Provisional Data for 2020. Vital Statistics Rapid Release (12). Available online.
Hanna, Mary and Jeanne Batalova. 2021. Immigrants from Asia in the United States. Migration Information Source, March 10, 2021. Available online.
Kotkin, Joel et al. 2021. The Emergence of the Global Heartland. Bentonville, AR: Heartland Forward. Available online.
Li, Yun and Nate Rattner. 2021. As the U.S. Economy Restarts from the Pandemic, Parts of It Are Severely Broken. CNBC, May 11, 2021. Available online.
Migration Policy Institute (MPI). N.d. Unauthorized Immigrant Data Profiles. Accessed May 18, 2021. Available online.
Nation’s Restaurant News. 2021. The Labor Shortage: Next Pandemic for Restaurants. Nation’s Restaurant News, May 12, 2021. Available online.
Olsen-Medina, Kira and Jeanne Batalova. 2020. College-Educated Immigrants in the United States. Migration Information Source, September 16, 2020. Available online.
Pierce, Sarah and Jessica Bolter. 2020. Dismantling and Reconstructing the U.S. Immigration System: A Catalog of Changes under the Trump Presidency. Washington, DC: MPI. Available online.
United Nations Department of Economic and Social Affairs (DESA), Population Dynamics. N.d. World Population Prospects 2019: Total Fertility (Children per Woman). Accessed May 28, 2021. Available online.
U.S. Customs and Border Protection. N.d. U.S. Border Patrol Southwest Border Apprehensions by Sector. Accessed May 18, 2021. Available online.
U.S. Department of Homeland Security (DHS), Office of Immigration Statistics (OIS). 2020. Table 1. Persons Obtaining Lawful Permanent Resident Status: Fiscal Years 1820 to 2019. Updated October 27, 2020. Available online.
---. 2020. Table 25d: Nonimmigrant Admissions by Class of Admission: Fiscal Years 2010 to 2019 (Nonimmigrant Admissions 2019 Data Tables). Updated October 15, 2020. Available online.
Weinraub, Mark and Julie Ingwersen. 2020. U.S. Farmers Scramble for Help As COVID-19 Scuttles Immigrant Workforce. Reuters, July 2, 2020. Available online.
White House. 2021. President Biden Sends Immigration Bill to Congress as Part of His Commitment to Modernize our Immigration System. News release, January 20, 2021. Available online.
---. N.d. American Families Plan. Accessed May 18, 2021. Available online.
---. N.d. American Jobs Plan. Accessed May 18, 2021. Available online.