

South American Immigrants in the United States

Click here for a larger version of map.
Compared to other regions of origin in Latin America and around the world, South America has always had relatively few immigrants living in the United States. While the overall population remains lower than those from Mexico, Central America, or the Caribbean, South America's immigrant population grew faster between 2000 and 2010 than all regions but Central America. South American immigrants' share of the overall immigrant population in the United States has also been growing steadily for the past 50 years, from less than 1 percent in 1960 to almost 7 percent in 2011.
As a group, South American immigrants are better educated, less likely to enter the United States as refugees, and more likely to enter as immediate family members than the overall foreign-born population. Despite some differences, South Americans closely mirrored many trends in the overall foreign-born population, including age, arrival period, naturalization rates, and occupations. A closer examination of South American immigrants, however, reveals a great deal of variation by country of birth.
This article focuses on South American immigrants residing in the United States, examining the population's size, geographic distribution, admission categories, and demographic and socioeconomic characteristics. Data are from the U.S. Census Bureau's 2011 American Community Survey (ACS), the 2000 Decennial Census (as well as earlier censuses), and the Department of Homeland Security's (DHS) Office of Immigration Statistics (OIS).
|
Definitions
|
||
|
Size and Geographic Distribution
- In 2011, more than 2.7 million South American immigrants resided in the United States, comprising close to 7 percent of all immigrants.
- South America made up the smallest region of origin of all Latin American immigrants in 2011.
- Between 2000 and 2010, South American immigrants were the second-fastest growing segment of the Latin American immigrant population behind Central Americans.
- The top countries of origin for South American immigrants in 2011 were Colombia, Ecuador, Peru, and Brazil.
- Nearly two-thirds of all South American immigrants resided in four states: Florida, New York, New Jersey, and California.
- Nearly half of all South American-born immigrants lived in two major metropolitan areas: greater New York and Miami.
Modes of Entry and Legal Status
- In 2011, more than 86,000 South American-born immigrants were granted U.S. lawful permanent residency (LPR status, also known as getting a green card).
- South American nationals accounted for a negligible share of refugee arrivals and 7 percent of persons granted asylum in 2011.
- More than 70,000 South American-born immigrants became U.S. citizens through naturalization in 2011.
- The share of South American-born immigrants who have naturalized (47 percent) is close to that of the overall foreign-born population (45 percent).
|
Countries in South America
|
||
|
Demographic and Socioeconomic Overview
- South American immigrant women outnumbered men in 2011.
- The foreign born from South America were more likely than the native born, and nearly equally as likely as the foreign born overall, to be of working age.
- More than half of all South American immigrants have strong English-language skills.
- Rates of English proficiency varied by South American country of origin.
- South American-born adults (ages 25 and older) were nearly equally as likely as U.S.-born adults to have a bachelor's degree or higher level of education.
- Two-thirds of South American-born immigrants arrived in the United States since 1990.
- More than 23 percent of employed South American-born men worked in construction, extraction, and transportation, while 29 percent of South American women worked in service and personal care occupations.
- The South American born were less likely to live in poverty in 2011 than the foreign born overall.
- About 1.1 million children under the age of 18 resided in a household with at least one immigrant parent born in South America.
Size and Geographic Distribution
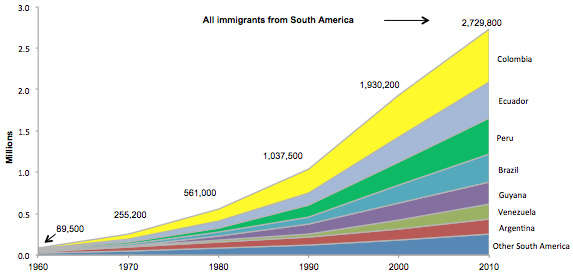
In 2011, more than 2.7 million South American immigrants resided in the United States, representing close to 7 percent of all immigrants.
The South American born made up 2.7 million (about 7 percent) of the country's 40.4 million immigrants in 2011. While this may seem small, this population has grown 30 times its size since 1960, when only about 90,000 South American immigrants resided in the country.
In the past 50 years, both the number of South American immigrants and their share of the total foreign-born population have increased. In 1960, South Americans represented less than 1 percent of all immigrants living in the United States. As shown in Table 1, this share has increased steadily in every subsequent decade. This increase has happened along large increases in immigration from other regions, such as Central America, the Caribbean, and Asia.
|
|
|||||||||||||||||||||||||||||||||||||||||||||||||||||
|
|||||||||||||||||||||||||||||||||||||||||||||||||||||
South America made up the smallest region of origin of all Latin American immigrants in 2011.
The 2.7 million South American born (or 13 percent of the 21.2 million Latin American immigrants in the United States) were the smallest foreign-born group from the region behind those from Mexico (55 percent, or 11.7 million), the Caribbean (18 percent, or 3.8 million), and Central America (15 percent, or 3.1 million).
- Read more about Mexican immigrants in the United States.
- Read more about Central American immigrants in the United States.
Between 2000 and 2010, South American immigrants were the second-fastest growing segment of the Latin American immigrant population behind Central Americans.
During the 2000s, the number of South American-born individuals living in the United States increased from 1.9 million to 2.7 million, a growth rate of 41 percent (see Table 1). This was the second fastest growth rate during this period among the foreign born from Latin America, behind Central Americans (51 percent), but in front of immigrants from Mexico (28 percent) and the Caribbean (26 percent).
|
|
||
|
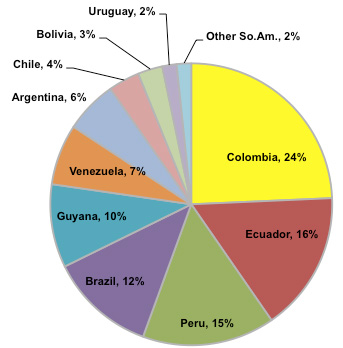
The top countries of origin for South American immigrants in 2011 were Colombia, Ecuador, Peru, and Brazil.
In 2011, the top countries of origin for immigrants from South America were Colombia (658,700 people, or 24 percent), Ecuador (435,500, or 16 percent), Peru (411,800, or 15 percent), and Brazil (329,900, or 12 percent).
- To view other countries of birth for South American immigrants, click here.
|
|
||
|
Nearly two-thirds of all South American immigrants resided in four states: Florida, New York, New Jersey, and California.
Florida was home to the largest number of South American immigrants in 2011, (626,400, or 23 percent of the nation's 2.7 million South Americans), followed by New York (569,700, or 21 percent), New Jersey (316,700, or 12 percent), and California (240,800, or 9 percent).
Other states with South American-born populations greater than 100,000 were Massachusetts (113,100, or 4 percent) and Texas (109,600, or 4 percent).
Nearly half of all South American-born immigrants lived in two major metropolitan areas: greater New York and Miami.
In 2011, the greater New York metropolitan area was home to the largest number of South American immigrants — about 833,300, or 31 percent of the 2.7 million South American born in the United States. The greater Miami area was second with 426,700 South American immigrants, or 16 percent.
Other metropolitan areas with South American-born populations greater than 60,000 included the greater Washington, DC (132,900, or 5 percent), Los Angeles, CA (117,300, or 4 percent), Boston, MA (89,300, or 3 percent), and Orlando, FL (78,100, or 3 percent) metropolitan areas.
Also of note, South Americans made up nearly 22 percent of all immigrants in the larger Orlando (78,100 out of 356,200) and Bridgeport, CT (39,100 out of 180,700) areas, and for 20 percent of the total immigrant population in the greater Miami area (426,700 out of 2.2 million).
Modes of Entry and Legal Status
Note: This section is based on the data from DHS, unless stated otherwise. DHS data refer to the U.S. government's fiscal year, October 1 through September 30. Thus, "2011" refers to October 1, 2010 through September 30, 2011.
In 2011, more than 86,000 South American-born immigrants were granted U.S. lawful permanent residency (LPR status, also known as getting a green card).
In 2011, 86,096 South American immigrants obtained green cards, accounting for 8 percent of the 1.1 million immigrants granted lawful permanent residence. The foreign born from South America gained lawful permanent residence through varying routes during the year: 80 percent obtained green cards through family relationships, 12 percent through employment, 6 percent as refugees or asylees, about 1 percent through the diversity immigrant visa, and about 1 percent through other routes.
About 59 percent of all South American immigrants granted LPR status in 2011 qualified as the immediate family member (spouse, unmarried child under 21, or parent) of a U.S. citizen, compared to 43 percent of all immigrants. In contrast, South Americans were much less likely to obtain green cards through the U.S. diversity visa program compared to immigrants overall (1 percent versus 5 percent).
- Read more about immigrants who became LPRs in 2011 here.
South American nationals accounted for a negligible share of refugee arrivals and 7 percent of persons granted asylum in 2011.
Fewer than 50 South American nationals (all from Colombia) arrived in the United States as refugees in 2011, accounting for a negligible percentage of the 56,384 refugees admitted overall. Historically, relatively few South Americans have ever entered as refugees. Between 2002 and 2011, a total of 1,569 South Americans have entered as refugees, accounting for less than half of a percent of the 515,350 persons who entered the United States as refugees. During this period, the highest number of South Americans admitted as refugees was 579 in 2004; of them, 577 were nationals of Colombia.
Close to 1,800 South American nationals received asylum in 2011, representing 7 percent of the total 24,988 persons granted asylum that year. From 2002 through 2011, South American nationals accounted for 15 percent (38,475) of the 260,951 total individuals granted asylum. Colombia was by far the leading country of origin for South American nationals granted asylum during this time with 27,181 (71 percent of all South American asylum grants), followed by Venezuela (8,722, or 23 percent) and Peru (1,223, or 3 percent).
- Read more about people who received asylum status or arrived as refugees in 2011 here.
More than 70,000 South American-born immigrants became U.S. citizens through naturalization in 2011.
In 2011, 70,485 South American-born immigrants were naturalized in the United States, representing slightly more than 10 percent of the 694,193 new U.S. citizens. The South American countries of birth with the most naturalizations were Colombia (22,693), Peru (10,266), Brazil (10,251), Ecuador (6,929), and Venezuela (6,856).
The share of South American-born immigrants who have naturalized (47 percent) is close to that of the overall foreign-born population (45 percent).
According to 2011 ACS data, about 47 percent of South American immigrants were naturalized U.S. citizens. This was slightly greater than the estimated share among all immigrants, which was about 45 percent.
In 2011, 71 percent of immigrants born in Guyana were naturalized U.S. citizens, making them the most likely of all South American immigrants to have naturalized. Immigrants from Paraguay (54 percent) and Argentina (51 percent) were also more likely to be U.S. citizens than those from other South American countries. The naturalized as a share of the total population were comparatively lower for Brazil (32 percent), Venezuela (36 percent), and Ecuador and Uruguay (42 percent each).
Demographic and Socioeconomic Overview
Note: This section is based on the authors' analysis of 2011 ACS data.
South American immigrant women outnumbered men in 2011.
Of all South American immigrants residing in the United States in 2011, 54 percent were women and 46 percent were men. By contrast, the gender distributions were more balanced among the native born and overall foreign born (about 51 percent female and 49 percent male for each population).
The gender imbalance among South American immigrants was more pronounced among those from certain countries. For example, the tilt toward women was more exaggerated for immigrants born in Paraguay (60 percent women) Colombia (58 percent), and Venezuela (56 percent), while only Ecuador (53 percent men) had a higher percentage of men.
The foreign born from South America were more likely than the native born, and nearly equally as likely as the foreign born overall, to be of working age.
Of the South American born residing in the United States in 2011, 84 percent were working age (16-64 years old), compared with 63 percent of the native born and 82 percent of all immigrants. Among South American immigrants, 11 percent were older than 64, compared to 13 percent of the native-born population and 13 percent of the overall foreign born.
The South American countries with the highest share of immigrants of working age were Brazil (90 percent), Venezuela (88 percent), and Ecuador (86 percent). South American countries with the highest shares of seniors were Argentina (18 percent), Chile (17 percent) and Paraguay (16 percent).
More than half of all South American immigrants have strong English-language skills.
In 2011, 16 percent of South American immigrants ages 5 and older reported speaking only English, and 38 percent reported speaking English "very well." In contrast, 6 percent of all South American immigrants reported not speaking English at all, 23 percent reported speaking English "well," and 17 percent reported speaking English, but "not well."
Compared to immigrants overall, South American immigrants were less likely to be Limited English Proficient (LEP), meaning that they reported speaking English less than "very well." Only 46 percent of those born in South America were LEP versus 51 percent of all immigrants.
Rates of English proficiency varied by South American country of origin.
Those from Ecuador were most likely to be LEP individuals (65 percent), followed by those from Uruguay (55 percent), Colombia (54 percent), Paraguay (52 percent), and Peru (52 percent). The highest rates of English proficiency (reporting to speak only English or English "very well") for South American immigrants occurred among those from Guyana, the only English-speaking country in South America, (96 percent), Argentina (65 percent), Venezuela (60 percent), Chile (60 percent), and Brazil (58 percent).
South American-born adults (ages 25 and older) were nearly equally as likely as U.S.-born adults to have a bachelor's degree or higher level of education.
In 2011, 29 percent of South American-born adults (ages 25 and older) had a bachelor's degree or higher, the same share as native-born adults and slightly above the 27 percent share of all foreign-born adults.
The South American born fell between these two other groups in terms of percentage who had not obtained at least a high school diploma or equivalent credential. In 2011, almost one-third (31 percent) of all immigrants had not obtained these credentials, compared to 17 percent of South American-born adults and 11 percent of native-born adults. The share of the South American born who reported their highest educational attainment as a high school diploma, some college, or an associate's degree (54 percent) was higher than that of the foreign born overall (41 percent), but lower than that of the native born (61 percent).
Levels of educational attainment, however, vary widely among South American origin countries. The top South American origin countries from which immigrant adults reported having a bachelor's degree or higher were Venezuela (49 percent), Argentina (39 percent), Brazil (38 percent), and Chile (38 percent). On the other hand, 16 percent of Ecuadoran immigrants reported having a bachelor's degrees or higher, and 32 percent lacked a high school diploma.
Two-thirds of South American-born immigrants arrived in the United States since 1990.
In 2011, approximately 40 percent of the 2.7 million South American immigrants in the United States had entered since 2000, while 26 percent arrived between 1990 and 1999, 18 percent entered between 1980 and 1989, and just 16 percent entered prior to 1980.
This arrival pattern generally mirrored that of immigrants in the United States overall: 36 percent had arrived since 2000; 27 percent arrived between 1990 and 1999; 18 percent entered between 1980 and 1989; and 19 percent entered prior to 1980.
Among the South American born, some origin groups were more established than others. For example, immigrants from Guyana (49 percent) and Chile (47 percent) were most likely to have arrived before 1990. Meanwhile, immigrants from Brazil (55 percent), Venezuela (52 percent), and Uruguay (49 percent) were the most likely to have to have arrived since 2000.
More than 23 percent of employed South American-born men worked in construction, extraction, and transportation, while 29 percent of South American women worked in service and personal care occupations.
The top three occupations that employed South American-born male workers ages 16 to 64 were construction, extraction, and transportation (23 percent of the total 850,000 South American male workers); service and personal care (20 percent); and management, business, and finance (13 percent).
Although these shares reflected those of male immigrants overall, South American men were slightly more likely to report working in management, business, and finance; sales; and administrative support (see Table 2).
Among the 730,000 employed South American–born women ages 16 to 64, 29 percent reported working in service and personal care occupations; 16 percent in administrative support; 11 percent in management, business, and finance; and 10 percent in sales.
These shares closely mirrored those of of female immigrants overall. However, they were somewhat more likely to report working in education, training, media and entertainment; service and personal care; and administrative support (see Table 2).
|
|
|||||||||||||||||||||||||||||||||||||||||||||||||||||||||||||||||||||||||||||||||||||||||||||||||
|
|||||||||||||||||||||||||||||||||||||||||||||||||||||||||||||||||||||||||||||||||||||||||||||||||
The South American born were less likely to live in poverty in 2011 than the foreign born overall.
In 2011, a smaller share of South American immigrants (14 percent) lived in households with an annual income below the official federal poverty line than immigrants overall (20 percent). (For comparison, 15 percent of the native born lived in poverty in 2011.)
There were moderate differences between origin countries. For example, immigrants from Argentina (11 percent), Chile (11 percent), and Uruguay (12 percent) were less likely than South American immigrants overall to live in poverty. In contrast, immigrants from three countries were slightly more likely than others to live below the poverty line: Ecuador (17 percent), Venezuela (16 percent), and Paraguay (16 percent).
About 1.1 million children under the age of 18 resided in a household with at least one immigrant parent born in South America.
The 1.1 million children with at least one South American-born parent represented 6 percent of the 17.1 million children under 18 with at least one immigrant parent. Similar to the overall population of children from immigrant households, the vast majority of children in South American immigrant families were U.S. born (about 87 percent for the overall population and 85 percent of those in South American immigrant families).
Note: Includes children who reside with at least one parent who was born in South America.
Sources
U.S. Census Bureau, 2011 American Community Survey (ACS), Table B05006, "Place of Birth for the Foreign-Born Population." Available online.
U.S. Department of Homeland Security, Office of Immigration Statistics. 2011 Yearbook of Immigration Statistics, various tables. Available online.
Authors' analysis of the U.S. Census Bureau's 2011 ACS. Accessed from Steven Ruggles, J. Trent Alexander, Katie Genadek, Ronald Goeken, Matthew B. Schroeder, and Matthew Sobek. Integrated Public Use Microdata Series: Version 5 [Machine-readable database]. Minneapolis, MN: Minnesota Population Center [producer and distributor], 2010. Available online.