

South American Immigrants in the United States

Brazilian drummers in Washington, D.C., one of the metro areas with the most South American immigrants in the United States. (Photo: Joe Flood)
Immigrants from South America remain a small share of the U.S. foreign-born population, but with a noticeable uptick in arrivals in recent years from deeply troubled Venezuela. The number of Venezuelan immigrants in the United States rose from 216,000 in 2014 to 351,000 in 2017, with a growth of 61,000 in one year alone, from 2016 to 2017.
Still, the United States is not the primary destination for Venezuelans leaving an increasingly failing state, with most of the members of Latin America’s largest exodus (at least 2 million people since 2015) fleeing to locations elsewhere in the region, in particular Colombia, Peru, Ecuador, Chile, and Argentina.
Overall, South American immigrants represented 7 percent (or 3.2 million) of the 44.5 million foreign born in the United States in 2017—up from 1 percent in 1960. While their numbers have increased, South Americans remain well behind the rest of Latin America, with significantly larger immigrant populations in the United States from Mexico and Central America.
Figure 1. South American Immigrant Population in the United States, 1980–2017
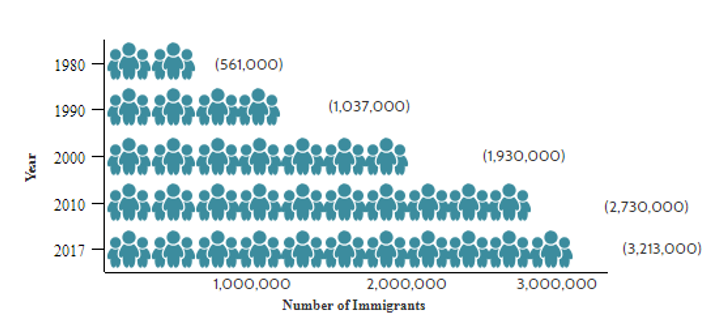
Sources: Data from U.S. Census Bureau 2010 and 2017 American Community Surveys (ACS); Campbell J. Gibson and Emily Lennon, "Historical Census Statistics on the Foreign-Born Population of the United States: 1850-2000" (Working Paper no. 81, U.S. Census Bureau, Washington, DC, February 2006), available online.
In 2017, the five largest countries of origin were Colombia (783,000, or 24 percent of all South American immigrants), Peru (459,000, 14 percent), Ecuador (454,000, 14 percent), Brazil (451,000, 14 percent), and Venezuela (351,000, 11 percent). Together, they accounted for 78 percent of the total South American immigrant population in the United States.
Table 1. South American Immigrants in the United States by Country of Origin, 2017
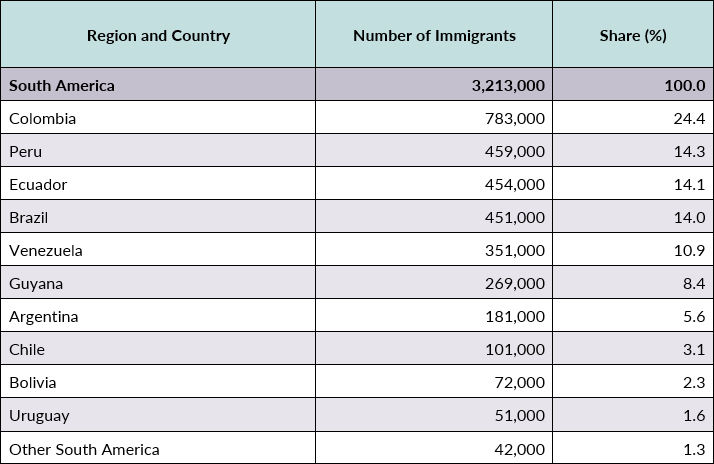
Source: Migration Policy Institute (MPI) tabulation of data from the U.S. Census Bureau, 2017 ACS.
Click here for an interactive chart showing changes in the number of immigrants from South America in the United States over time. Select individual countries from the dropdown menu.
Of the 12 million South Americans residing outside of their country of birth, about 4.2 million live elsewhere in South America. Outside of the region, the United States is by far the top destination for South American emigrants, followed by Spain (1.8 million), Italy (518,000), Canada (338,000), and Japan (265,000), according to mid-2017 estimates by the United Nations Population Division. Click here to view an interactive map showing where migrants from South America and other countries have settled worldwide.
On average, most South American immigrants obtain lawful permanent residence in the United States (also known as receiving a green card) through family ties. By and large, South American immigrants mirror the sociodemographic characteristics of the overall immigrant population with a few exceptions: They are slightly more educated, more likely to participate in the labor force, and have higher household incomes.
Using data from the U.S. Census Bureau (the most recent 2017 American Community Survey [ACS] as well as pooled 2012–16 ACS data) and the Department of Homeland Security’s Yearbook of Immigration Statistics, this Spotlight provides information on the South American population in the United States, focusing on its size, geographic distribution, and socioeconomic characteristics.
Click on the bullet points below for more information:
- Distribution by State and Key Cities
- English Proficiency
- Age, Education, and Employment
- Income and Poverty
- Immigration Pathways and Naturalization
- Health Coverage
- Diaspora
- Remittances
Distribution by State and Key Cities
In the 2012–16 period, most immigrants from South America lived in Florida (25 percent), New York (20 percent), or New Jersey (11 percent). The five counties with the most South Americans were Miami-Dade County in Florida, Queens County in New York, Broward County in Florida, Los Angeles County in California, and Kings County in New York. Together, these counties accounted for nearly 30 percent of the South American immigrant population in the United States.
Figure 2. Top States of Residence for South Americans in the United States, 2012–16
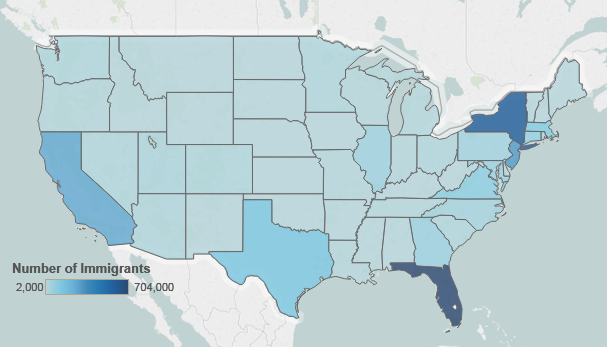
Note: Pooled 2012–16 ACS data were used to get statistically valid estimates at the state level for smaller-population geographies. Not shown are the populations in Alaska and Hawaii, which are small in size; for details, visit the MPI Data Hub to view an interactive map showing geographic distribution of immigrants by state and county, available online.
Source: MPI tabulation of data from U.S. Census Bureau pooled 2012–16 ACS.
As of 2012–16, the U.S. cities with the largest number of South Americans were the greater New York, Miami, and Washington, DC metropolitan areas. More than half (51 percent) of South American immigrants lived in these three metro areas.
Figure 3. Top Metropolitan Areas of Residence for South Americans in the United States, 2012–16
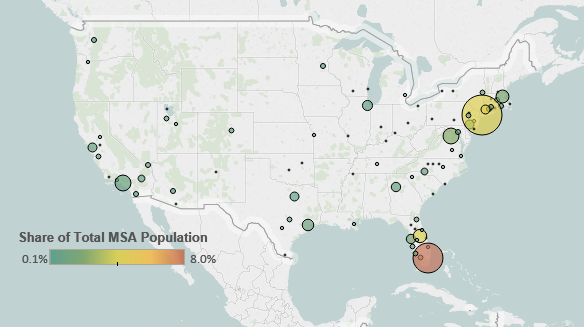
Note: Pooled 2012–16 ACS data were used to get statistically valid estimates at the metropolitan statistical-area level for smaller-population geographies. Not shown are the populations in Alaska and Hawaii, which are small in size.
Source: MPI tabulation of data from U.S. Census Bureau pooled 2012–16 ACS.
Table 2. Top Concentrations of South Americans by Metropolitan Area, 2012–16
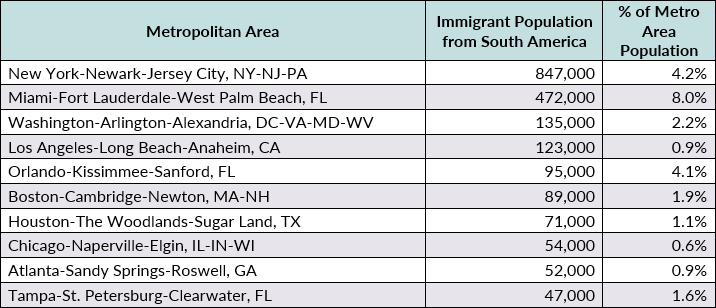
Source: MPI tabulation of data from the U.S. Census Bureau pooled 2012–16 ACS.
Click here for an interactive map that highlights the metropolitan areas with the highest concentrations of immigrants from South America and other countries.
South American immigrants are somewhat more likely to be proficient in English than the overall foreign-born population. In 2017, approximately 46 percent of South American immigrants (ages 5 and over) reported limited English proficiency, compared to 48 percent of all immigrants. Half or more of Venezuelans (50 percent), Peruvians (52 percent), Colombians (53 percent), and Ecuadorans (61 percent) reported limited English proficiency. Immigrants from Argentina (34 percent), Chile (38 percent), Brazil (42 percent), and Bolivia (43 percent) were less likely to be Limited English Proficient (LEP). Very few immigrants from English-speaking Guyana (3 percent) were LEP.
Note: Limited English proficiency refers to those who indicated on the ACS questionnaire that they spoke English less than “very well.”
Age, Education, and Employment
In 2017, South American immigrants had the same median age as the overall foreign-born population (45 years) but were much older than the U.S.-born population (36 years).
South American immigrants are as likely as the overall foreign-born population to be of working age (18 to 64; see Figure 4). Most immigrants from Brazil (87 percent), Ecuador (81 percent), and Venezuela and Peru (80 percent each) were of working age, while a sizable share of those from Chile and Argentina (22 percent) and Guyana (20 percent) were seniors (ages 65 and older).
Figure 4. Age Distribution of the U.S. Population by Origin, 2017
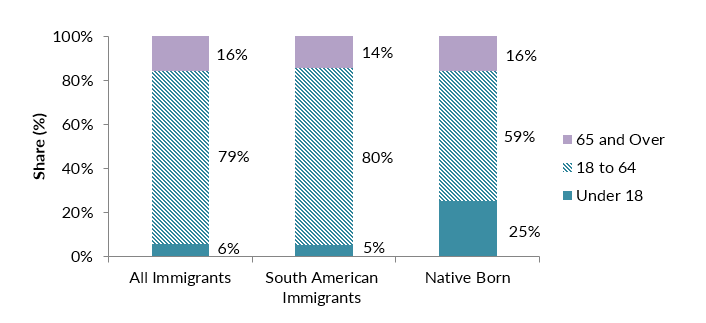
Note: Numbers may not add up to 100 as they are rounded to the nearest whole number.
Source: MPI tabulation of data from the U.S. Census Bureau 2017 ACS.
South American immigrant adults (ages 25 and older) are much more likely to have graduated from high school than U.S.-born adults and have a similar share of college graduates. In 2017, just 15 percent of South Americans had not finished high school, compared to 28 percent of all immigrants and 9 percent of U.S.-born adults. Approximately 32 percent of South American adults had a bachelor’s degree or higher, versus 31 percent of the total immigrant population and 32 percent of native-born adults.
More than half of immigrants from Venezuela (54 percent) and more than one-third of those from Chile (38 percent), Argentina (40 percent), and Brazil (42 percent) were college graduates, compared to 18 percent of immigrants from Ecuador and 23 percent of those from Guyana.
In school year (SY) 2016-17, 43,000 South American students were enrolled in U.S. higher educational institutions, representing 4 percent of the total 1.1 million international students. Brazil (13,000), Venezuela (9,000), and Colombia (8,000) were the top three origin countries from the region. Between SYs 2015-16 and 2016-17, the number of South American students in the United States decreased 12 percent (from 49,000 to 43,000), largely driven by the decline of students from Brazil (from 19,000 to 13,000).
South Americans participate in the labor force at a higher rate than both the native- and overall foreign-born populations. About 70 percent of South American immigrants ages 16 and over were in the civilian labor force in 2017, compared to 66 percent of all immigrants and 63 percent of the U.S. born. South Americans largely work in similar occupations as immigrant workers overall. Both groups are less likely to be in management, business, science, and arts occupations and more likely to be in service occupations than their U.S.-born counterparts (see Figure 5).
Owing to their higher levels of college education and better English skills, a significant share of immigrant workers from Argentina (46 percent), Venezuela (42 percent), Chile (38 percent), and Brazil (36 percent) were employed in management, business, science, and arts occupations.
Figure 5. Employed Workers in the Civilian Labor Force (ages 16 and older) by Occupation and Origin, 2017
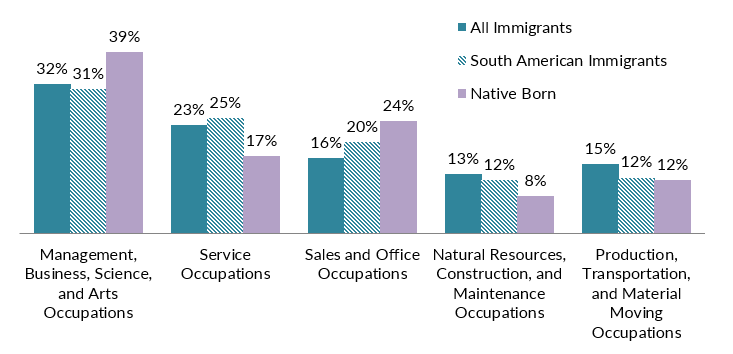
Source: MPI tabulation of data from the U.S. Census Bureau 2017 ACS.
On average, household incomes of South Americans fall between overall foreign- and native-born populations. In 2017, households headed by a South American immigrant had a median income of $58,600, compared to $56,700 for all immigrant and $60,800 for U.S.-born households.
Households headed by immigrants from Argentina ($66,800), Bolivia ($64,200), Guyana ($64,100), and Brazil ($61,700) had the highest median incomes, while Venezuelan ($51,900) households had the lowest median incomes.
In 2017, approximately 11 percent of South American immigrant families lived in poverty, a lower rate than for foreign-born families overall (14 percent), but slightly higher than for the native born (9 percent). Venezuelans were the most likely to be in poverty (18 percent), followed by immigrants from Chile (12 percent). In contrast, just 5 percent of immigrant families from Argentina were below poverty.
Immigration Pathways and Naturalization
South Americans are more likely to be naturalized U.S. citizens than immigrants overall. In 2017, about 53 percent of South American immigrants had taken U.S. citizenship, compared to 49 percent of the total foreign-born population. Immigrants from Guyana (78 percent), Bolivia (63 percent), and Colombia and Argentina (60 percent each) had the highest naturalization rates, while those from Brazil and Venezuela (35 percent each) were the least likely to be naturalized.
In terms of time of arrival, the largest share of South American immigrants (48 percent) arrived prior to 2000, followed by 28 percent between 2000 and 2009, and 24 percent in 2010 or later (see Figure 6). Close to two-thirds of immigrants from Chile (62 percent) and Guyana (64 percent) entered before 2000. Similarly, more than half of immigrants from Argentina and Bolivia (56 percent each), Colombia (53 percent), and Ecuador and Peru (52 percent) came prior to 2000. In contrast, 52 percent of immigrants from Venezuela arrived in 2010 or later.
Figure 6. South Americans and All Immigrants in the United States by Period of Arrival, 2017
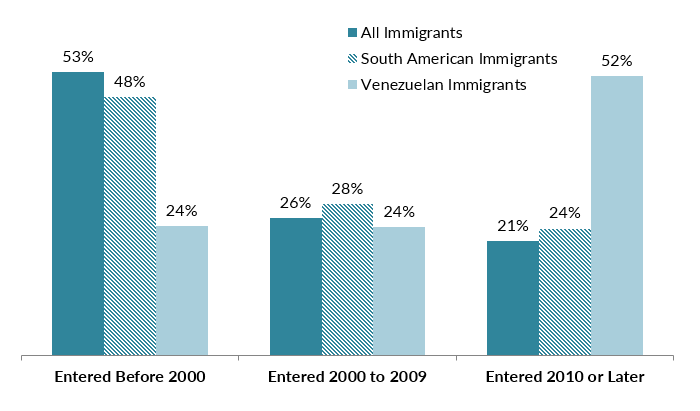
Note: Numbers may not add up to 100 as they are rounded to the nearest whole number.
Source: MPI tabulation of data from the U.S. Census Bureau 2017 ACS.
Most South Americans who obtain green cards do so through family reunification channels. In fiscal year (FY) 2017, 79 percent of the roughly 79,100 South Americans who became lawful permanent residents (LPRs) did so as either immediate relatives or other family members of U.S. citizens or LPRs, a much higher share than the 66 percent of new LPRs from all countries. South American immigrants were slightly more likely to gain green cards via employment pathways (14 percent) compared to the overall LPR population (12 percent; see Figure 7).
Like South Americans overall, Venezuelans were more likely to obtain a green card based on family ties (53 percent). However, they were roughly twice more likely to become permanent residents through employment sponsorship (27 percent) and five times more likely to be Diversity Lottery immigrants (11 percent) than LPRs from South America.
Figure 7. Immigration Pathways of South American Immigrants and All Immigrants in the United States, 2017
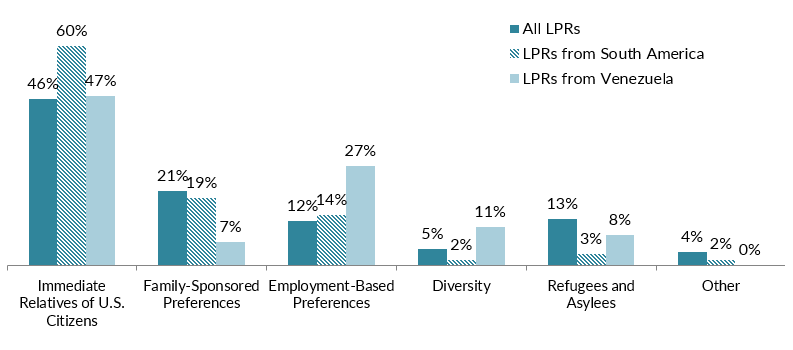
Notes: Family-sponsored preference: Includes adult children and siblings of U.S. citizens as well as spouses and children of green-card holders. Immediate relatives of U.S. citizens: Includes spouses, minor children, and parents of U.S. citizens. Diversity Visa lottery: The Immigration Act of 1990 established the Diversity Visa lottery program to allow entry to immigrants from countries with low rates of immigration to the United States. The law states that 55,000 diversity visas in total are to be made available each fiscal year. Individuals born in Brazil, Colombia, and Peru are not eligible for the DV 2020 lottery.
Source: MPI tabulation of data from Department of Homeland Security (DHS), 2017 Yearbook of Immigration Statistics (Washington, DC: DHS Office of Immigration Statistics, 2018), available online.
The number of new LPRs from Venezuela in FY 2017 stood at 11,809, the highest in the last decade. They represented 15 percent of all South Americans who received a green card in 2017, up from 11 percent in 2008 (or 10,514 out of 98,549).
The Migration Policy Institute (MPI) estimates that as of 2016, approximately 685,000 (6 percent) of the estimated 11.3 million unauthorized immigrants in the United States were from South America. Their top five countries of birth were Ecuador (144,000), Colombia (135,000), Peru (111,000), Brazil (96,000), and Guyana (51,000).
According to August 2018 data from U.S. Citizenship and Immigration Services (USCIS), 35,650 unauthorized immigrants from South America were active participants of the Deferred Action for Childhood Arrivals (DACA) program, which provides temporary deportation relief and work authorization. These individuals represented 5 percent of the 699,350 DACA participants. The top five South American countries by DACA participation were Peru (7,160 recipients), Brazil (5,750), Ecuador (5,340), Colombia (4,870), and Argentina (3,860).
South American immigrants were as likely to be uninsured as the overall foreign-born populations (20 percent) versus 7 percent of the native born (see Figure 8). South Americans were slightly more likely to have private health insurance coverage (59 percent) and less likely to have public coverage (27 percent) than the overall foreign-born population (see Figure 8).
About two-thirds of immigrants from Argentina (69 percent), Bolivia (65 percent), and Chile and Guyana (64 percent each) were covered by private insurance, while sizable shares of those from Guyana (36 percent) and Ecuador (34 percent) had public coverage. At the same time, 30 percent of Venezuelans had no health insurance.
Figure 8. Health Coverage for South Americans, All Immigrants, and the Native Born, 2017
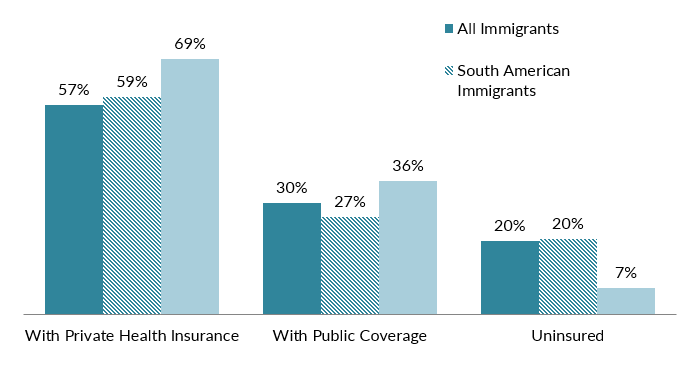
Note: The sum of shares by type of insurance is likely to be greater than 100 because people may have more than one type of insurance.
Source: MPI tabulation of data from the U.S. Census Bureau 2017 ACS.
The South American diaspora in the United States is comprised of approximately 4.9 million individuals who were either born in South America or reported ancestry of a given country in South America, according to tabulations from the 2016 ACS.
Remittances sent to South America have grown rapidly since late 1990s. In 2017, global remittances sent via formal channels to the region equaled US $17.8 billion, up 9 percent from $16.3 billion in 2016.
Three countries received two-thirds of all remittances sent to South America: Colombia ($5.6 billion or 32 percent), followed by Peru ($3 billion, or 17 percent), and Ecuador ($2.8 billion, or 16 percent). For most South American countries, remittances accounted for a tiny share of GDP. Remittance dependence was higher in Guyana (7 percent), Bolivia (4 percent), and Ecuador (3 percent). (Note: there are no data on Venezuela).
Figure 9. Annual Remittance Flows to South America, 1990–2017
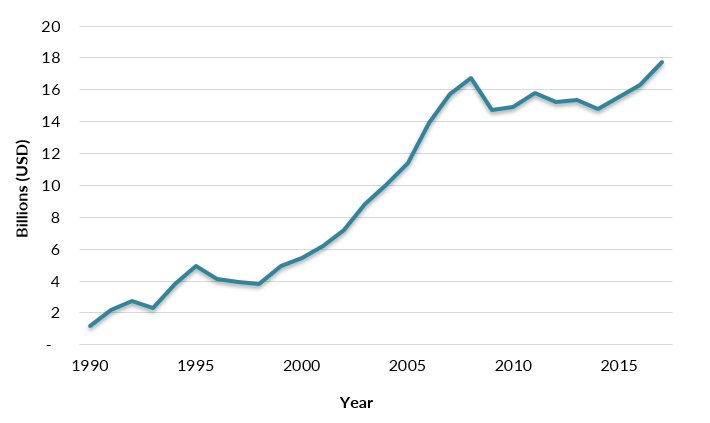
Note: The 2017 figure represents preliminary estimates by the World Bank.
Source: MPI tabulations of data from the World Bank Prospects Group, “Annual Remittances Data,” April 2018 update.
Sources
Gibson, Campbell J. and Emily Lennon. 2006. Historical Census Statistics on the Foreign-Born Population of the United States: 1850 to 1990. Working Paper No. 81, U.S. Census Bureau, Washington, DC, February 2006. Available online.
United Nations Population Division. N.d. International Migrant Stock by Destination and Origin. Accessed September 23, 2018. Available online.
U.S. Census Bureau. 2017. 2016 American Community Survey. Access from Steven Ruggles, Katie Genadek, Ronald Goeken, Josiah Grover, and Matthew Sobek. Integrated Public Use Microdata Series: Version 7.0 [dataset]. Minneapolis: University of Minnesota. Available online.
---. N.d. 2017 American Community Survey (ACS). American FactFinder. Accessed September 17, 2018. Available online.
U.S. Citizenship and Immigration Services (USCIS). 2018. DACA Population Data. Data table, May 31, 2018. Available online.
---. 2018. Approximate Active DACA Recipients as of May 31, 2018. Data table, May 31, 2018. Available online.
U.S. Department of Homeland Security (DHS), Office of Immigration Statistics. 2018. 2017 Yearbook of Immigration Statistics. Washington, DC: DHS Office of Immigration Statistics. Available online.
World Bank. 2018. Annual Remittances Data, April 2018 update. Available online.
---. N.d. Personal Remittances, Received (% of GDP). Accessed August 18, 2018. Available online.