

Spotlight on Temporary Admissions of Nonimmigrants to the United States
Source Spotlights are often updated as new data become available. Please click here to find the most recent version of this Spotlight.
This updated Spotlight takes a detailed look at the statistics on foreign nationals admitted to the United States on a temporary basis. The data are from the Annual Flow Report published by the Department of Homeland Security's (DHS) Office of Immigration Statistics (OIS), as well as from tables published on the OIS website.
Note: all yearly data is for the government's fiscal year (October 1 through September 30).
Click on the bullet points below for more information:
- Nonimmigrants are foreign nationals seeking to enter the United States temporarily for a specific purpose.
- Nonimmigrants may only engage in activities permitted under the visa issued to them.
- A nonimmigrant visa does not necessarily lead to lawful permanent residence.
- There is no limit on the total number of nonimmigrants admitted each year.
- Nonimmigrant admissions represent the number of arrivals, not the number of individuals, admitted to the United States.
- The number of nonimmigrant admissions does not equal the number of nonimmigrant visas issued by overseas consulates.
- Two important groups, exempt from completing arrival/departure forms, accounted for 143 million temporary admissions in 2005.
Special Note Temporary visa data gathered by the Department of Homeland Security (DHS) counts admissions, not individuals. In some cases, temporary visa holders may enter the country more than once in any given year. - The total number of nonimmigrants admitted to the United States more than tripled from 9.5 million in 1985 to 32.0 million in 2005.
- In 2005, almost nine out of 10 temporary admissions were temporary visitors (tourists and business travelers).
- Citizens of three countries — the UK, Mexico, and Japan — accounted for nearly half of all nonimmigrants admitted in 2005.
- Nationals of South Korea, Japan, India, Taiwan, China, and Canada accounted for half of all foreign student admissions in 2005.
- Nonimmigrants from India and the United Kingdom made up about one-third of all H-1B "specialty occupation" worker admissions in 2005.
- Nonimmigrants from Mexico and Jamaica accounted for 80 percent of all H-2B seasonal nonagricultural worker admissions in 2005.
- Four states — Florida, California, New York, and Texas — were the intended destination for half of all nonimmigrants admitted in 2005.
Nonimmigrants are foreign nationals seeking to enter the United States temporarily for a specific purpose.
According to U.S. immigration law, nonimmigrants are citizens of other countries who have received a particular type of visa and enter the United States temporarily for a specific purpose. Nonimmigrants are also referred to as temporary admissions. There are more than 70 classes of nonimmigrant admissions, including tourists, business visitors, students, H-1B workers, religious workers, intra-company transferees, diplomats, and representatives of international organizations.
Nonimmigrants may only engage in activities permitted under the visa issued to them.
Upon admission, nonimmigrants are restricted to the activity or reason for which their visa was issued. For example, a person admitted as a tourist (ie, a temporary visitor for pleasure) is not allowed to work or study unless he leaves the United States and enters on a work or student visa.
A nonimmigrant visa does not necessarily lead to lawful permanent residence.
By law, nonimmigrants are admitted temporarily for a specific purpose. However, if they meet certain eligibility requirements, they may apply to adjust their status to lawful permanent residence.
For example, a woman comes to the United States as a student. While on a student visa, she marries a U.S. citizen. Her spouse can petition DHS on her behalf to adjust her status from a student to that of a lawful permanent resident. Family reunification would be the basis for her adjustment (see Spotlight on Legal Immigration to the United States). If the couple meets all required criteria, she will receive a green card stating she is lawfully admitted for permanent residence.
(Note: this example is a very simplified case provided mainly to illustrate the point.)
There is no limit on the total number of nonimmigrants admitted each year.
Although there is no overall cap on how many nonimmigrants can be admitted to the United States per year, Congress sets a numerical limit for some categories of nonimmigrants. These categories currently include temporary skilled workers (65,000 H-1B "specialty occupation" visas for first-time applicants plus 20,000 visas for foreign graduates of U.S. advanced degree programs), seasonal nonagricultural workers (66,000 H-2B visas), treaty aliens in specialty occupations (10,500 E-3 visas), victims of trafficking (5,000 T-1 visas), and victims of criminal activity (10,000 U-1 visas).
Nonimmigrant admissions represent the number of arrivals, not the number of individuals, admitted to the United States.
Nonimmigrant admissions are recorded for each arrival. A nonimmigrant may travel on the same (or different) visa back and forth between the United States and another country within the same year. Every time this person enters the United States, the entry is recorded and added to the total number of admissions for that fiscal year. Therefore, the count of admissions exceeds the number of individuals arriving.
The number of nonimmigrant admissions does not equal the number of nonimmigrant visas issued by overseas consulates.
The number of nonimmigrants arriving in the United States does not match the number of nonimmigrant visas issued by overseas consulates in the same fiscal year.
There are a number of reasons for this difference. First, not all foreign nationals need a visa to enter the country. Nationals of 27 countries that are part of the Visa Waiver Program (eg, the UK, Ireland, France, Germany, Japan, etc.) can travel to the United States without a visa if they come for a period of less than 90 days as tourists or business travelers.
Second, most nonimmigrant visas are valid for several years. And third, some people may choose not to travel to the United States even if they obtain a visa, or they may choose to travel in the next (fiscal) year.
Two important groups, exempt from completing arrival/departure forms, accounted for 143 million temporary admissions in 2005.
In 2005, there were about 175.4 million nonimmigrants admitted to the United States, of which 143 million (82 percent) were exempt from completing the I-94 arrival/departure form at the port of entry. These nonimmigrants are from two groups: Canadians who travel to the United States for business or pleasure, and Mexicans who possess a nonresident alien Border Crossing Card (ie, laser visa). DHS only reports characteristics of I-94 nonimmigrants.
The total number of nonimmigrants admitted to the United States more than tripled from 9.5 million in 1985 to 32.0 million in 2005.
Temporary admissions of nonimmigrants to the United States increased 3.4 times from 9.5 million in 1985 to 32.0 million (not including certain Mexicans and Canadians) in 2005 (see Figure 1). The number of individuals who entered the United States just one time in 2005 totaled 23.5 million; 3.3 million individuals entered the country more than once.
|
|
||
|
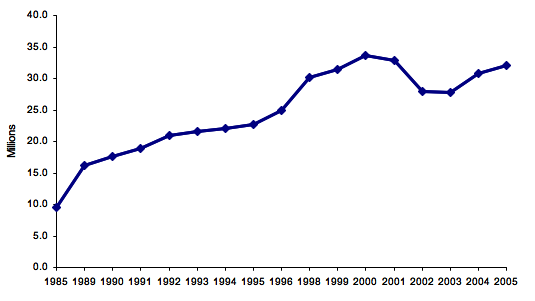
The 15.1 percent drop in the numbers of nonimmigrants arriving between 2001 (32.8 million) and 2003 (27.8 million) was caused by a number of factors, one of which was increased scrutiny of visa applicants following the September 11 terrorist attacks. However, the upward trend resumed after 2003.
In 2005, almost nine out of 10 temporary admissions were temporary visitors (tourists and business travelers).
Similar to the past, temporary visitors accounted for an overwhelming majority of all arrivals. In 2005, they represented 89 percent (28.5 million) of all admissions to the United States (see Figure 2). Of those, 23.8 million were tourists and 4.7 million were business travelers.
|
|
||
|
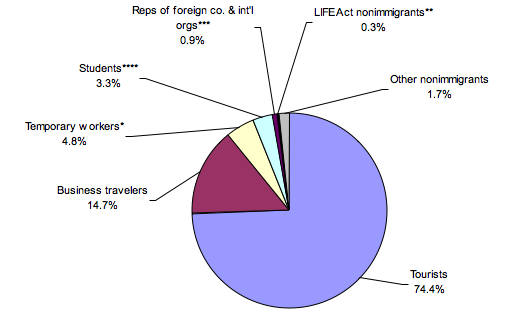
Temporary workers and trainees, including H-1B "specialty occupation" workers, registered nurses, temporary agricultural workers, North American Free Trade Agreement (NAFTA) professional workers, treaty traders, and intracompany transferees, among others, accounted for 1,531,899 arrivals (4.8 percent of total admissions); this figure include spouses and children of temporary workers. Students who came to the United States to study at an academic or vocational institute together with their family members made up 3.3 percent (1,046,421) of total arrivals.
Citizens of three countries — the UK, Mexico, and Japan — accounted for nearly half of all nonimmigrants admitted in 2005.
Citizens from the United Kingdom (5.1 million), Mexico (4.8 million), and Japan (4.4 million) accounted for 44.6 percent (14.3 million) of all temporary admissions in 2005. Citizens from Germany and France accounted for another 3 million or 9.4 percent. South Koreans made up 2.7 percent (876,554), and Italians represented 2.5 percent (810,137) of all nonimmigrants who arrived in 2005. The overwhelming majority of these nonimmigrants were tourists.
Nationals of South Korea, Japan, India, Taiwan, China, and Canada accounted for half of all foreign student admissions in 2005.
Citizens of South Korea (87,085), Japan (73,294), and India (53,054) made up 33.9 percent of all 629,595 students admitted in 2005 (family members are not included in these figures). Nationals of Taiwan (38,200), China (37,589), and Canada (25,493) accounted for another 16.1 percent.
Asian countries accounted for 58 percent of all foreign student admissions. The remaining students were from the Americas (19.8 percent), Europe (17.6 percent), Africa (3.1 percent), and Oceania (0.8 percent).
Nonimmigrants from India and the United Kingdom made up about one-third of all H-1B "specialty occupation" worker admissions in 2005.
Of all 407,917 temporary worker admissions under the H-1B "specialty occupation" visa, 25.1 percent (102,382) were from India and 7.5 percent (30,775) were from the United Kingdom (family members are not included in these figures). Together with Canada (5.9 percent or 24,086), Mexico (4.2 percent or 17,063), France (3.8 percent or 15,403), and Japan (3.6 percent or 14,858), these six countries accounted for 50.1 percent (204,547) of all H-1B admissions.
Altogether Asian countries made up 43.5 percent of all H-1B admissions, followed by Europe (26.8 percent), the Americas (25.2 percent), Oceania (2.2 percent), and Africa (1.9 percent).
Nonimmigrants from Mexico and Jamaica accounted for 80 percent of all H-2B seasonal nonagricultural worker admissions in 2005.
In 2005, Mexico (89,184) and Jamaica (9,123) accounted for 80.4 percent of 122,316 H-2B seasonal nonagricultural worker admissions. Guatemala (3,725), Canada (2,641), South Africa (1,714), the United Kingdom (1,517), Australia (1,196), and Brazil (1,075) accounted for another 9.7 percent.
Four states — Florida, California, New York, and Texas — were the intended destination for half of all nonimmigrants admitted in 2005.
In 2005, the most popular destination for nonimmigrants (mostly tourists and business visitors) were the states of Florida (15.8 percent), California (14.7 percent), New York (12.9 percent), and Texas (6.6 percent).
Of all 629,595 foreign students admitted in 2005, nearly half intended to study in five states: California (16.3 percent or 102,887), New York (12.8 percent or 80,306), Massachusetts (7.2 percent or 45,164), Florida (6.2 percent or 39,299), and Texas (6.1 percent or 38,574).
Of all 407,917 admitted H-1B temporary workers, 16.4 percent (66,884) intended to go to California, 16.3 percent (66,499) to New York, and 10.6 percent (43,392) to Florida.
Additional Resources
DHS's Office of Immigration Statistics: Data on nonimmigrant admissions
Department of State Visa Office
Definitions of terms can be found at the website of the Office of Immigration Statistics.
Information about types of temporary visitors in the United States can be found at the website of the U.S. Department of State.