

Syrian Refugees in the United States

A caseworker accompanies a family of Syrian refugees to their new home in Dallas. (Photo: Cathe Neukum/IRC)
In response to the civil war in Syria that began in 2011 and has resulted in the displacement of more than 11 million people within and beyond the country’s borders, the United States in 2015 began to accept for resettlement significantly more Syrian refugees than ever before. The Obama administration surpassed its goal of admitting 10,000 Syrians via the refugee resettlement program in fiscal year (FY) 2016, up from just 36 in FY 2013 (see Figure 1). In total, 18,007 Syrian refugees were resettled in the United States between October 1, 2011 and December 31, 2016.
Internationally, close to 4.9 million Syrians had been registered as refugees as of early January; the vast majority are in first-asylum countries such as Turkey, Lebanon, Jordan, and Iraq; only a fraction are likely to ever be permanently resettled. Facing dim resettlement prospects and eager to establish new lives, nearly 900,000 Syrians have headed to Europe and filed asylum claims there since the war began.
Beyond the United States, a small number of countries have accepted Syrian refugees through their resettlement programs, most notably Canada, which took in close to 40,000 Syrians between November 2015 and December 2016. Since 2013, Germany has admitted about 41,000 displaced Syrians who were living in Syria or a first-asylum country in the region via a humanitarian admissions program.
Figure 1. Syrian Refugees Resettled in the United States, FY 2012-17*
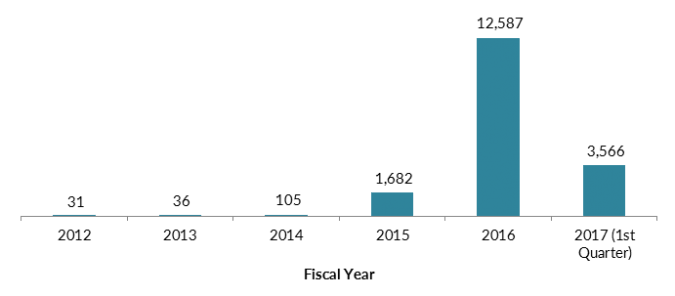
* 2017 data are for the first quarter of 2017.
Source: Migration Policy Institute (MPI) tabulation of data from the U.S. Department of State Refugee Processing Center, “Admissions & Arrivals” database, accessed January 4, 2017, available online.
The Obama administration, which raised the overall refugee ceiling in FY 2016 to 85,000 (up from 70,000 the year before), announced an increase to 110,000 in FY 2017 to respond to the unprecedented global humanitarian burden. While a formal target for Syrians was not set for FY 2017, it is anticipated they would receive more than 12,500 of the overall places. With the administration ending less than four months into the fiscal year and with President-elect Donald Trump having pledged to suspend Syrian refugee admissions, it remains unclear whether the FY 2017 resettlement pledges will be met.
It is worth noting that although Syrian refugees represent a new flow to the United States, the broader Syrian immigrant community, while quite small in size, has had a U.S. presence since the late 19th century. As of 2015, approximately 83,000 people born in Syria resided in the United States, accounting for less than 0.2 percent of the overall foreign-born population of 43.3 million. It is also well integrated, with Syrian immigrants having higher levels of education and English proficiency than the overall foreign-born population.
- Click here to read a profile of the overall Syrian immigrant population.
Using data primarily from the State Department’s Refugee Processing Center, this Spotlight provides information on the population of Syrian refugees resettled in the United States between FY 2012 and the first quarter of FY 2017 (all references to FY 2017 span only the three-month period that began in October 2016), focusing on its size, geographic distribution, and basic demographic characteristics upon arrival, including age, religion, and languages spoken.
Click on the bullet points below for more information:
Distribution by State and Key Cities
Upon entering the United States, refugees are resettled to states and localities based on a variety of factors, including their family ties in the United States, health, age, family composition, and language, as well as the cost of living and the availability of jobs, housing, education, and health services in potential placement sites.
Note: Geographic information presented in the article is based on initial resettlement and does not account for secondary migration.
Syrian refugees admitted between October 1, 2011 and December 31, 2016 were placed across the United States and their distribution was more spread out than the overall Syrian immigrant population (see Figure 2). California, Michigan, and Texas received the most Syrian refugees during this period, together accounting for 30 percent of the 18,007 total (California and Michigan with 11 percent each of all Syrian refugees, and Texas with 8 percent). In contrast, the broader Syrian immigrant population was more concentrated, with nearly 31 percent residing in California in 2015, followed by Michigan (9 percent) and Texas (7 percent).
After terrorist attacks in Paris in December 2015 and elsewhere in 2016, 31 U.S. governors issued statements opposing the resettlement of Syrian refugees in their states. Several states initiated legal challenges to the placement of Syrians; none have prevailed to date and voluntary organizations working with the U.S. government continue to resettle refugees across the United States.
The vast majority of the 31 states opposing Syrian refugee arrivals had received scant numbers more than one year into the process of increased Syrian resettlement. Three states—Alabama, Mississippi, and Wyoming—had received no Syrian refugees as of the end of 2016; ten states (Arkansas, Kansas, Louisiana, Maine, New Hampshire, New Mexico, North Dakota, Oklahoma, South Carolina, and South Dakota) had gotten fewer than 100; and nine states (Idaho, Indiana, Iowa, Massachusetts, Nebraska, Nevada, New Jersey, Tennessee, and Wisconsin) were the destination for between 100 and 500. Just four states had received more than 1,000 Syrian refugees, with Michigan the destination for 1,950 to date, followed by Texas (1,364), Arizona (1,149), and Illinois (1,059). Notably, Texas, Michigan, Arizona, and Illinois are traditionally major refugee resettlement states, receiving 24 percent of all 378,750 refugees admitted to the United States between October 1, 2011 and December 31, 2016, and have strong infrastructure to serve these refugees.
- Click here to read U.S. Meets 2016 Syrian Refugee Admission Goal; Opposition to New Resettlement Mounts
- Click here to read Ten Facts About U.S. Refugee Resettlement
Figure 2. Syrian Refugees Resettled in the United States by State, FY 2012-17*
* 2017 data are for the first quarter of 2017.
Source: Migration Policy Institute (MPI) tabulation of data from the U.S. Department of State Refugee Processing Center, “Admissions & Arrivals” database.
Between October 1, 2011 and December 31, 2016, San Diego, Chicago, and Troy, MI resettled the most Syrians of all major U.S. cities, with 6 percent, 4 percent, and 3 percent respectively (see Table 1). These three cities represented 13 percent of overall Syrian refugee resettlement.
Table 1. Top Metropolitan Areas Receiving Syrian Refugees, FY 2012-17*
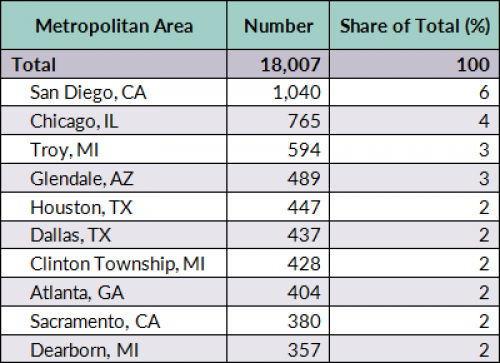
* 2017 data are for the first quarter of 2017.
Source: MPI tabulation of data from the U.S. Department of State’s Refugee Processing Center, “Admissions & Arrivals” database.
The U.S. refugee resettlement program prioritizes the most vulnerable populations for resettlement, as well as those with the best prospects for long-term integration. As a result, persons with critical medical conditions or disabilities and families with young children are more likely to be admitted than other groups. Of the Syrian refugees admitted to the United States since the beginning of the conflict, 72 percent (or 13,014) were women and children under age 14.
Not surprisingly, Syrian refugees are much more likely to be of school-age than the overall immigrant and native-born populations. Close to half (47 percent) of Syrian refugees resettled during the study period were under age 14 and another 12 percent were between the ages of 14 and 20 (see Table 2).
Table 2. Age Distribution of Syrian Refugees Resettled Since October 2011 and Comparison with Overall Immigrant and Native-Born Populations

Notes: The data for the overall immigrant and native-born populations are from 2015, while the refugee data span the period from October 1, 2011 through December 31, 2016.
Source: MPI tabulations of data from the U.S. Department of State Refugee Processing Center and the U.S. Census Bureau 2015 American Community Survey (ACS).
Ninety-eight percent of the Syrian refugees resettled in the United States were Muslim and about 1 percent Christian. The resettled population had a lower rate of Christians in comparison to the overall population in Syria, where approximately 10 percent of residents are Christian. There have been no systematic explanations for this difference yet, though officials in the field have suggested that Christian Syrians were more likely to stay in Syria because a greater share of them supported President Bashar al-Assad and felt protected there, while others sought refuge in Lebanon, which has a large Christian population of its own. Because most of the Syrian refugees resettled in the United States were processed in Jordan, not Lebanon, this also could help account for the variance.
The vast majority (96 percent) of Syrian refugees resettled in the United States reported speaking Arabic, followed by 3 percent who spoke Kurdish.
Sources
Chishti, Muzaffar and Sarah Pierce. 2016. U.S. Meets 2016 Syrian Refugee Admission Goal; Opposition to New Resettlement Mounts. Migration Information Source, September 28, 2016. Available online.
Edwards, Julia. 2015. U.S. to Open New Screening Centers for Syrian Refugees. Reuters, November 6, 2015. Available online.
Eurostat. 2016. Asylum and First Time Asylum Applicants by Citizenship, Age and Sex: Annual Aggregated Data (rounded) [migr_asyappctza]. Updated December 14, 2016. Available online.
Government of Canada. 2017. #WelcomeRefugees: Key Figures. Updated January 2, 2017. Available online.
Grote, Janne, Maria Bitterwolf, and Tatjana Baraulina. 2016. Resettlement and Humanitarian Admission Programmes in Germany. Working paper 68, Federal Office for Migration and Refugees, Nuremberg, Germany, July 2016. Available online.
Hattem, Julian. 2015. UN: Critics Wrong on Christian Syrian Refugees. The Hill, December 20, 2015. Available online.
Henshaw, Simon. 2016. Testimony of Principal Deputy Assistant Secretary, Bureau of Population, Refugees, and Migration, U.S. Department of State before the Senate Judiciary Committee, Subcommittee on Immigration, Citizenship, Refugees, Border Security, and International Law. Oversight of the Administration's FY 2017 Refugee Resettlement Program. 114th Cong., 2nd sess., September 28, 2016. Available online.
International Organization for Migration (IOM). 2016. U.S. Exceeds Resettlement Target of 10,000 Syrian Refugees. Press release, August 30, 2016. Available online.
Pew Research Center, Religion and Public Life. 2015. Religious Composition by Country, 2010-2050. April 2, 2015. Available online.
Richards, Anne C. 2015. Testimony of Assistant Secretary, Bureau of Population, Refugees, and Migration, U.S. Department of State, before the House Committee on Oversight and Government Reform. Terrorist Travel: Vetting for National Security Concerns. 114th Cong., 1st sess., December 17, 2015. Available online.
United Nations High Commissioner for Refugees (UNHCR). N.d. Syria Regional Refugee Response, Inter-agency Information Sharing Portal. Accessed January 9, 2017. Available online.
---. N.d. Syria Emergency. Accessed January 11, 2017. Available online.
U.S. Census Bureau. 2016. 2015 American Community Survey. Accessed from Steven Ruggles, Katie Genadek, Ronald Goeken, Josiah Grover, and Matthew Sobek. Integrated Public Use Microdata Series: Version 6.0 [Machine-readable database]. Minneapolis: University of Minnesota. Available online.
U.S. Central Intelligence Agency (CIA). 2016. The World Factbook: Syria. Updated December 19, 2016. Available online.
U.S. Department of Homeland Security (DHS), Office of Immigration Statistics. Various years. Yearbook of Immigration Statistics. Washington, DC: DHS Office of Immigration Statistics. Available online.
U.S. Department of State, Bureau of Population, Refugees, and Migration. N.d. Refugee Processing Center—Admissions & Arrivals database. Accessed January 4, 2017. Available online.
---. 2016. U.S. Refugee Admissions Programs FAQs. Fact sheet, U.S. Department of State, Bureau of Population, Refugees, and Migration, Washington, DC, November 18, 2016. Available online.