

Venezuelan Immigrants in the United States

Asylum seekers from Venezuela in Texas. (Photo: © UNHCR/Nicolo Filippo Rosso)
The number of Venezuelan immigrants in the United States has nearly tripled since 2010, coinciding with a period of severe economic and political crisis that has resulted in the largest prolonged displacement event in the Americas. The 545,000 Venezuelan immigrants in the United States as of 2021, the most recent year for which U.S. Census Bureau American Community Survey (ACS) data are available, account for just a small share of the more than 7 million who have fled Venezuela since 2015.
Arrivals of Venezuelans to the United States hastened in the past year, amid ongoing economic instability accentuated by the COVID-19 pandemic. Some had first settled elsewhere in South America; facing narrowing economic opportunities and growing discrimination, they decided to head north. Many Venezuelans have taken a difficult overland route to reach the U.S. southern border, transiting through the treacherous Darien Gap and Central America. In fiscal year (FY) 2022, U.S. border authorities encountered irregularly arriving Venezuelan migrants more than any other year on record—190,000 times—and the 65,000 encounters over the first four months of FY 2023 were more than in all of FY 2021.
In response to this increase, the Biden administration in October 2022 announced a new policy allowing some Venezuelans to apply for U.S. entry from abroad while expelling those intercepted arriving without authorization at the U.S.-Mexico border, including those intending to seek asylum. Because of frayed diplomatic relations with Caracas, U.S. authorities have been unable to return irregularly arriving Venezuelans to Venezuela; the new policy relies on Mexico’s willingness to accept expelled Venezuelans. The initiative, partly modeled after the Uniting for Ukraine program, offers two-year humanitarian parole including work authorization. Initially offered to 24,000 Venezuelans per month, the program cap was increased in January to 30,000 per month but also added Cubans, Haitians, and Nicaraguans to the total. These new arrivals must have a sponsor in the United States and meet other requirements. The number of encounters of Venezuelan migrants at the border immediately dropped following the rollout of the new policy.
Figure 1. Venezuelan Immigrant Population in the United States, 1980-2021

Sources: Data from U.S. Census Bureau 2010 and 2021 American Community Surveys (ACS), and Campbell J. Gibson and Kay Jung, "Historical Census Statistics on the Foreign-Born Population of the United States: 1850-2000" (Working Paper no. 81, U.S. Census Bureau, Washington, DC, February 2006), available online.
Globally, the top destinations for Venezuelans living abroad, as of the most recent, mid-2020 United Nations Population Division Estimates, were Colombia (1.8 million), Peru (942,000), and Chile (524,000), followed by the United States (506,000; UN estimates differ from ACS data because they cover a different year and use a different methodology).
Click here to view an interactive map showing where migrants from Venezuela and other countries have settled worldwide.
Compared to all U.S. immigrants, Venezuelans are far more likely to have a college degree and less likely to be naturalized citizens—the latter an unsurprising development given the recency of their arrival. They are also more likely to secure legal permanent residence (also known as getting a green card) after being granted humanitarian protection.
Using data from the U.S. Census Bureau (the 2021 ACS and pooled 2017-21 ACS data), the Department of Homeland Security’s Office of Immigration Statistics, the World Bank, and the Migration Policy Institute (MPI), this Spotlight provides information on the Venezuelan immigrant population in the United States, focusing on its size, geographic distribution, and socioeconomic characteristics.
Click on the bullet points below for more information:
- Distribution by State and Key Cities
- English Proficiency
- Age, Education, and Employment
- Income and Poverty
- Immigration Pathways and Naturalization
- Unauthorized Immigrant Population
- Health Coverage
- Diaspora
- Remittances
Distribution by State and Key Cities
Just over half (51 percent) of Venezuelan immigrants resided in Florida in the 2017-21 period. The next largest states were Texas (14 percent) and New York (4 percent). The top four counties by concentration were three counties in Florida—Miami-Dade, Broward, and Orange—and Harris County, Texas. Together, these four counties accounted for 42 percent of the Venezuelan-born population in the United States.
Figure 2. Top States of Residence for Venezuelan Immigrants in the United States, 2017-21
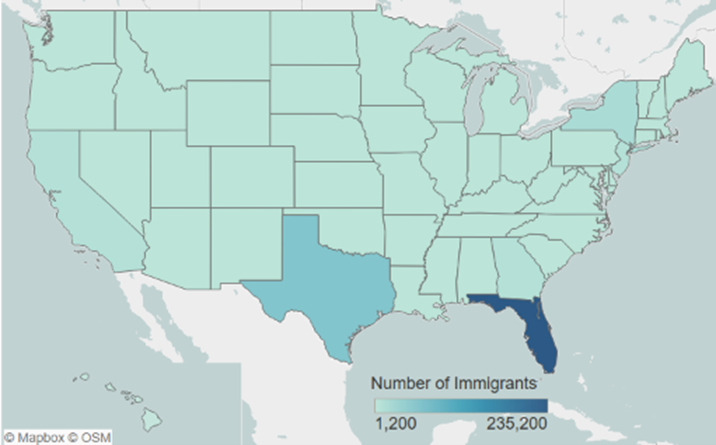
Note: Pooled 2017-21 ACS data were used to get statistically valid estimates at the state level for smaller-population geographies. Not shown is the Venezuelan population in Alaska, which is small in size; for details, visit the Migration Policy Institute (MPI) Data Hub for an interactive map showing geographic distribution of immigrants by state and county, available online.
Source: MPI tabulation of data from U.S. Census Bureau pooled 2017-21 ACS.
Click here for an interactive map that highlights the metropolitan areas with the highest concentrations of immigrants from Venezuela and other origin countries.
As of the 2017-21 period, the greater Miami, Orlando, and Houston metropolitan areas were home to 52 percent of Venezuelan immigrants.
Figure 3. Top Metropolitan Areas of Residence for Venezuelan Immigrants in the United States, 2017-21
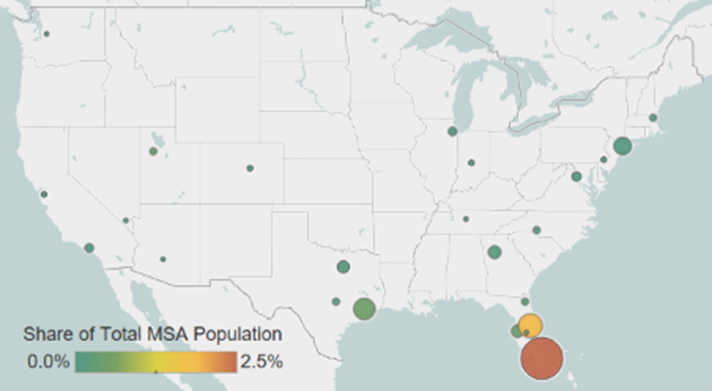
Note: Pooled 2017-21 ACS data were used to get statistically valid estimates at the metropolitan statistical-area level for smaller-population geographies.
Source: MPI tabulation of data from U.S. Census Bureau pooled 2017-21 ACS.
Click here for an interactive map that highlights the metropolitan areas with the highest concentrations of immigrants from Venezuela and elsewhere.
Table 1. Top Concentrations of Venezuelan Immigrants by U.S. Metropolitan Area, 2017-21
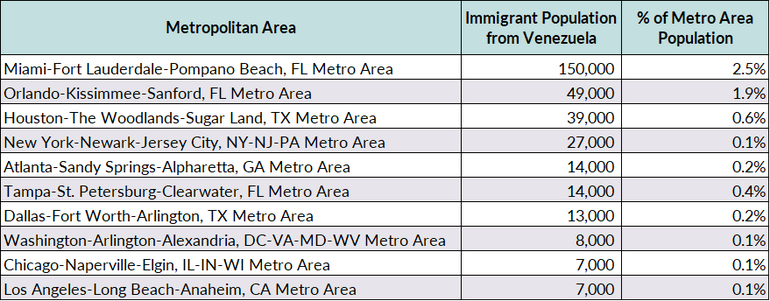
Source: MPI tabulation of data from the U.S. Census Bureau pooled 2017-21 ACS.
Venezuelan immigrants are less likely to be proficient in English than the overall foreign-born population. About 52 percent of Venezuelans ages 5 and over reported limited English proficiency in 2021, compared to about 46 percent of all immigrants. Approximately 6 percent of Venezuelan immigrants spoke only English at home, versus 17 percent of all immigrants.
Note: Limited English Proficient (LEP) status refers to those who indicated on the ACS questionnaire that they spoke English less than “very well.”
Age, Education, and Employment
Venezuelan immigrants tend to be younger than the overall foreign-born population but older than the U.S. born. Their median age in 2021 was about 41 years old, compared to 47 for all immigrants and 37 for the native born. Venezuelan immigrants were more likely than the native- and overall foreign-born populations to be of working age (18 to 64 years old; see Figure 4).
Figure 4. Age Distribution of the U.S. Population by Origin, 2021
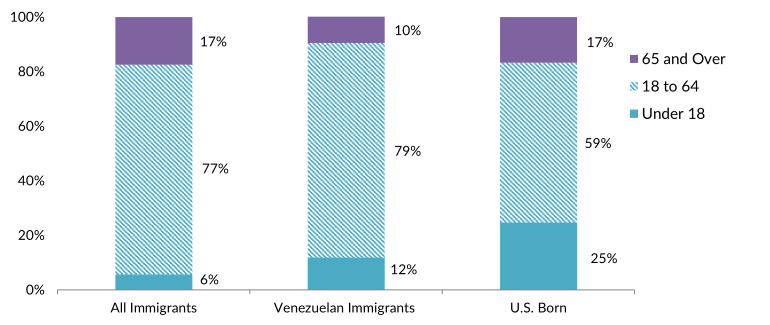
Note: Percentages may not add up to 100 as they are rounded to the nearest whole number.
Source: MPI tabulation of data from the U.S. Census Bureau 2021 ACS.
Venezuelan adults have higher rates of educational attainment than both the native- and overall foreign-born populations. In 2021, approximately 57 percent of Venezuelan immigrants ages 25 and older reported having a bachelor’s degree or higher, compared to 35 percent of U.S.-born and 34 percent of immigrant adults. The share of Venezuelan immigrants with a college degree is even higher among those who arrived between 2017 and 2021: 62 percent.
Click here for data on immigrants’ educational attainment by country of origin and overall.
According to the Institute of International Education, about 5,300 international students from Venezuela were enrolled in U.S. higher education institutions in the 2021-22 school year, comprising a relatively small share of the total 949,000 international students in the United States. Following Brazil, Mexico and Colombia, Venezuela was the fourth largest country of origin from Latin America and the Caribbean, representing approximately 7 percent of the 78,000 students from the region in the United States.
Venezuelans participate in the labor force at much higher rates than the native born and overall foreign-born population. About 74 percent of Venezuelan immigrants ages 16 and older were in the civilian labor force in 2021, compared to 66 percent and 62 percent for the foreign- and U.S.-born populations, respectively. Venezuelans were more likely to be employed in sales and office occupations than other workers (see Figure 5).
Figure 5. Employed Workers in the U.S. Civilian Labor Force (ages 16 and older) by Occupation and Origin, 2021
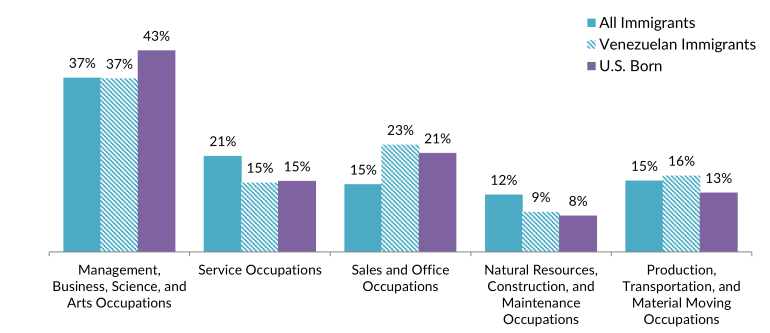
Note: Percentages may not add up to 100 as they are rounded to the nearest whole number.
Source: MPI tabulation of data from the U.S. Census Bureau 2021 ACS.
On average, Venezuelans have lower incomes than the overall foreign- and native-born populations. Households headed by a Venezuelan immigrant had a median annual income of $64,000 in 2021, compared to $70,000 for all immigrant- and native-led households.
In 2021, Venezuelan immigrants were as likely to be in poverty as immigrants overall (14 percent) and slightly more likely than the U.S. born (13 percent).
Immigration Pathways and Naturalization
Venezuelans are less likely to be naturalized U.S. citizens than immigrants overall. In 2021, 37 percent of Venezuelan immigrants were U.S. citizens, compared to 53 percent of the total foreign-born population.
Compared to all immigrants, Venezuelans are more likely to have arrived in the United States in the last decade: 62 percent arrived since 2010, compared to 28 percent for the overall immigrant population. Just 20 percent of Venezuelans arrived before 2000 (see Figure 6).
Figure 6. Immigrants from Venezuela and All Immigrants in the United States by Period of Arrival, 2021

Note: Percentages may not add up to 100 as they are rounded to the nearest whole number.
Source: MPI tabulation of data from the U.S. Census Bureau 2021 ACS.
Among the top countries for new green-card holders, Venezuela ranked 11th in FY 2021. Approximately 14,400, or 2 percent of the 740,000 people receiving a green card that year, were from Venezuela. Of those Venezuelans receiving a green card in FY 2021, 17 percent did so after being resettled as a refugee or having received asylum, a higher share than the 8 percent of all new lawful permanent residents (LPRs; see Figure 7).
Figure 7. Immigration Pathways of Venezuelan and All New Lawful Permanent Residents in the United States, FY 2021

Notes: Immediate Relatives of U.S. Citizens: Includes spouses, minor children, and parents of U.S. citizens. Family-Sponsored Preferences: Includes adult children and siblings of U.S. citizens as well as spouses and children of green-card holders. The Diversity Visa lottery was established by the Immigration Act of 1990 to allow entry to immigrants from countries with low rates of immigration to the United States. The law states that 55,000 diversity visas in total are made available each fiscal year. Individuals born in Venezuela are not eligible for the 2024 lottery. Percentages may not add up to 100 as they are rounded to the nearest whole number.
Source: MPI tabulation of data from Department of Homeland Security (DHS), “Table 10D: Persons Obtaining Lawful Permanent Resident Status by Broad Class Of Admission and Region and Country of Birth: Fiscal Year 2021,” updated September 26, 2022, available online.
Unauthorized Immigrant Population
MPI estimates that as of 2019, approximately 189,000 (2 percent) of the estimated 11 million unauthorized immigrants in the United States were from Venezuela.
An estimated 323,000 Venezuelans living in the United States as of March 2021 were eligible for Temporary Protected Status (TPS), which grants work authorization and protection from deportation.
Click here to view an interactive map showing MPI’s estimates of the number and geographic distribution (by state and county) of unauthorized immigrants from Venezuela and other top origin countries. Click here to view MPI demographic profiles for unauthorized immigrants nationwide, in most states, and in top counties.
As of September 2022, just 1,830 Venezuelans were active participants in the Deferred Action for Childhood Arrivals (DACA) program, out of a total 589,660 DACA recipients, according to U.S. Citizenship and Immigration Services (USCIS). DACA provides temporary deportation relief and work authorization to unauthorized migrants who arrived as children and meet the program’s education and other eligibility criteria.
Click here to view the top origin countries of DACA recipients and their U.S. states of residence.
Venezuelans are more likely to be covered by private health insurance and less likely to be covered by public insurance than all immigrants and the U.S. born. The share who were uninsured (17 percent) is slightly lower than that of all immigrants (see Figure 8).
Figure 8. Health Coverage for Venezuelan Immigrants, All Immigrants, and the U.S. Born, 2021

Note: The sum of shares by type of insurance is likely to be greater than 100 because people may have more than one type of insurance.
Source: MPI tabulation of data from the U.S. Census Bureau 2021 ACS.
The Venezuelan diaspora in the United States is comprised of approximately 750,000 individuals who were either born in Venezuela or reported Venezuelan ancestry or origin, according to an MPI tabulation of data from the U.S. Census Bureau’s 2021 ACS.
Approximately $279 million in remittances was sent to Venezuela via formal channels in 2016, the most recent year for which the World Bank has updated estimates.
Figure 9. Annual Remittance Flows to Venezuela, 1990-2016

Note: Updated World Bank estimates since 2016 are not available.
Source: MPI tabulations of data from the World Bank Global Knowledge Partnership on Migration and Development (KNOMAD), “Remittance Inflows,” May 2022 update, available online.
Click here to view an interactive chart showing annual remittances received and sent by Venezuela and other countries.
Sources
Chishti, Muzaffar and Kathleen Bush-Joseph. 2022. Amid Record Venezuelan Arrivals, Biden Administration Embraces Border Expulsion Policy. Migration Information Source, October 27, 2022. Available online.
Gibson, Campbell J. and Kay Jung. 2006. Historical Census Statistics on the Foreign-Born Population of the United States: 1850-2000. Working Paper no. 81, U.S. Census Bureau, Washington, DC, February 2006. Available online.
Institute of International Education (IIE). N.d. International Students: All Places of Origin. Accessed November 29, 2022. Available online.
Kinosian, Sarah and Vivian Sequera. 2022. Explainer: Why Venezuela’s Refugee Exodus to the U.S. Has Been Accelerating. Reuters, October 19, 2022. Available online.
Knowledge Partnership on Migration and Development (KNOMAD)/World Bank Group. 2022. Remittance Inflows. Updated May 2022. Available online.
Miroff, Nick. 2021. Venezuelan Migrants Are New Border Challenge for Biden Administration. The Washington Post, November 23, 2021. Available online.
Montoya-Galvez, Camilo. 2022. 6,800 Venezuelans Have Been Approved to Come to the U.S. Legally under Sponsorship Policy. CBS News, November 3, 2022. Available online.
Ruiz Soto, Ariel G. 2022. Record-Breaking Migrant Encounters at the U.S.-Mexico Border Overlook the Bigger Story. Migration Policy Institute (MPI) commentary, October 2022. Available online.
UN Population Division. N.d. International Migrant Stock by Destination and Origin. Accessed November 29, 2022. Available online.
U.S. Census Bureau. 2022. 2021 American Community Survey. Accessed from Steven Ruggles, Katie Genadek, Ronald Goeken, Josiah Grover, and Matthew Sobek. Integrated Public Use Microdata Series: Version 7.0 [dataset]. Minneapolis: University of Minnesota. Available online.
---. N.d. 2021 American Community Survey—Advanced Search. Accessed September 28, 2022. Available online.
U.S. Citizenship and Immigration Services (USCIS). 2022. Count of Active DACA Recipients by Country of Birth as of September 30, 2022. Washington, DC: USCIS. Available online.
U.S. Customs and Border Protection (CBP). 2023. Nationwide Encounters. Updated February 6, 2023. Available online.
U.S. Department of Homeland Security (DHS) Office of Immigration Statistics. 2022. Immigration Data and Statistics. Updated September 30, 2022. Available online.
---. N.d. 2021 Yearbook of Immigration Statistics. Accessed January 31, 2023. Available online.