Age Distribution of Immigrants to U.S., 1870-Present
Age Distribution of Immigrants to U.S., 1870-Present
This bar chart represents the age distribution and median age of the immigrant population in the United States by decade and for 2013, the most recent year for which data are available.
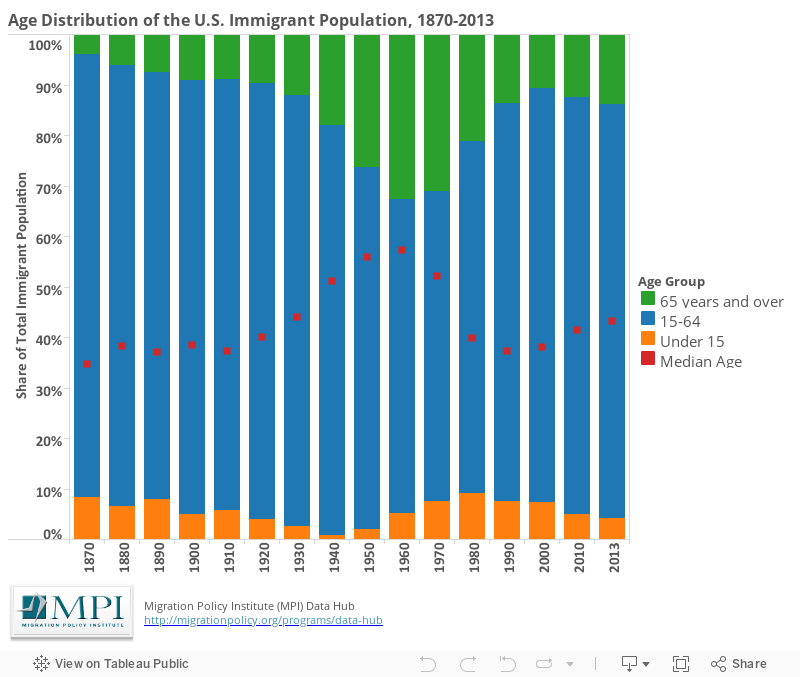
In 2013, the size of the native-born population was 274.8 million and its age distribution was as follows: 21.6 percent were under 15, 64.2 percent were between 15 and 64, and 14.2 percent were 65 or older, with the median age of 35.9.
Migration Policy Institute tabulation of data from the U.S. Census Bureau's 2013 American Community Survey and 1970, 1990, and 2000 Census decennial data accessed from Steven Ruggles, J. Trent Alexander, Katie Genadek, Ronald Goeken, Matthew B. Schroeder, and Matthew Sobek, Integrated Public Use Microdata Series: Version 5.0 [Machine-readable database] (Minneapolis: University of Minnesota, 2010). All other data are from Campbell J. Gibson and Emily Lennon, "Historical Census Statistics on the Foreign-Born Population of the United States: 1850 to 1990" (Working Paper No. 29, U.S. Census Bureau, Washington, DC, 1999).