Age-Sex Pyramids of Top Immigrant Origin Groups in U.S., 2016
Age-Sex Pyramids of Top Immigrant Origin Groups in U.S., 2016
Here are age-sex pyramids for the total U.S. immigrant population and of the nine largest immigrant-origin groups (with at least 1 million immigrants) for 2016. To view an age-sex pyramid for immigrants from Mexico, India, China/Hong Kong, the Philippines, El Salvador, Vietnam, Cuba, South Korea, and the Dominican Republic, select the country of interest from the dropdown menu.
Notes:
| All immigrants: Approximately 43.7 million immigrants resided in the United States in 2016. Several factors affected the shape of the age-sex pyramid of the immigrant population. First, many migrants leave their home countries to find work abroad, so a high number of immigrants in the economically active ages of 20 to 54 is not uncommon. As can be seen in this age-sex pyramid, the majority of immigrants in 2016 were adults between the ages of 20 and 54. Second, in general, children rarely migrate by themselves and adult immigrants tend to migrate with few or no children. This helps explain the relatively small amount of people ages 20 and younger. There is another reason, however: the children born in the United States to adult immigrants are considered native born and are not included in this age-sex pyramid. Third, people are less likely to migrate at older ages. In the foreign-born age-sex pyramid, there are clearly fewer people in the retirement-age groups (ages 55 and over). This low number of older immigrants also has to do with many immigrants returning home for retirement and the death of older settled immigrants. All of these factors give the foreign-born age-sex pyramid its diamond shape. |
| Immigrants from: |
| China/Hong Kong: Approximately 2.4 million immigrants from China and Hong Kong (excluding Taiwan) resided in the United States in 2016. The age-sex pyramid of the foreign-born population from China has many of the same characteristics as the diamond-shape population pyramid of the total immigrant population. This includes the largest number of immigrants in the economically active ages of 20 to 54 and relatively smaller numbers under age 20 and over age 54. Similar to the Filipino immigrant population but unlike the Mexican and Indian immigrant populations, the foreign-born population from China has fewer males than females. |
| Cuba: Approximately 1.3 million immigrants from Cuba resided in the United States in 2016. The age-sex pyramid of the foreign-born population from Cuba has many of the same characteristics as the diamond-shape population pyramid of the total immigrant population. This includes the largest number of immigrants in the economically active ages of 20 to 54 and relatively smaller numbers under age 20. What is different is the sizable number of people over age 60. These older Cubans for the most part are immigrants who came to the United States after the Cuban revolution. |
| Dominican Republic: Approximately 1.1 million immigrants from the Dominican Republic resided in the United States in 2016. The age-sex pyramid of the foreign-born population from the Dominican Republic shares some features of the diamond-shape population pyramid of the total immigrant population. This includes the largest number of immigrants in the economically active ages of 20 to 54 and relatively smaller numbers under age 20 and over age 54. Similar to the Filipino immigrant population, the foreign-born population from the Dominican Republic has more women than men in most age groups. |
| El Salvador: Approximately 1.4 million immigrants from El Salvador resided in the United States in 2016. The age-sex pyramid of the foreign-born population from El Salvador shares some features of the diamond-shape population pyramid of the total immigrant population. This includes the largest number of immigrants in the economically active ages of 20 to 54 and relatively smaller numbers under age 20 and over age 54. Unlike the population pyramid of the total immigrant population, the middle part—representing the economically active population—is stretched out, while the top and the bottom—representing the children and elderly population—are small. Similar to the Mexican but unlike the Filipino immigrant populations, the foreign-born population from El Salvador overall has more men than women. However, this is not the case among Salvadoran immigrants who are older than 50. There are more women than men in each of the age groups in the older adult population. |
| India: Approximately 2.4 million immigrants from India resided in the United States in 2016. The age-sex pyramid of the foreign-born population from India has many of the same characteristics as the diamond-shape population pyramid of the immigrant population. This includes the largest number of immigrants in the economically active ages of 20 to 54 and relatively smaller numbers under age 20 and over age 54. Similar to Mexican immigrant population but unlike the Filipino immigrant population, the foreign-born population from India has more men than women. Unlike the Mexican immigrant population, however, the preponderance of males over females is not limited to the economically active ages of 15 to 44 but occurs in most age groups. |
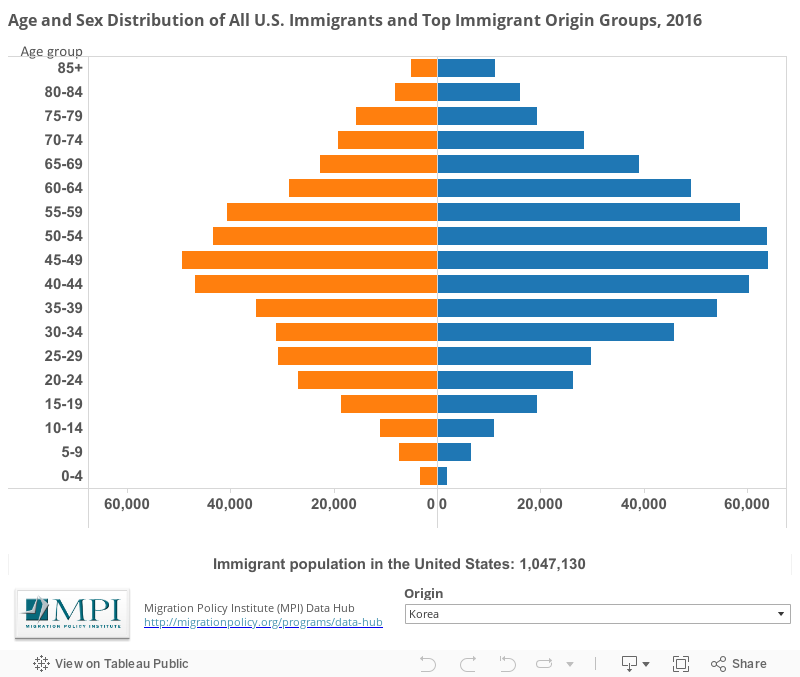
| South Korea: Approximately 1 million immigrants from South Korea (estimate includes a small number of those from North Korea) resided in the United States in 2016. The age-sex pyramid of the foreign-born population from Korea has many of the same characteristics as the diamond-shape population pyramid of the total immigrant population. This includes the largest number of immigrants in the economically active ages of 20 to 60 and relatively smaller numbers under age 20 and over age 60. What is unusual about the Korean immigrant population pyramid is the preponderance of female migrants in nearly all age groups (compare to the pyramid of Indian or Mexican immigrants, e.g.). |
| Mexico: Approximately 11.6 million immigrants from Mexico resided in the United States in 2016. The age-sex pyramid of the foreign-born population from Mexico has many of the same characteristics as the diamond-shape population pyramid of the total immigrant population. This includes the largest number of immigrants in the economically active ages of 20 to 54 and relatively smaller numbers under age 20 and over age 54. What is unusual about the Mexican immigrant population pyramid is the preponderance of male migrants between the ages of 15 and 44 (compare to the pyramid of Filipino immigrants, e.g.). |
| The Philippines: Approximately 1.9 million immigrants from the Philippines resided in the United States in 2016. The age-sex pyramid of the foreign-born population from the Philippines has many of the same characteristics as the diamond-shape population pyramid of the total immigrant population. This includes the largest number of immigrants in the economically active ages of 20 to 54 and relatively smaller numbers under age 20 and over age 54. What is unusual about the Filipino immigrant population pyramid is the preponderance of female migrants ages 25 to 54 (compared to the pyramid of Mexican immigrants, e.g.). |
| Vietnam: Approximately 1.4 million immigrants from Vietnam resided in the United States in 2016. The age-sex pyramid of the foreign-born population from Vietnam has many of the same characteristics as the diamond-shape population pyramid of the total immigrant population. This includes the largest number of immigrants in the economically active ages of 20 to 54 and relatively smaller numbers under age 20 and over age 54. Unlike the higher shares of men among the Mexican and Indian populations and the higher shares of women among the Filipino and Chinese populations, the Vietnamese population is more gender balanced. |
Source:
Migration Policy Institute (MPI) tabulation of data from the U.S. Census Bureau's 2016 American Community Survey. Data were accessed from Steven Ruggles, Katie Genadek, Ronald Goeken, Josiah Grover, and Matthew Sobek. Integrated Public Use Microdata Series: Version 6.0 [Machine-readable database]. Minneapolis: University of Minnesota, 2017.