U.S. Immigrant Population Change by Decade, 1850-2022
U.S. Immigrant Population Change by Decade, 1850-2022
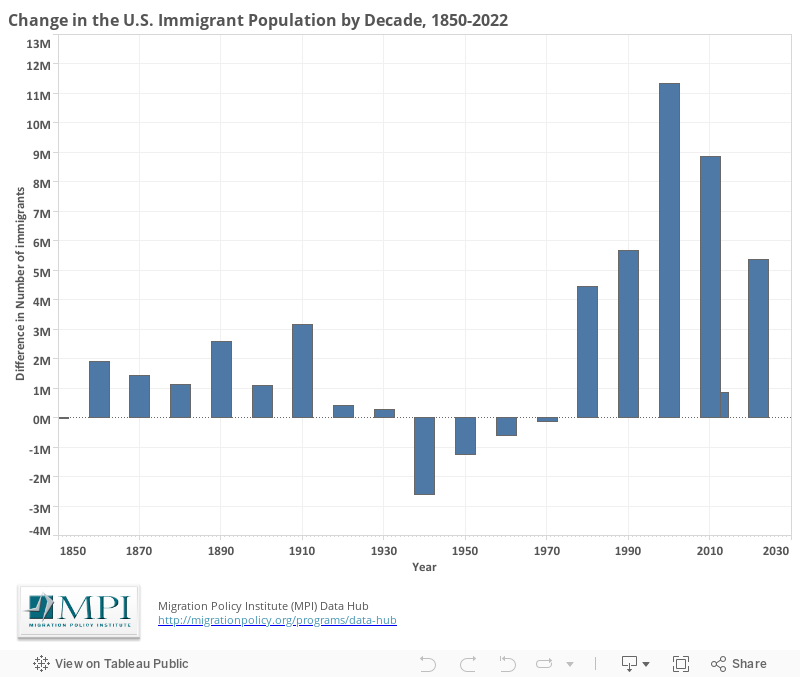
This chart displays changes in the immigrant population of the United States each decade, beginning in 1850. The net change is determined by increases resulting from new immigration and decreases resulting from immigrant mortality (e.g. old age) or emigration. The chart also displays changes for the 2012-2022 decade.
Notes:
- The term "immigrants" (also known as the foreign born) refers to people residing in the United States who were not U.S. citizens at birth. This population includes naturalized citizens, lawful permanent residents (LPRs), certain legal nonimmigrants (e.g., persons on student or work visas), those admitted under refugee or asylee status, and persons illegally residing in the United States.
- The U.S. Census Bureau experienced significant challenges collecting data in 2020 due to the COVID-19 pandemic and released only a small number of data points from its 2020 American Community Survey (ACS), which it called “experimental.” This data tool does not include estimates from the 2020 ACS.
Source:
Migration Policy Institute tabulation of data from the U.S. Census Bureau, 2010, 2012, and 2022 American Community Surveys and 1970, 1990, and 2000 Census Decennial Census. All other data are from Campbell J. Gibson and Emily Lennon, U.S. Census Bureau, Working Paper No. 29, Historical Census Statistics on the Foreign-Born Population of the United States: 1850 to 1990, U.S. Government Printing Office, Washington, DC, 1999.