

Afghan Immigrants in the United States

An Afghan refugee in the United States. (Photo: © UNHCR/Ashley Le)
The dramatic aftermath of the U.S. military departure from Afghanistan after 20 years of war and rapid rise of the Taliban prompted a chaotic evacuation of Afghan allies and others to the United States and other countries. The U.S. government has said it expects that at least 50,000 Afghans will eventually be brought to the United States, as part of one of the largest airlifts of its kind in U.S. history. As of September 3, nearly 34,000 U.S.-bound Afghans were being housed at U.S. and NATO bases in the Middle East and Europe; another nearly 26,000 evacuees were at eight military facilities in the United States.
These new arrivals will join a population of Afghan immigrants already in the United States that is relatively small—approximately 132,000 as of 2019—and which is relatively new, with 60 percent having arrived in 2010 or later. But despite its small size, this group has been growing much faster than many other immigrant populations over the past decade.
Significant numbers of Afghan migrants began coming to the United States in the early 1980s following years of political instability and the 1979 invasion by the Soviet Union. Subsequent civil wars and military interventions led to several waves of refugees, a relatively small number of whom reached the United States. Pakistan and Iran were and remain much more common destinations for displaced Afghans. Between 1980 and 2000, the number of Afghans who resided in the United States grew 11-fold, from approximately 4,000 to 45,000 (see Figure 1). The U.S.-led military invasion in response to the terrorist attacks of September 11, 2001, further contributed to the rising numbers of both internally and internationally displaced Afghans. But it did not immediately lead to a dramatic increase in the Afghan-born population in the United States.
As the U.S. presence in Afghanistan deepened, however, more and more Afghans worked as interpreters, translators, and other professionals with or on behalf of the U.S. government or military. These individuals and their families became exposed to significant danger because of their association with the United States. In 2006 and 2009 Congress created Special Immigrant Visa (SIV) programs granting a path to permanent residence for Afghans who helped the United States (certain Iraqis are also eligible for this visa), as well as their immediate family members. The number of Afghan immigrants increased significantly after this period: Whereas an average of 2,300 green cards were distributed to Afghans between 2001 and 2013, this number increased to 12,300 between 2014 and 2019, with majority of the new lawful permanent residents (LPRs) from Afghanistan coming through this SIV channel.
Figure 1. Afghan Immigrant Population in the United States, 1980-2019
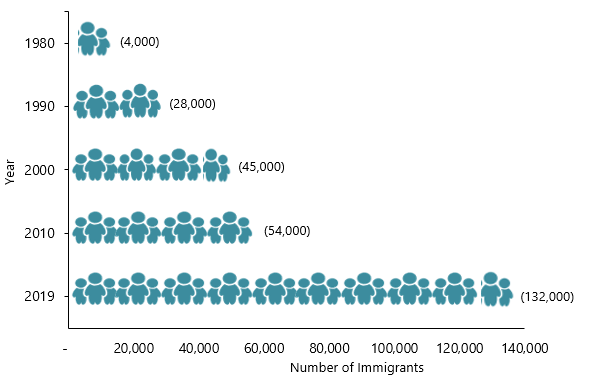
Sources: Data from U.S. Census Bureau 2010 and 2019 American Community Surveys (ACS), and Campbell J. Gibson and Kay Jung, “Historical Census Statistics on the Foreign-born Population of the United States: 1850-2000” (Working Paper no. 81, U.S. Census Bureau, Washington, DC, February 2006), available online.
In all, close to 5.9 million international refugees and other migrants from Afghanistan live outside of the country, according to mid-2020 UN Population Division estimates. Iran is the top destination for Afghans living abroad, accounting for more than 46 percent of all emigrants from Afghanistan. Pakistan is home to the next largest population of Afghans (27 percent), followed by Saudi Arabia (8 percent), Germany (4 percent), and the United States (2 percent).
Click here to view an interactive map showing where migrants from Afghanistan and other countries have settled worldwide.
The primary pathway for Afghans to permanent residence in the United States, also known as holding a green card, is through the SIV program. Afghans are more likely than other immigrants to be children under age 18, but most are adults of working age (18-64). However, Afghan adults are less likely to be in the labor force than immigrant adults of all nationalities. Afghan immigrants are also less likely to be educated than the overall foreign-born and U.S.-born populations, with Afghan women being less educated and less likely to speak English than Afghan men.
Using data from the U.S. Census Bureau (the most recent 2019 American Community Survey [ACS] as well as pooled 2015-19 ACS data), the Department of Homeland Security’s Yearbook of Immigration Statistics, and the World Bank, this Spotlight provides information on the Afghan immigrant population in the United States, focusing on its size, geographic distribution, and socioeconomic characteristics.
Click on the bullet points below for more information:
- Distribution by State and Key Cities
- English Proficiency
- Age, Education, and Employment
- Income and Poverty
- Immigration Pathways and Naturalization
- Health Coverage
- Diaspora
- Remittances
Distribution by State and Key Cities
Immigrants from Afghanistan were concentrated in California (41 percent) and Virginia (18 percent), followed by New York and Texas (7 percent each) during the 2015-19 period. The top four counties by Afghan population were Sacramento County in California, Fairfax County in Virginia, and Alameda County and Contra Costa County in California. Together these four counties were home to 27 percent of Afghan immigrants in the United States.
Figure 2. Top States of Residence for Afghan Immigrants in the United States, 2015-19
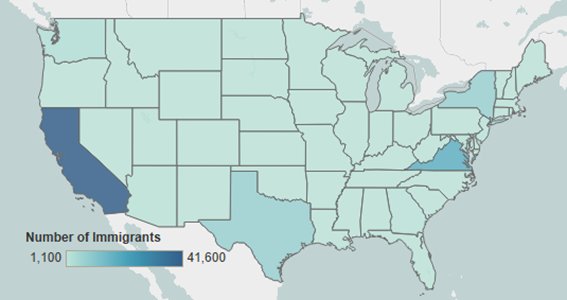
Note: Pooled 2015-19 ACS data were used to get statistically valid estimates at the state level for smaller-population geographies. Not shown are the populations in Alaska and Hawaii, which are small in size; for details, visit the Migration Policy Institute (MPI) Data Hub for an interactive map showing geographic distribution of immigrants by state and county, available online.
Source: MPI tabulation of data from U.S. Census Bureau pooled 2015-19 ACS.
Click here for an interactive map that highlights the states and counties with the highest concentrations of immigrants from Afghanistan and other countries.
The U.S. cities with the largest number of Afghans were the greater Washington DC, Sacramento, San Francisco, New York, and Los Angeles metropolitan areas. These five metro areas accounted for almost 52 percent of Afghans residing in the United States.
Figure 3. Top Metropolitan Areas of Residence for Afghan Immigrants in the United States, 2015-19
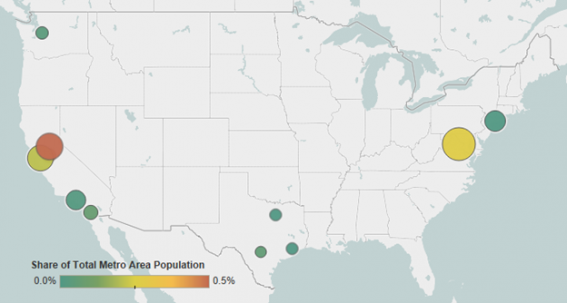
Note: Pooled 2015-19 ACS data were used to get statistically valid estimates at the metropolitan statistical-area level for smaller-population geographies.
Source: MPI tabulation of data from U.S. Census Bureau pooled 2015-19 ACS.
Click here for an interactive map that highlights the metropolitan areas with the highest concentrations of immigrants from Afghanistan and other countries.
Table 1. Top Concentrations by U.S. Metropolitan Area for the Foreign Born from Afghanistan, 2015-19
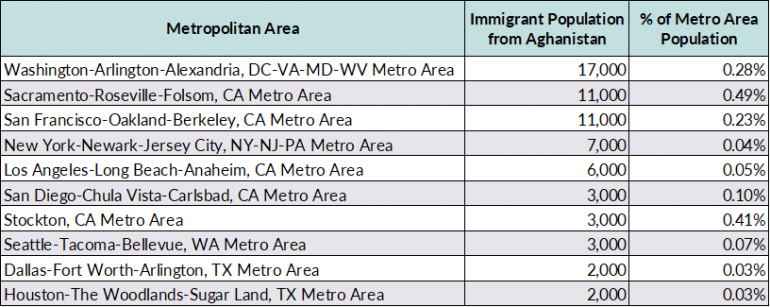
Source: MPI tabulation of data from the U.S. Census Bureau pooled 2015-19 ACS.
Afghan immigrants are less likely to be proficient in English than the overall foreign-born population. In 2019, about 50 percent of Afghans ages 5 and over reported limited English proficiency, compared to 46 percent of all immigrants. Only 6 percent of Afghans spoke only English at home, versus 16 percent of the total foreign-born population.
English proficiency also varies by gender and period of arrival. While immigrant women and girls overall were only slightly more likely to be Limited English Proficient (LEP) than immigrant men and boys (47 percent versus 46 percent, respectively), 59 percent of Afghan women and girls were LEP versus 43 percent of Afghan men and boys. Among those who arrived in the United States in 2010 or later, shares who are LEP were much higher: 75 percent for Afghan women and girls and 51 percent for Afghan men and boys.
As to the languages other than English spoken at home, immigrants from Afghanistan were most likely to speak Persian (Farsi) (42 percent), Pashto (25 percent), and Dari (20 percent). Those who have arrived since 2010 are more likely to speak Pashto (34 percent), followed by Persian (Farsi) (31 percent), and Dari (26 percent).
Note: Limited English proficiency refers to those who indicated on the ACS questionnaire that they spoke English less than “very well.”
Age, Education, and Employment
In 2019, Afghan immigrants were on average younger than both the overall foreign-born population and the U.S. born. The Afghan median age was 33 years, compared to 46 years for all immigrants and 37 years for the native born. This is due to the higher number of Afghan children: 22 percent of Afghan immigrants were under 18, versus only 6 percent of the overall foreign-born population. Compared to the U.S.-born population, Afghans were more likely to be of working age: 68 percent versus 59 percent respectively.
Figure 4. Age Distribution of the U.S. Population by Origin, 2019
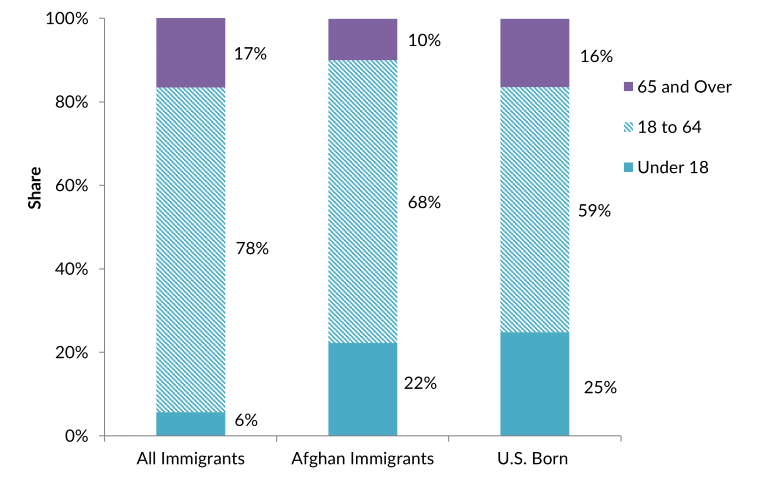
Source: MPI tabulation of data from the U.S. Census Bureau 2019 ACS
Overall, Afghans have lower educational attainment than both the U.S.- and overall foreign-born populations. In 2019, 28 percent of Afghan immigrants ages 25 and older reported having at least a bachelor’s degree, compared to 33 percent of both U.S.- and foreign-born adults. Twenty-five percent of Afghan immigrant adults had less than a high school diploma, similar to all immigrant adults (26 percent).
Educational attainment is much higher among Afghan men: Only 14 percent lacked a high school diploma versus 33 percent of women. Men were also more likely to have a college degree than women (35 percent versus 19 percent). Among recently arrived women, 49 percent did not have a high school education, compared to 19 percent of men.
The higher educational attainment of men, in part, reflects the routes through which many Afghans enter the United States. Many men had worked with the U.S. government as interpreters, translators, or medical staff, which required English proficiency, more education, or both. Lower female educational attainment also reflects longstanding barriers to education for many Afghan women, particularly in rural areas of Afghanistan.
Afghans participate in the labor force at a lower rate than all immigrants. In 2019, 61 percent of Afghan immigrants ages 16 and older were in the civilian labor force, compared to 67 percent of the immigrant population and 62 percent of the U.S. born. Afghan women were less likely to be in the civilian labor force (43 percent) than the overall immigrant female population (57 percent) or U.S.-born women (59 percent).
Afghan immigrants who were employed were much more likely to be in production, transportation, and material moving occupations, followed by sales and office occupations (see Figure 5).
Figure 5. Employed Workers in the Civilian Labor Force (ages 16 and older) by Occupation and Origin, 2019

Source: MPI tabulation of data from the U.S. Census Bureau 2019 ACS.
Afghan immigrants have much lower incomes than the overall foreign- and native-born populations. In 2019, households headed by an Afghan immigrant had a median income of $47,000, compared to $64,000 and $66,000 for all immigrant and U.S.-born households, respectively.
In 2019, Afghan immigrants were more than twice as likely to be in poverty (29 percent) than immigrants overall (14 percent) or the U.S. born (12 percent).
Immigration Pathways and Naturalization
Compared to all immigrants, Afghans are more likely to have arrived in 2010 or later. Arrivals since 2010 account for approximately 60 percent of Afghan immigrants; by comparison 25 percent of the overall foreign-born population arrived in the past decade. Given their recency of arrival, Afghans are less likely to be naturalized U.S. citizens than all other immigrants. As of 2019, 41 percent of Afghan immigrants were naturalized citizens, compared to 52 percent of all immigrants.
Figure 6. Afghan and All Immigrants in the United States by Period of Arrival, 2019

Source: MPI tabulation of data from the U.S. Census Bureau 2019 ACS.
In fiscal year (FY) 2019, 10,140 Afghans became LPRs, accounting for just 1 percent of the more than 1 million people who received green cards that year. Seventy-seven percent of Afghans and dependents who received a green card in FY 2019 had an SIV, followed by 9 percent who adjusted to a green card from refugee or asylee status. About 10 percent obtained their green cards through family reunification (see Figure 7).
Figure 7. Immigration Pathways of Afghan-Born and All Legal Permanent Residents in the United States, FY 2019
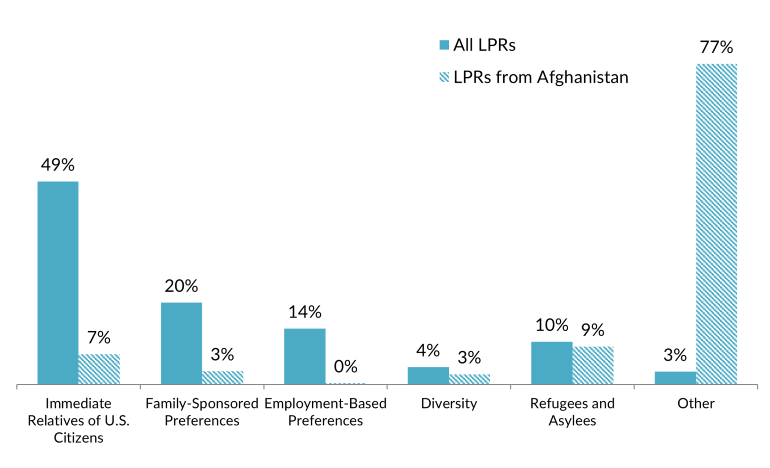
Notes: Immediate relatives of U.S. citizens includes spouses, minor children, and parents of U.S. citizens; Family-sponsored preferences includes adult children and siblings of U.S. citizens as well as spouses and children of green-card holders. The Diversity Visa lottery program was established by the Immigration Act of 1990 to allow entry to immigrants from countries with low rates of immigration to the United States. The law states that 55,000 diversity visas in total are made available each fiscal year.
Source: MPI tabulation of data from Department of Homeland Security (DHS), 2019 Yearbook of Immigration Statistics (Washington, DC: DHS Office of Immigration Statistics, 2020), available online.
Between October 1, 2020 and July 31, 2021 (the latest available data as of this writing), an additional 4,500 Afghans were resettled in the United States as SIV holders. California, Texas, Virginia, Washington, and Maryland were home to close to 80 percent of these new SIV immigrants.
As a population with a high proportion of migrants who often qualify for government assistance programs because of their status as SIV recipients, refugees, and asylum seekers, Afghans have high rates of health insurance coverage compared to the overall immigrant population. In 2019, just 8 percent of immigrants from Afghanistan were uninsured, compared to 20 percent of the total foreign born. Afghan immigrants were also more likely to be covered by public health insurance than the overall foreign- and U.S.-born populations (see Figure 8).
Figure 8. Health Coverage for Afghan Immigrants, All Immigrants, and the Native Born, 2019
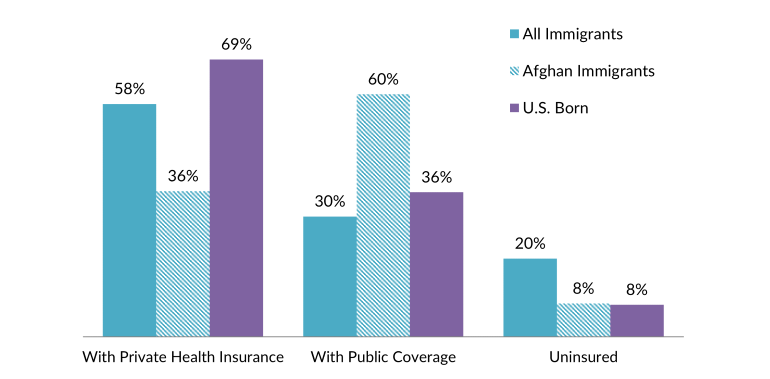
Note: The sum of shares by type of insurance is likely to be greater than 100 because people may have more than one type of insurance.
Source: MPI tabulation of data from the U.S. Census Bureau 2019 ACS.
The Afghan diaspora in the United States is comprised of approximately 182,000 individuals who were either born in Afghanistan or reported Afghan ancestry, according to tabulations from the U.S. Census Bureau 2019 ACS.
Afghans living abroad and others with connections to the country sent about $789 million in remittances to Afghanistan via formal channels in 2020, according to World Bank estimates. That represents an approximately $40 million decline from 2019, likely an impact of the COVID-19 pandemic and related economic crisis. Remittances represented about 4 percent of the country’s gross domestic product (GDP) in 2020.
Figure 9. Annual Remittance Flows to Afghanistan, 2008 to 2020

Note: The 2020 figure represents World Bank estimates.
Source: MPI tabulations of data from the World Bank Prospects Group, “Annual Remittances Data,” May 2021 update.
Click here to view an interactive chart showing annual remittances received by and sent to Afghanistan and other countries.
Sources
Chishti, Muzaffar and Julia Gelatt. 2021. U.S. Government Rush to Evacuate Afghan Allies and Allocate Sufficient Special Visas Comes at Eleventh Hour. Migration Information Source, July 27, 2021. Available online.
Fox, Ben and Ellen Knickmeyer. 2021. US Expects to Admit More than 50,000 Evacuated Afghans. Associated Press, September 3, 2021. Available online.
Gibson, Campbell J. and Kay Jung. 2006. Historical Census Statistics on the Foreign-born Population of the United States: 1850-2000. Working Paper no. 81, U.S. Census Bureau, Washington, DC, February 2006. Available online.
Lipson, Juliene and Patricia Omidian. 1996. Afghans. In Refugees in America in the 1990s: A Reference Handbook, ed. David W. Haines. Westport, CT: Greenwood Press.
Sayed, Nasrat, Fahim Sadat, and Hamayun Khan. 2021. Will the Taliban’s Takeover Lead to a New Refugee Crisis from Afghanistan? Migration Information Source, September 2, 2021. Available online.
Sganga, Nicole, Bo Erickson, Eleanor Watson, and Ed O’Keefe. 2021. Over 50,000 Afghan Evacuees Expected to Resettle in U.S., Says DHS Secretary Alejandro Mayorkas. CBS News, September 3, 2021. Available online.
United Nations Population Division. 2020. International Migrant Stock 2020: Destination and Origin. Available online.
U.S. Census Bureau. N.d. 2019 American Community Survey. Accessed September 1, 2021. Available online.
U.S. Department of Homeland Security (DHS), Office of Immigration Statistics. 2020. 2019 Yearbook of Immigration Statistics. Washington, DC: DHS Office of Immigration Statistics. Available online.
U.S. Department of State, Bureau of Consular Affairs. N.d. Special Immigrant Visas for Afghans - Who Were Employed by/on Behalf of the U.S. Government. Accessed September 7, 2021. Available online.
U.S. Department of State, Bureau of Population, Refugees and Migration. 2021. Amerasian & SIV Arrivals by Nationality and State: October 1, 2020 through July 31, 2021. Available online.
Ward, Alexander. 2021. 'Majority' of Afghan SIVs Left Behind, State Dept. Official Estimates. Politico, September 1, 2021. Available online.
World Bank Prospects Group. 2021. Annual Remittances Data, May 2021 update. Available online.