

Filipino Immigrants in the United States

A nurse looks at a baby. (Photo: Courtney Hale/iStock.com)
Migration from the Philippines to the United States has occurred in several waves since the U.S. annexation of the Philippines in 1898, reflecting close and enduring political, military, and economic ties between the two countries. Over the course of the 20th century, the composition of new arrivals has shifted from primarily agricultural workers to family and economic migrants who work in a range of sectors including education, health care, hospitality, and manufacturing.
In 2021, the most recent year for which data are available from the U.S. Census Bureau’s American Community Survey (ACS), close to 2 million Filipino immigrants resided in the United States, representing more than 4 percent of all 45.3 million U.S. immigrants. They comprise the fourth-largest national-origin immigrant group after Mexicans, Indians, and Chinese. Nearly one in seven immigrants from Asia in the United States in 2021 was from the Philippines.
Most new Filipino lawful permanent residents (LPRs, also known as green-card holders) obtained their status through family reunification channels, either as immediate relatives of U.S. citizens or through other family-sponsored channels. More than one-quarter receiving a green card in fiscal year (FY) 2021 did so through employment preferences.
Filipinos are more likely than other immigrants to have strong English skills and be naturalized U.S. citizens. Compared to immigrants overall and the U.S. born, Filipino immigrants are more likely to hold a college degree and have a higher income, and are less likely to lack health insurance. Filipino immigrants also tend to be older than these groups.
This Spotlight provides information on the Filipino immigrant population in the United States, focusing on its size, geographic distribution, and socioeconomic characteristics.
Click on the bullet points below for more information:
- Size of Immigrant Population over Time
- Distribution by U.S. State and Key Cities
- English Proficiency
- Age, Education, and Employment
- Income and Poverty
- Immigration Pathways and Naturalization
- Unauthorized Immigrant Population
- Health Coverage
- Diaspora
- Top Global Destinations
- Remittances
Size of Immigrant Population over Time
The Filipino immigrant population has grown significantly in recent decades, increasing by 82 percent between 1980 and 1990 and by 50 percent between 1990 and 2000. The relative growth continued at a slower pace in the next two decades, increasing by 30 percent from 2000 to 2010 and 12 percent between 2010 and 2021—a roughly similar rate as that of the overall U.S. immigrant population, 13 percent. The Philippines was the second-largest origin country for immigrants in 1990 and throughout the first decade of the 21st century, after Mexico, but was overtaken by India and China in 2010.
Figure 1. Filipino Immigrant Population in the United States, 1980-2021
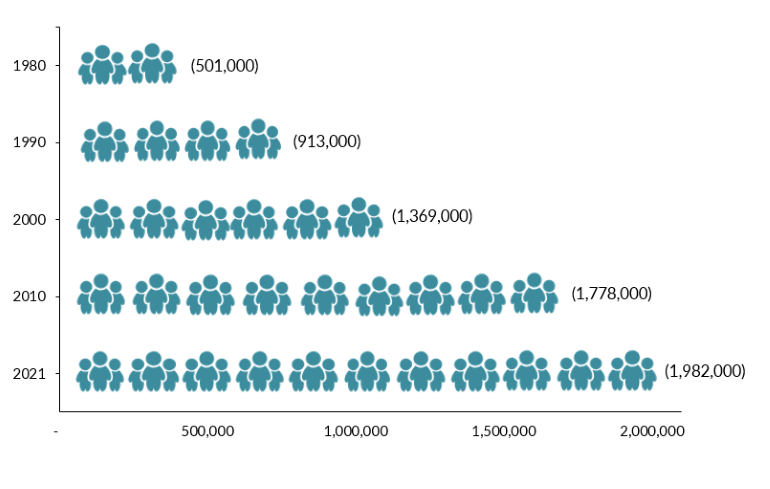
Sources: Data from U.S. Census Bureau 2010 and 2021 American Community Surveys (ACS), and Campbell J. Gibson and Kay Jung, "Historical Census Statistics on the Foreign-Born Population of the United States: 1850-2000" (Working Paper no. 81, U.S. Census Bureau, Washington, DC, February 2006), available online.
Distribution by U.S. State and Key Cities
Immigrants from the Philippines were highly concentrated in California (42 percent), followed distantly by Hawaii (6 percent) in the 2017-21 period. The next four most populous states—Texas, Illinois, Nevada, and New York—were home to approximately 19 percent of the Filipino population collectively. The top four counties for Filipino immigrants were Los Angeles and San Diego counties in California, Honolulu County in Hawaii, and Clark County in Nevada. Together these counties accounted for 25 percent of Filipino immigrants in the United States.
Figure 2. Top States of Residence for Filipino Immigrants in the United States, 2017-21
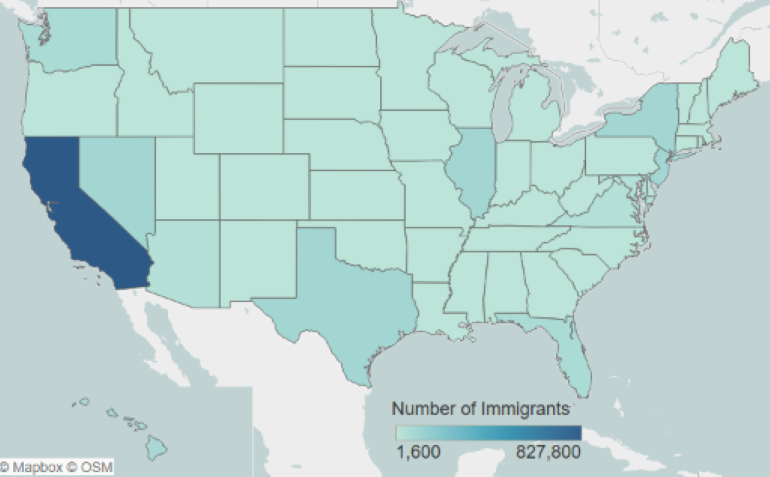
Note: Pooled 2017-21 ACS data were used to get statistically valid estimates at the state level for smaller-population geographies. Not shown is the population in Alaska, which is small in size; for details, visit the Migration Policy Institute (MPI) Data Hub for an interactive map showing geographic distribution of immigrants by state and county, available online.
Source: MPI tabulation of data from U.S. Census Bureau pooled 2017-21 ACS.
Click here for an interactive map that highlights the states and counties with the highest concentrations of immigrants from the Philippines and other countries.
The greater Los Angeles, San Francisco, and New York metropolitan areas were home to 30 percent of Filipino immigrants in the United States. More than 8 percent of all residents in the greater Honolulu area were born in the Philippines (see Table 1).
Figure 3. Top Metropolitan Destinations for Filipino Immigrants in the United States, 2017-21
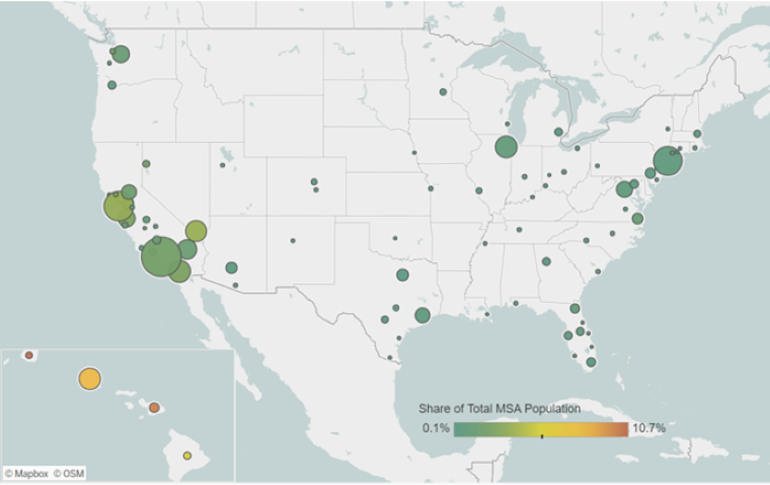
Note: Pooled 2017-21 ACS data were used to get statistically valid estimates at the metropolitan statistical-area level for smaller-population geographies.
Source: MPI tabulation of data from U.S. Census Bureau pooled 2017-21 ACS.
Click here for an interactive map that highlights the metropolitan areas with the highest concentrations of immigrants from the Philippines and other countries.
Table 1. Top Concentrations of Filipino Immigrants by U.S. Metropolitan Area, 2017-21
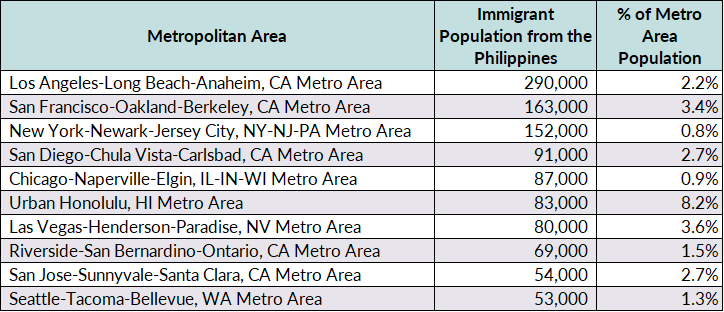
Source: MPI tabulation of data from the U.S. Census Bureau pooled 2017-21 ACS.
Filipino immigrants are more likely to be proficient in English than the overall foreign-born population, even if they are slightly less likely to speak the language at home. In 2021, about 29 percent of Filipinos ages 5 and over reported speaking English less than “very well,” compared to 46 percent of all immigrants. Approximately 16 percent of Filipino immigrants spoke only English at home, versus 17 percent of the overall foreign born.
Age, Education, and Employment
In 2021, Filipinos tended to be older than the overall foreign- and U.S.-born populations. The median age for Filipino immigrants was 52, compared to 47 for all immigrants and 37 for the native born. This is largely due to the disproportionately high number of Filipino seniors: 26 percent of Filipinos were 65 or older, versus 17 percent of both the overall foreign- and native-born populations. Meanwhile, 70 percent of the Filipino population was of working age (18 to 64) compared to 59 percent of the U.S. born and 77 percent of all immigrants (see Figure 4).
Figure 4. Age Distribution of the U.S. Population by Origin, 2021
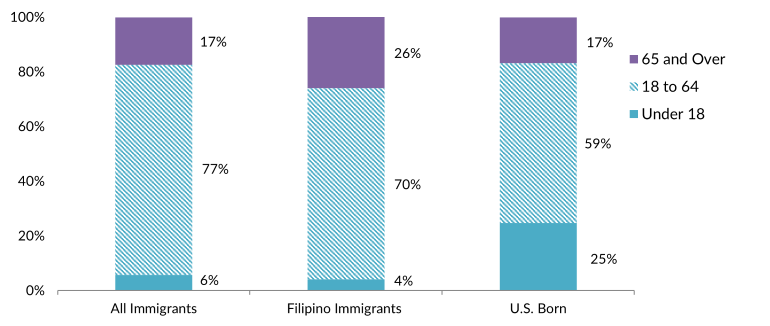
Note: Percentages may not add up to 100 as they are rounded to the nearest whole number.
Source: MPI tabulation of data from the U.S. Census Bureau 2021 ACS.
Filipinos ages 25 and older have much higher education rates than both the native- and overall foreign-born populations. Fifty-one percent of Filipino immigrants reported having a bachelor’s degree or higher in 2021, compared to 35 percent of the U.S. born and 34 percent of all immigrant adults (see Figure 5). Among Filipinos who arrived more recently (between 2017 and 2021), 54 percent of adults held a college degree, a rate higher than that of all recently arrived immigrants (47 percent).
Click here for data on immigrants’ educational attainment by country of origin and overall.
Figure 5. Educational Attainment of the U.S. Population (ages 25 and older) by Origin, 2021
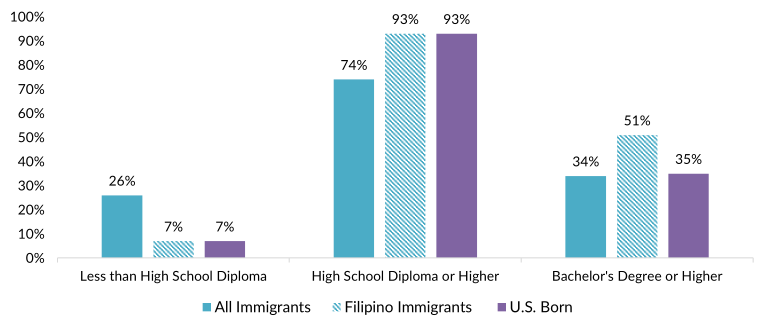
Note: Percentages may not add up to 100 as they are rounded to the nearest whole number.
Source: MPI tabulation of data from the U.S. Census Bureau 2021 ACS.
According to the Institute of International Education, more than 3,000 international students from the Philippines were enrolled in U.S. higher education institutions in the 2021-22 school year, comprising a small share of the total 949,000 international students in the United States. Filipinos represented 7 percent of the nearly 49,000 students from Southeast Asia.
Filipinos participate in the labor force at a similar rate as all immigrants. About 65 percent of Filipino immigrants and 66 percent of all immigrants ages 16 and over were in the civilian labor force, compared to 62 percent of the native born. Filipinos were more likely to be employed in management, business, science, and arts occupations than all immigrants or the U.S. born (see Figure 6). Filipinos represented more than one-quarter of all immigrants working as registered nurses in 2021.
Click here for data on immigrants employed in key health-care occupations by region and country of birth.
Figure 6. Employed Workers in the Civilian Labor Force (ages 16 and older) by Occupation and Origin, 2021
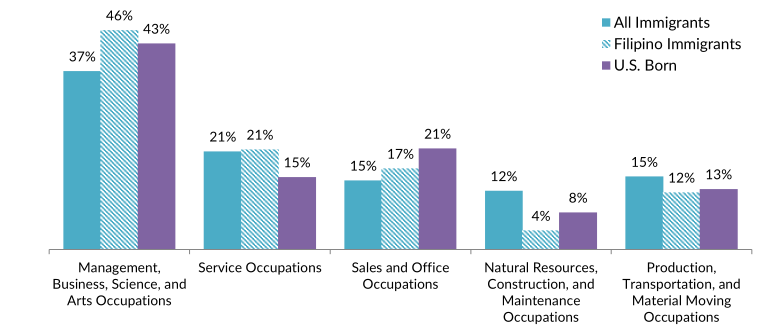
Note: Percentages may not add up to 100 as they are rounded to the nearest whole number.
Source: MPI tabulation of data from the U.S. Census Bureau 2021 ACS.
Filipinos tend to have significantly higher incomes than the overall foreign- and native-born populations. In 2021, households headed by a Filipino immigrant had a median income of $102,000, compared to $70,000 for both all immigrant and U.S.-born households.
In 2021, Filipino immigrants were less than half as likely to be in poverty (6 percent) as immigrants overall (14 percent) or the U.S. born (13 percent).
Immigration Pathways and Naturalization
Filipinos are much more likely to be naturalized U.S. citizens than immigrants overall. In 2021, 74 percent of Filipinos were naturalized citizens, compared to 53 percent of the total foreign-born population.
Compared to all immigrants, Filipinos are slightly more likely to have arrived before 2000. The largest share of Filipinos, approximately 53 percent, arrived prior to 2000, followed by 24 percent coming between 2000 and 2009, and 23 percent in 2010 or later (see Figure 7).
Figure 7. Immigrants from the Philippines and All Immigrants in the United States by Period of Arrival, 2021
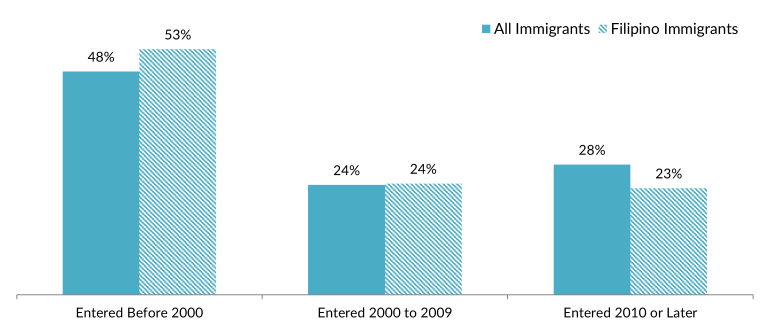
Note: Percentages may not add up to 100 as they are rounded to the nearest whole number.
Source: MPI tabulation of data from the U.S. Census Bureau 2021 ACS.
In FY 2021, the Philippines was the fourth-largest country of origin for new permanent residents. Approximately 27,500 of the 740,000 new LPRs (about 4 percent) were from the Philippines. Most Filipinos who obtain green cards do so through family reunification channels. In FY 2021, 71 percent of Filipinos who received a green card did so as either immediate relatives of U.S. citizens or were sponsored by other family members, higher than the 61 percent of all new LPRs who arrived through those pathways (see Figure 8). About 29 percent of new Filipino LPRs came through employment sponsorship.
Figure 8. Immigration Pathways of Filipino and All Lawful Permanent Residents in the United States, 2021
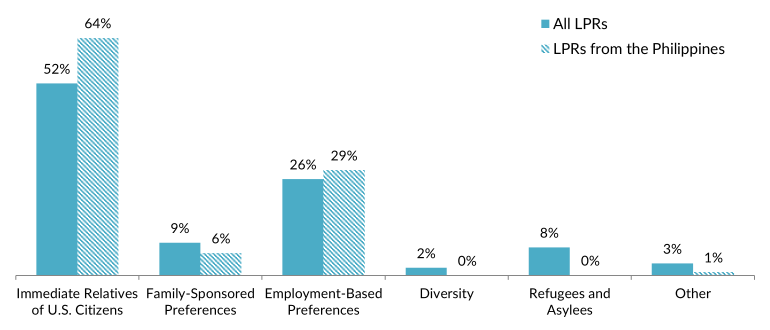
Notes: Immediate Relatives of U.S. Citizens: Includes spouses, minor children, and parents of U.S. citizens. Family-Sponsored Preferences: Includes adult children and siblings of U.S. citizens as well as spouses and children of green-card holders. The Diversity Visa lottery was established by the Immigration Act of 1990 to allow entry to immigrants from countries with low rates of immigration to the United States. The law states that 55,000 diversity visas in total are made available each fiscal year. Individuals born in the Philippines were not eligible for the 2024 lottery. Percentages may not add up to 100 as they are rounded to the nearest whole number.
Source: MPI tabulation of data from Department of Homeland Security (DHS), “Table 10D: Persons Obtaining Lawful Permanent Resident Status by Broad Class Of Admission and Region and Country of Birth: Fiscal Year 2021,” updated September 26, 2022, available online.
Unauthorized Immigrant Population
Although most Filipino immigrants in the United States are legally present, approximately 370,000 were unauthorized in 2019, according to Migration Policy Institute (MPI) estimates, comprising approximately 3 percent of the estimated 11 million unauthorized immigrants.
Click here for an interactive map of the 2019 unauthorized immigrant population in the United States, as well as profiles by state and top counties of destination.
As of March 31, 2023, approximately 2,800 immigrants from the Philippines participated in the Deferred Action for Childhood Arrivals (DACA) program, accounting for less than 1 percent of all 578,700 DACA recipients. DACA provides temporary deportation relief and work authorization to unauthorized immigrants who arrived as children and meet the program’s education and other eligibility criteria.
Click here to view the top origin countries of origin for DACA recipients and their U.S. states of residence.
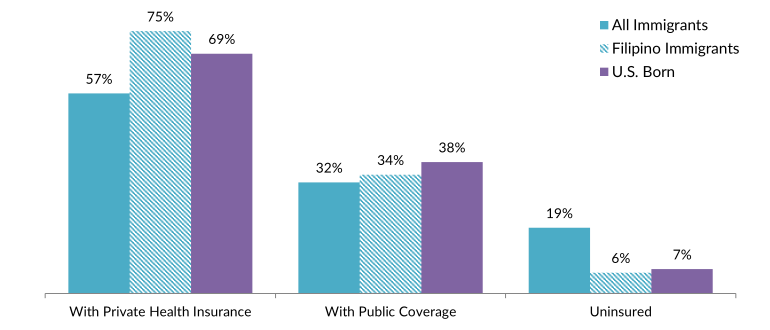
Filipino immigrants have high health insurance coverage rates compared to all immigrants. In 2021, just 6 percent of immigrants from the Philippines were uninsured, a rate much lower than the 19 percent of all foreign born who lacked health insurance. Filipino immigrants were also more likely to be covered by private health insurance than the overall foreign- and U.S.-born populations (see Figure 9).
Figure 9. Health Coverage for Filipino Immigrants, All Immigrants, and the U.S. Born, 2021
Note: The sum of shares by type of insurance is likely to be greater than 100 because people may have more than one type of insurance.
Source: MPI tabulation of data from the U.S. Census Bureau 2021 ACS.
The Filipino diaspora in the United States was comprised of nearly 4.5 million individuals who were either born in the Philippines or reported Filipino ancestry or race, according to tabulations from the U.S. Census Bureau 2021 ACS. People born in the United States accounted for 2.5 million individuals (56 percent) in the U.S.-based Filipino diaspora.
Click here to see estimates of the top 35 diasporas groups in the United States in 2021.
Worldwide, the United States is home to by far the largest number of Filipinos abroad. About one in three international migrants from the Philippines resided in the United States as of the most recent, mid-2020 United Nations Population Division estimates. Other top destinations include Saudi Arabia (645,000), Canada (634,000), the United Arab Emirates (565,000), Australia (286,000), and Japan (275,000).
Click here to view an interactive map showing where migrants from the Philippines and other countries have settled worldwide.
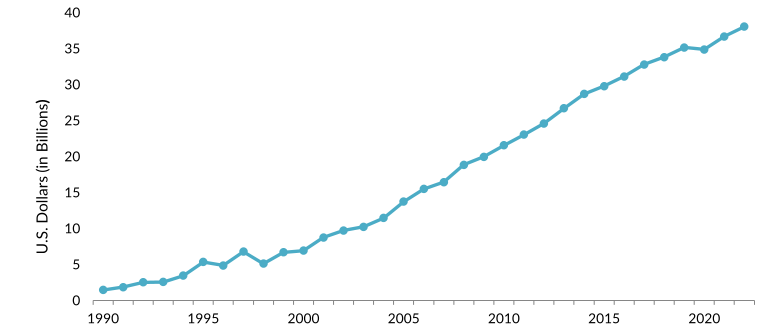
Global remittances sent to the Philippines via formal channels have grown more than fivefold since 2000, reaching an estimated $38 billion as of 2022, according to the World Bank. Remittances represented more than 9 percent of the Philippines’ gross domestic product (GDP). The Philippines represents the fourth-largest global recipient of remittances after India, Mexico, and China.
Figure 10. Annual Remittance Flows to the Philippines, 1990-2022
Source: MPI tabulations of data from the World Bank Global Knowledge Partnership on Migration and Development (KNOMAD), “Remittance Inflows,” June 2023 update, available online.
Click here to view an interactive chart showing annual remittances received and sent to the Philippines and other countries.
Sources
Capps, Randy, Julia Gelatt, Ariel G. Ruiz Soto, and Jennifer Van Hook. 2020. Unauthorized Immigrants in the United States: Stable Numbers, Changing Origins. Migration Policy Institute (MPI) fact sheet, Washington, DC, December 2020. Available online.
Gibson, Campbell J. and Kay Jung. 2006. Historical Census Statistics on the Foreign-Born Population of the United States: 1850-2000. Working Paper no. 81, U.S. Census Bureau, Washington, DC, February 2006. Available online.
Institute of International Education (IIE). N.d. International Students: All Places of Origin. Accessed July 29, 2023. Available online.
Knowledge Partnership on Migration and Development (KNOMAD)/World Bank Group. 2023. Remittance Inflows. Updated June 2023. Available online.
Mabalon, Dawn B. N.d. The Significance of 1946 for Filipina/o Americans. Filipino American National Historical Society. Accessed May 11, 2023. Available online.
Migration Policy Institute (MPI), Migration Data Hub. N.d. Countries of Birth for U.S. Immigrants, 1960-Present. Accessed May 11, 2023. Available online.
---. N.d. Top Diaspora Groups in the United States, 2021. Accessed May 11, 2023. Available online.
UN Population Division. N.d. International Migrant Stock by Destination and Origin. Accessed July 29, 2023. Available online.
U.S. Census Bureau. 2022. 2021 American Community Survey. Access from Steven Ruggles, Katie Genadek, Ronald Goeken, Josiah Grover, and Matthew Sobek. Integrated Public Use Microdata Series: Version 7.0 [dataset]. Minneapolis: University of Minnesota. Available online.
---. N.d. 2021 American Community Survey—Advanced Search. Accessed July 29, 2023. Available online.
U.S. Citizenship and Immigration Services (USCIS). 2023 Count of Active DACA Recipients by Month of Current DACA Expiration as of March 31, 2023. Washington, DC: USCIS. Available online.
U.S. Department of Homeland Security (DHS), Office of Immigration Statistics. 2023. Yearbook of Immigration Statistics 2021. Updated March 3, 2023. Available online.
U.S. Department of State, Bureau of Consular Affairs. 2022. Annual Report of Immigrant Visa Applicants in the Family-Sponsored and Employment-Based Preferences Registered at the National Visa Center as of November 1, 2022. Washington, DC: Bureau of Consular Affairs. Available online.
Vergun, David. 2019. U.S., Philippine Military Relationship Stretches Back to WWII. U.S. Department of Defense, April 1, 2019. Available online.