

Filipino Immigrants in the United States

Click here for larger version of map. Due to compatibility issues, you may need to download the map for it to load properly.
Source Spotlights are often updated as new data become available. Please click here to find the most recent version of this Spotlight.
The number of Filipino immigrants in the United States tripled between 1980 and 2006, from 501,440 to 1.6 million, making them the second largest immigrant group in the United States after Mexican immigrants and ahead of the Chinese, Indian, and Vietnamese foreign born.
Over two-thirds of all Filipino immigrants resided in just five states although their numbers are growing in places like Nevada, North Carolina, and Texas (for more information on immigrants by state, please see the 2006 ACS/Census Data tool on the MPI Data Hub).
Men born in the Philippines have a lower rate of participation in the civilian labor force than immigrant men overall. By contrast, Filipino-born women have a higher rate of participation in the civilian labor force than immigrant women overall, and civilian employed immigrant women from the Philippines are concentrated in health-care and related occupations.
This spotlight focuses on Filipino immigrants residing in the United States, examining the population's size, geographic distribution, and socioeconomic characteristics using data from the U.S. Census Bureau's 2006 American Community Survey (ACS) and 2000 Decennial Census, and the Department of Homeland Security's Office of Immigration Statistics (OIS) for 2006 and 2007.
Click on the bullet points below for more information:
Size and Distribution
- There were 1.6 million foreign born from the Philippines residing in the United States in 2006.
- Filipino immigrants made up 4 percent of all immigrants in 2006.
- Almost half of all Filipino immigrants resided in California in 2006, and over two-thirds of the population were concentrated in five states.
- The size of the Filipino immigrant population grew more than 50 percent in 11 states between 2000 and 2006.
- In five states, the size of the Filipino immigrant population declined between 2000 and 2006.
|
Definitions
|
||
|
Demographic and Socioeconomic Overview
- One of every five Filipino foreign born in the United States arrived in 2000 or later.
- Nearly two-thirds of Filipino immigrants in 2006 were adults of working age.
- Filipino immigrant women outnumbered men by about three to two in 2006.
- The majority of Filipino immigrants were naturalized U.S. citizens in 2006.
- About one-third of Filipino immigrants in 2006 were limited English proficient.
- Nearly half of Filipino foreign-born adults had a bachelor's or higher degree.
- Filipino immigrant women were more likely to participate in the civilian labor force than foreign-born women overall.
- Almost one-third of employed Filipino-born women had health-care and related occupations.
- There were 81,545 Filipino-born veterans of the U.S. Armed Forces in the United States in 2006.
Legal and Unauthorized Filipino Immigrant Population
- The Filipino foreign born accounted for about 4.5 percent of all lawful permanent residents living in the United States in 2006.
- About 984,000 Filipinos have gained lawful permanent residence in the United States since 1990.
- Over half of Filipino-born lawful permanent residents in 2007 were admitted as the immediate relatives of U.S. citizens.
- Filipino-born lawful permanent residents made up 3.8 percent of all those eligible to naturalize as of 2006.
- In 2006, 2 percent of all unauthorized immigrants in the United States were from the Philippines.
- The number of unauthorized immigrants from the Philippines increased 40 percent between 2000 and 2006.
Size and Distribution
There were 1.6 million foreign born from the Philippines residing in the United States in 2006.
The 1960 census counted 104,843 Filipino immigrants, a number that increased 15.6 times to 1,638,413 Filipino immigrants in 2006. The Filipino born were the second-largest foreign-born group in the United States in 2006 after immigrants from Mexico.
Filipino immigrants made up 4.4 percent of all immigrants in 2006.
In 1960, Filipino immigrants composed 1.1 percent of all foreign born in the United States. That share more than tripled to 3.6 percent in 1980 and increased to 4.6 percent in 1990 but decreased slightly to 4.4 percent in 2006 (see Table 1).
|
|
||||||||||||||||||||||||||||||||||||||||
|
||||||||||||||||||||||||||||||||||||||||
Almost half of all Filipino immigrants resided in California in 2006, and over two-thirds of the population were concentrated in five states.
In 2006, California had the largest number of Filipino immigrants (750,056, or 45.8 percent), followed by Hawaii (99,341, or 6.1 percent), New York (87,407, or 5.3 percent), Illinois (85,612, or 5.2 percent), and New Jersey (82,356, or 5.0 percent).
Together, these five states accounted for 67.4 percent (1,104,772) of all Filipino-born immigrants.
Los Angeles-Long Beach-Santa Ana, CA was the metropolitan area with the largest number of Filipino born (257,921, or 15.7 percent), followed by New York-Northern New Jersey-Long Island, NY-NJ-PA (151,969, or 9.3 percent), San Francisco-Oakland-Fremont, CA (148,611, or 9.1 percent), San Diego-Carlsbad-San Marcos, CA (88,283, or 5.4 percent), Chicago-Naperville-Joliet, IL-IN-WI (83,590, or 5.1 percent), San Jose-Sunnyvale-Santa Clara, CA (59,351, or 3.6 percent), and Riverside-San Bernardino-Ontario, CA (51,506 or 3.1 percent). These seven metropolitan areas accounted for 51.3 percent of the 1.6 million Filipino immigrants in 2006.
 |
Map 1. State Proportion of the Filipino-Born Population in the United States (PDF) |
Please note: Due to compatibility issues, you may need to download the map to your computer in order for it to load properly.
Back to the top
The size of the Filipino immigrant population grew more than 50 percent in 11 states between 2000 and 2006.
Between 2000 and 2006, 11 states, most of them with small Filipino immigrant populations, saw the number of Filipino immigrants grow more than 50 percent. These states are Vermont, Connecticut, Iowa, Nevada, North Carolina, Minnesota, West Virginia, Texas, Oregon, Maine, and Arkansas (see Table 2).
|
|
||||||||||||||||||||||||||||||||||||||||||||||||||
|
In five states, the size of the Filipino immigrant population declined between 2000 and 2006.
Between 2000 and 2006, the Filipino immigrant population declined in five states including Louisiana (45.8 percent), Wyoming (30.1 percent), Nebraska (24.0 percent), South Dakota (16.5 percent), and Hawaii (2.7 percent) (see Table 3). Except for Hawaii, the states with the largest percentage declines in the Filipino immigrant population were states with a small foreign-born population from the Philippines.
|
|
||||||||||||||||||||||||||
|
Demographic and Socioeconomic Overview
One of every five Filipino foreign born in the United States arrived in 2000 or later.
As of 2006, 20.9 percent of the 1.6 million Filipino foreign born entered the country in 2000 or later, with 27.3 percent entering between 1990 and 1999, 27.5 percent between 1980 and 1989, 16.1 percent between 1970 and 1979, and the remaining 8.3 percent prior to 1970.
Nearly two-thirds of Filipino immigrants in 2006 were adults of working age.
Of the Filipino immigrants residing in the United States in 2006, 5.7 percent were minors (under age 18), 64.0 percent were of working age (between ages 18 and 54), and 30.3 percent were seniors (age 55 or older).
Of the foreign-born population in the United States in 2006, 8.1 percent were minors, 69.9 percent were of working age, and 22.1 percent were seniors.
Filipino immigrant women outnumbered men by about three to two in 2006.
Of all Filipino immigrants residing in the country in 2006, 58.7 percent were women and 41.3 percent were men.
The majority of Filipino immigrants were naturalized U.S. citizens in 2006.
Among the Filipino foreign born, 62.8 percent were naturalized U.S. citizens in 2006, compared to 42.1 percent among the overall foreign-born population.
About one-third of Filipino immigrants in 2006 were limited English proficient.
About 14.4 percent of the 1.6 million Filipino immigrants age 5 and older reported speaking “English only” while 55.5 percent reported speaking English "very well." In contrast, 30.1 percent reported speaking English less than “very well,” far lower than the 52.4 percent reported among all foreign born age 5 and older.
(Note: The term limited English proficient refers to any person age 5 or older who reported speaking English "not at all," "not well," or "well" on their survey questionnaire. Individuals who reported speaking only English or speaking English "very well" are considered proficient in English).
Nearly half of Filipino foreign-born adults had a bachelor's or higher degree.
In 2006, 49.6 percent of the 1.4 Filipino-born adults age 25 and older had a bachelor's degree or higher compared to 26.7 percent among the 30.9 million foreign-born adults.
On the other end of the education continuum, about 8.9 percent of Filipino immigrants had no high school diploma or the equivalent General Education Diploma (GED), compared to 32.0 percent among all foreign-born adults. About 14.8 percent had a high school diploma or GED compared to 23.8 percent among all foreign-born adults.
Filipino immigrant women were more likely to participate in the civilian labor force than foreign-born women overall.
In 2006, Filipino-born men age 16 and older were less likely to be in the civilian labor force (72.6 percent) than foreign-born men overall (79.3 percent). In contrast, Filipino-born women age 16 and older were more likely to be in the civilian labor force (67.6 percent) than all foreign-born women (55.1 percent).
Almost one-third of employed Filipino-born women had health-care and related occupations.
Among the 599,253 Filipino-born female workers age 16 and older employed in the civilian labor force, 15.0 percent reported working as registered nurses, 6.6 percent reported working as other health-care practitioners, 6.6 percent reported working in health-care support occupations, and 1.3 percent reported working as physicians. Compared to other immigrants, Filipino-born male workers age 16 and older employed in the civilian labor force were also more likely to report working in health-care and related occupations (see Table 4).
Both Filipino foreign-born men and women were significantly less likely to be employed as construction, extraction, and transportation workers than foreign-born men and women overall.
|
|
|||||||||||||||||||||||||||||||||||||||||||||||||||||||||||||||||||||||||||||||||||||||||||||||||||||||||||
|
|||||||||||||||||||||||||||||||||||||||||||||||||||||||||||||||||||||||||||||||||||||||||||||||||||||||||||
There were 81,545 Filipino-born veterans of the U.S. Armed Forces in the United States in 2006.
In 2006, there were 81,545 immigrants from the Philippines who served in the armed forces of the United States (army, navy, air force, marines, or coast guard). The Filipino born composed the largest group among the 658,020 foreign-born veterans (12.4 percent), followed by immigrants from Mexico (10.9 percent), Germany (8.8 percent), and Canada (7.3 percent).
Among these Filipino-born veterans, 27,778 were engaged in active-duty military service during the Vietnam War (August 1964 to April 1975), 5,337 during the Korean War (June 1950 to January 1955), and 7,186 during World War II (December 1941 to December 1946).
(Note: Veterans includes any individual who has served in the military forces of the United States [army, navy, air force, marines, or coast guard] in time of war or peace for any length of time at any place at home or abroad. It excludes current members of the armed forces. Since the American Community Survey data on veterans is based on self-reported responses, they may differ from data from other sources, such as administrative records of the Department of Defense or from the Veterans Administration.)
Legal and Unauthorized Filipino Immigrant Population
The Filipino foreign born accounted for about 4.5 percent of all lawful permanent residents living in the United States in 2006.
According to data from the Office of Immigration Statistics (OIS), the Filipino foreign born accounted for 4.5 percent (540,000) of the 12.1 million lawful permanent residents (LPRs, also known as green card holders) living in the United States in 2006. They are the second-largest LPR group after the foreign born from Mexico (27.3 percent or 3.3 million).
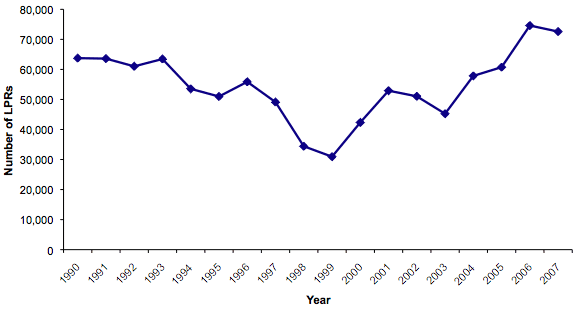
About 984,000 Filipinos have gained lawful permanent residence in the United States since 1990. Between 1990 and 2007, 984,048 Filipino-born immigrants obtained lawful permanent residence in the United States (see Figure 1). The Filipino born accounted for 6.9 percent (or 72,596) of the 1.1 million immigrants who received lawful permanent residence in 2007.
|
|
||
|
Over half of Filipino-born lawful permanent residents in 2007 were admitted as the immediate relatives of U.S. citizens. Of the 72,596 Filipino born granted LPR status in 2007, 57.0 percent (41,416) were immediate relatives of U.S. citizens, 23.7 percent (17,182) were employment-based immigrants, and 18.6 percent (13,535) were family-sponsored immigrants.
Filipino-born lawful permanent residents made up 3.8 percent of all those eligible to naturalize as of 2006. Filipino-born LPRs are the second-largest group of permanent residents eligible to naturalize (tied with LPRs from the Dominican Republic). According to OIS estimates, of the 8.3 million LPRs eligible to apply for citizenship as of 2006, 310,000 (3.8 percent) were born in the Philippines.
In 2006, 2 percent of all unauthorized immigrants in the United States were from the Philippines. OIS has estimated that 280,000, or 2 percent, of the approximately 11.5 million unauthorized migrants in 2006 were born in the Philippines.
The number of unauthorized immigrants from the Philippines increased 40 percent between 2000 and 2006. The estimated number of unauthorized immigrants from the Philippines has increased since 2000, rising from 200,000 to 280,000.
For information about ACS methodology, sampling error, and nonsampling error, click here.
Sources
Baker, Bryan. 2007. Trends in Naturalization Rates. December 2007. U.S. Department of Homeland Security, Office of Immigration Statistics. Available online.
Hoefer, Michael, Nancy Rytina, and Christopher Campbell. 2007. Estimates of the Unauthorized Immigrant Population Residing in the United States: January 2006. August 2007. U.S. Department of Homeland Security, Office of Immigration Statistics. Available online.
Jefferys, Kelly J. and Daniel C. Martin. 2008. Refugees and Asylees: 2007. July 2008. U.S. Department of Homeland Security, Office of Immigration Statistics. Available online.
Rytina, Nancy. 2008. Estimates of the Legal Permanent Resident Population in 2006. February 2008. U.S. Department of Homeland Security, Office of Immigration Statistics. Available online.
U.S. Census Bureau. 2006 American Community Survey. Accessed from Steven Ruggles, Matthew Sobek, Trent Alexander, et al., Integrated Public Use Microdata Series: Version 3.0. Minneapolis, MN: Minnesota Population Center, 2004.
U.S. Department of Homeland Security, Office of Immigration Statistics. 2007 Yearbook of Immigration Statistics, Table 3: Persons Obtaining Legal Permanent Resident Status by Region and Country of Birth: Fiscal Years 1998 to 2007. Available online.