

Foreign-Born Wage and Salary Workers in the U.S. Labor Force and Unions
Today, immigrants make up 12.9 percent of the U.S. population and 15.6 percent of the total civilian labor force. The foreign born often work in sectors of the economy that have traditionally been unionized, such as manufacturing and construction, or in occupations that are increasingly organized, such as services, health care, and education.
Since the 1980s, the nation’s major labor unions have generally distanced themselves from their historical skepticism of immigrant workers and have come to support the foreign born in unionized professions. Some unions have a strong focus on recruiting immigrant workers for union membership and have been active in advocating for comprehensive immigration reform or other liberalized immigration policies.
Partly as a result of this support, the overall number of wage and salary immigrant workers and their proportion in the labor unions have increased over the years. However, native-born workers have been more likely to belong to labor unions through either membership or coverage than their immigrant counterparts since 2005.
This Spotlight looks at the available data on immigrant workers and unions, highlighting variations in union representation rates of immigrant workers across certain sectors. The data are from the Current Population Survey (CPS), March Supplement. The information presented refers to wage and salary workers who are employed and are age 16 or older.
Click on the bullet points below for more information:
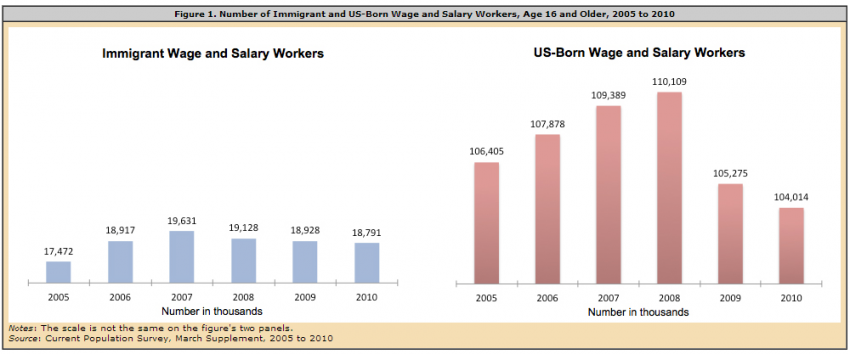
- In 2010, the number of employed foreign-born wage and salary workers stood at 18.8 million, an 8 percent increase over 2005.
- Between 2005 and 2010, the share of all wage and salary workers who were foreign born increased slightly from 14.1 to 15.3 percent.
- Of the 14.8 million union members in 2010, 12 percent were foreign born.
- About 9 percent of immigrant wage and salary workers were union members in 2010.
- Native-born wage and salary workers have been more likely to belong to labor unions than foreign-born wage and salary workers since 2005.
Definitions
Source: Bureau of Labor Statistics. Available Online.In this Spotlight, we use the following definitions: - Union members are members of a labor union or an employee association similar to a union.
- Union-covered workers are workers who report no union coverage but whose jobs are covered by a union or an employee association contract.
- Union-represented workers are workers who are either union members or covered by a union or employee association contract.
- Wage and salary workers are workers who receive wages, salaries, commissions, tips, payment in kind, or piece rates. This includes those employed in both the private and public sectors, but, for the purposes of the union membership, excludes all self-employed persons, regardless of whether or not their businesses are incorporated, as well as those who are unemployed and unpaid family workers.
- All union-affiliated workers are wage and salary workers.
- Between 2005 and 2010, the number of native-born union workers declined by 10.3 percent, while the number of foreign-born union workers declined by only 1.5 percent.
- The proportions of union members among both foreign-born and native-born wage and salary workers have also declined since 2005.
- Among all union members, the share that is foreign born increased slightly from 2005 to 2010.
- Foreign-born wage and salary workers were underrepresented in labor unions compared with their share of all wage and salary workers.
- Foreign-born wage and salary workers were underrepresented in union-covered jobs in the agriculture and mining, information/communications, and construction sectors relative to their share among wage and salary workers in each of the three industries.
In 2010, the number of employed foreign-born wage and salary workers stood at 18.8 million, an 8 percent increase over 2005.
The recent economic recession cut access to employment for both immigrant and U.S.-born workers. The number of employed immigrants fell by 2.6 percent between 2007 and 2008, while the size of the U.S.-born employed workforce continued to rise slowly until 2009 when it fell by 4.4 percent.
Overall, the number of immigrant wage and salary workers in 2010 exceeded the number in 2006, standing at 18.8 million in 2010 compared with 17.54 million in 2005. However, the number of native-born wage and salary workers has not yet rebounded to 2005 levels: there were 104 million native-born employed workers in 2010, 2.2 percent lower than the 106.4 million recorded for 2005.
Between 2005 and 2010, the share of all wage and salary workers who were foreign born increased slightly from 14.1 to 15.3 percent.
According to CPS data from March 2011, the proportion of wage and salary workers who were foreign born increased from 14.1 percent in 2005 to 15.3 percent in 2010. During the same period, the share of foreign born in the total U.S. civilian labor force — which includes unemployed, self-employed, and unpaid family workers in addition to employed wage and salary workers — increased from 14.7 percent (or 21.8 million) to 15.6 percent (or 24 million), while the share of immigrants among the total U.S. population increased from 12.1 percent to 12.4 percent.
Of the 14.8 million union members in 2010, 12 percent were foreign born.
In 2010, there were 14.8 million members of unions in the United States, 1.7 million (or 11.5 percent) of whom were foreign born. The remaining 13.1 million (or 88.5 percent) were native born.
If one includes workers in jobs covered by a union or employee association contract but who were not union members themselves, then immigrants accounted for 11.9 percent of the 16.3 million union-represented workers.
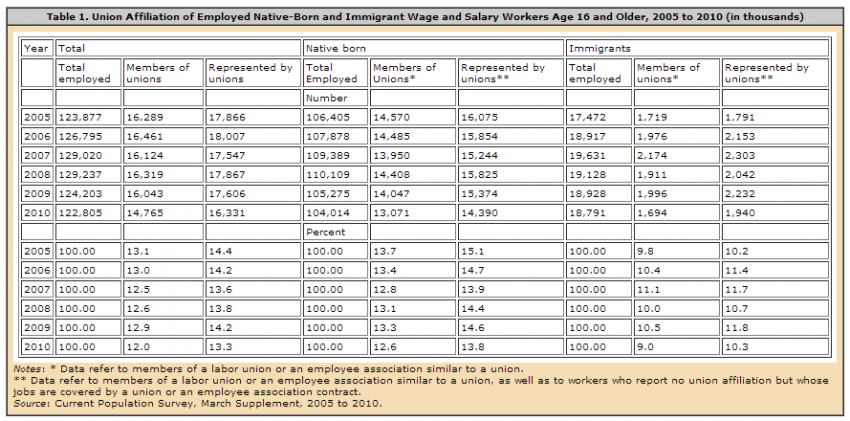
About 9 percent of immigrant wage and salary workers were union members in 2010.
Of the 18.8 million employed foreign-born wage and salary workers in 2010, 1.7 million (or 9.0 percent) were members of labor unions. An additional 247,000 (1.3 percent) were covered by a union or employee association contract, but were not union members themselves. Thus, a total of 1.9 million immigrant workers (or 10.3 percent) had some form of union representation in 2010.
Native-born wage and salary workers have been more likely to belong to labor unions than foreign-born wage and salary workers since 2005.
Native-born wage and salary workers have been more likely to belong to labor unions through either membership or coverage than their immigrant counterparts since 2005. Among the 104 million native-born wage and salary workers in the United States in 2010, 12.6 percent were union members and an additional 1.2 percent were covered by a union or employee association contract. Together they accounted for 13.8 percent of native-born wage and salary workers.
Between 2005 and 2010, the number of native-born union workers declined by 10.3 percent, while the number of foreign-born union workers declined by only 1.5 percent.
The number of union members among both the native born and immigrants fluctuated somewhat over the last five to six years. The number of native-born wage and salary workers in labor unions declined from 14.6 million in 2005 to 14.0 million in 2007, increased slightly in 2008 to 14.4 million, and then fell again to 13.1 million in 2010.
Among immigrants, union membership rose from 1.7 million in 2005 to 2.2 million in 2007, then declined to less than 1.7 million in 2010.
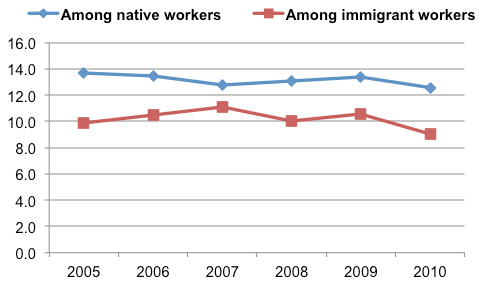
The proportions of union members among both foreign-born and native-born wage and salary workers have also declined since 2005.
In 2005, 9.8 percent of foreign-born wage and salary workers were union members and an additional 0.4 percent were covered by a union or employee association contract. By 2010, union membership had dropped by 0.8 percentage points to 9.0 percent. The overall share of immigrants covered by union representation, however, barely changed between 2005 and 2010.
Similarly, union membership among native-born wage and salary workers decreased 1.1 percentage points over the course of five years, from 13.7 percent in 2005 to 12.6 percent in 2010. In terms of union representation among native-born wage and salary workers, fewer were covered in 2010 (13.8 percent) compared with 2005 (15.1 percent).
|
|
||
|
Among all union members, the share that is foreign born increased slightly from 2005 to 2010.
The number of all union members declined 9.4 percent between 2005 and 2010 (from 16.3 million to 14.8 million) in a trend that can be mostly attributed to a decrease in native-born membership. More specifically, native-born union membership fell by 10.3 percent compared with only a 1.5 percent decline among immigrants. This in turn contributed to a rise in the share of the foreign born among union members: from 10.6 percent in 2005 to 11.5 percent in 2010. Similarly, the union representation rate of foreign-born wage and salary workers in 2010 (11.9 percent) was higher than in 2005 (10.0 percent).
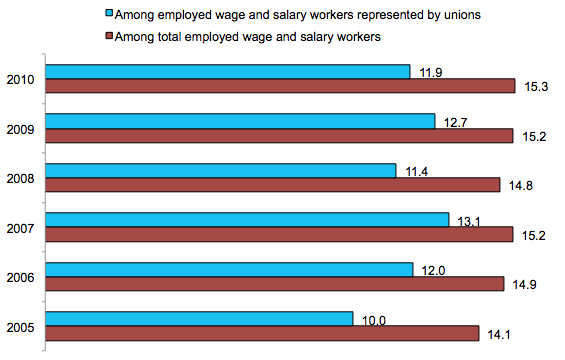
Foreign-born wage and salary workers were underrepresented in labor unions compared with their share of all wage and salary workers.
For each year between 2005 and 2010, the percentages of the foreign born among union-represented workers were lower than the percentages of the foreign born among all employed workers, meaning that foreign-born wage and salary workers were underrepresented in labor unions. For instance, 15.3 percent of all wage and salary workers age 16 and older in 2010 were foreign born, but the foreign born were just 11.9 percent of union-represented workers.
|
|
||
|
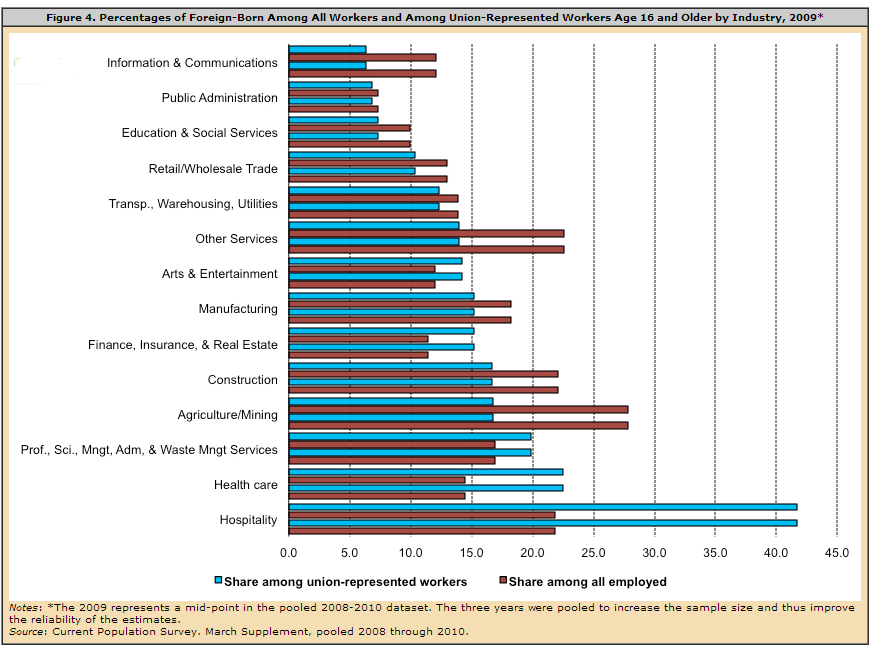
Foreign-born wage and salary workers were underrepresented in union-covered jobs in the agriculture and mining, information/communications, and construction sectors relative to their share among wage and salary workers in each of the three industries.
In most industry groups, immigrants were underrepresented among the union-covered workforce compared with their share in the respective industry group. For instance, relative to their share among all employed wage and salary workers, immigrants accounted for a smaller share of workers with union representation in the agriculture and mining industries (27.8 versus 16.8 percent in 2009†, respectively), information/communications (12.1 versus 6.3 percent), and construction industries (22.0 versus 16.7 percent).
Conversely, the foreign born were overrepresented among workers with union representation in leisure and hospitality (21.9 versus 41.7 percent in 2009*, respectively), health care (14.5 versus 22.5 percent), and professional, scientific, management, and business services (16.9 versus 19.9 percent) when compared with their share among all employed wage and salary workers in those sectors.
Note: *2009 represents a mid-point in the pooled 2008 to 2010 CPS dataset. The three years were pooled to increase the sample size and improve the reliability of the estimates.
Additional Reading
For more information about immigrants in the U.S. labor market, read "The Economic Integration of Immigrants in the United States: Long- and Short-Term Perspectives" by MPI policy analyst Aaron Terrazas. Available Online.